Detection of Lung Nodules using Image Processing
Techniques
Roena Afroze Aenney
Lecturer Dept of CSE Gono Bishwabidyalay
Md. Atikur Rahman
Lecturer Dept of CSE Gono Bishwabidyalay
Md. Karam Newaz
Associate Professor Dept of CSE Gono Bishwabidyalay
ABSTRACT
Lung cancer is characterized by uncontrolled cell growth in tissues of the lung. Recently, image processing techniques are widely used in several medical areas for image improvement in earlier detection and treatment stages, where the time factor is very important to discover the abnormality issues in target images, especially in various cancer tumors such as lung cancer, breast cancer, etc. This paper aims to develop an efficient lung nodule detection system by performing nodule segmentation through thresholding and morphological operations. Thresholding is one of the most powerful tools for image segmentation. The segmented image obtained from thresholding has the advantages of smaller storage space, fast processing speed and ease in manipulation, compared with the gray level image which usually contains 256 levels. Image Segmentation using the watershed transforms works well if we can identify or “mark” foreground objects and background locations, to find “catchment basins” and “watershed ridge lines” in an image by treating it as a surface where light pixels are high and dark pixels are low. Morphological operations apply a structuring element to an input image, creating an output image of the same size. By choosing the size and shape of the neighborhood, it can possible to construct a morphological operation that is sensitive to specific shapes in the input image. Morphological operation has been widely used to produce binary and grayscale images, with morphological techniques being applied to noise reduction, image enhancement, and feature detection. The proposed method has two stages: lung region segmentation through thresholding and then segmenting the lung nodules through thresholding and morphological operations.
Keywords
Computed Tomography, Morphological Operations, Segmentation, Thresholding.
1.
INTRODUCTION
Lung cancer is a leading one among the five main types of cancer to overall cancer mortality contributing about 1.3 million deaths per year globally. A lung nodule is an abnormality that leads to lung cancer, characterized by a small round or oval-shaped growth in the lung which appears as a white shadow in the CT scan. In this matter, the time factor is very important to discover the abnormality issues in target images, especially in various cancer tumors such as lung cancer, breast cancer, etc. There are several different types of lung cancer, and these are divided into two main groups: Small cell lung cancer and non-small cell lung cancer which has three subtypes: Carcinoma, Adenocarcinoma and Squamous cell carcinomas. The rank order of cancers for both males and females among Jordanians in 2008 indicated that
there were 356 cases of lung cancer accounting for (7.7 %) of all newly diagnosed cancer cases in 2008.
Lung cancer affected 297 (13.1 %) males and 59 (2.5%) females with a male to female ratio of 5:1 which Lung cancer ranked second among males and 10th among females.In lung cancer research, one of the most sensitive methods for detecting pulmonary nodules is Computed Tomography (CT), in which a nodule is defined as a rounded and irregular opaque figure on a CT scan, with a diameter up to 30mm. Each scan contains hundreds of images that must be evaluated by a radiologist, which is a difficult process. The difficulties of detecting lung nodules in radiographs are below:
� Nodule sizes will vary widely: Commonly a nodule diameter can take any value between a few millimeters up to several centimeters.
� Nodules exhibit a large variation in density – and Hence visibility on a radiograph– some nodules are only slightly denser than the surrounding lung tissue, while the densest ones are calcified.
� Nodules can appear anywhere in the lung field
So for this reason, the use of a system that can provide an effective solution by assisting radiologists in increasing the scanning efficiency and potentially improving cancer detection. An effective computer-aided lung nodule detection system can assist radiologists in detecting lung abnormalities at an early stage. If defective nodules are detected at an early stage, the survival rate can be increased by up to 50%.
2.
PROPOSED METHOD
In general, a nodule detection system consists of two steps: lung segmentation and nodule candidate detection. Figure 1 shows a general description of the lung nodule detection system. The first stage starts with taking a collection of CT images (normal and abnormal). In this paper, there are different image processing techniques such as Thresholding, filtering, Erosion, morphological operations, and Opening are applied for extraction of lung region. After that, we segment the lung nodules from the segmented lung region. The segmented nodules are used for feature extraction.
The segmented nodules are used for feature extraction. The detected nodules are passed to the proposed system and some features are extracted. The diagnosis rules are then generated from those images and these rules are passed to the classifier for the learning process.
3.
REVIEW OF RELATED WORK
In computer literature, the use of optimal thresholding is a common method for segmenting a lung volume.
For example, Xujiong Ye et al. used a 3D-adaptive fuzzy thresholding method to segment the lung region, since a fixed threshold value has also been used. After thresholding, the lung volume was then extracted from the segmented images using 3D approaches. A 3D connectivity with a seed point in the initial lung region, and 3D-connected component labeling techniques have also been used to segment the lung volume without artifacts. In these cases, the extracted lung volume needs to be refined to include juxta-pleural nodules. Subsequently, due to the complexity of these approaches, several methods have been presented for refining a lung mask. Notably, a rolling ball algorithm has been used for effective lung mask correction, in which the rolling ball algorithm is equivalent to the combination of two fundamental morphological operations: erosion and dilation. More recently, the application of a chain code representation over a lung mask was also proposed an attempt to correct the contours. From the segmented lung volume, nodule candidates have been detected using a number of methods. As examples, Armato et al. and Messay et al. applied multiple gray-level thresholds to the volumetric lung regions to identify nodule candidates. In addition, a number of template-matching based methods have been studied. Brown et al. developed a patient-specific model that could be used in combination with image primitive-matching to find nodules. And Ye et al. proposed a novel template-matching technique based on a genetic algorithm template-matching (GATM) technique
to detect nodules within the lung area; the GA was used to determine the required target position in the observed image. Based on further research, Dehmeshki et al. then improved upon this method by adding a shape-based approach to detect nodules having spherical elements.
Shape-based methods have also been popular in nodule detection. And Ye et al. proposed a shape-based detection method by combining the shape index (local shape information) and dot‘‘ features (local intensity dispersion information); this detection method has provided a good structural descriptor for nodule detection, and other filtering-based methods have been used to detect spherical objects as nodule candidates. Retico et al. subsequently reported an automated procedure for selecting the nodule candidates, based on a filter that enhances the shape of spherical objects.
4.
EXPERIMENTAL DETAILS
A. Preprocessing
Preprocessing is the initial step for detecting lung cancer. The preprocessing step is done in two steps. They are:
1. Denoising
2. Wiener Filter
Image Denoising algorithms may be the most used in image processing. Many methods, regardless of implementation, share the same basic idea noise reduction through image blurring. Blurring can be done locally, as in the Gaussian smoothing model or in anisotropic filtering by calculating the variations of an image. White noise is one of the most common problems in image processing. Even a high-resolution Photo is bound to have some noise in it.
Two such methods are the K Nearest Neighbors and Weiner filters. The RGB image is converted into a grey scale image because the RGB format is not supported in Matlab. Then the greyscale image contains noises such as white noise, salt and pepper noise, etc. This can be removed by using the wiener filter from the extracted lung image.
Typical filters are designed for a desired frequency response. However, the design of the Wiener filter takes a different approach. One is assumed to have knowledge of the spectral properties of the original signal and the noise, and one seeks the linear time-invariant filter whose output would come as close to the original signal as possible. Wiener filters are characterized by the following:
1 Assumption: signal and (additive) noise are stationary linear stochastic processes with known spectral characteristics or known autocorrelation and cross-correlation
2 Requirement: the filter must be physically realizable/causal (this requirement can be dropped, resulting in a non-causal solution)
3 Performance criterion: minimum mean-square error (MMSE)
The orthogonality principle implies that the Wiener filter in the Fourier domain can be expressed as follows:
Where are respectively power spectra of the original image and the additive noise, and
is the blurring filter.
It is easy to see that the Wiener filter has two separate parts, an inverse filtering part and a noise smoothing part. It not only performs the de-convolution by inverse filtering (high pass filtering) but also removes the noise with a compression operation (low pass filtering).
To implement the Wiener filter in practice we have to estimate the power spectra of the original image and the additive noise. For white additive noise, the power spectrum is equal to the variance of the noise. To estimate the power spectrum of the original image many methods can be used.
A direct estimate is the period gram estimate of the power spectrum computed from the observation:
Where, Y(k, l) is the DFT of the observation.
The advantage of the estimate is that it can be implemented very easily without worrying about the singularity of the inverse filtering. Another estimate which leads to a cascade implementation of the inverse filtering and the noise smoothing is:
Which is a straightforward result of the fact: = + . The power spectrum can be estimated directly from the observation using the period gram estimate. This estimate results in a cascade implementation of inverse filtering and noise smoothing:
B. Lung Region Extraction
It is often important to separate regions or objects of interest from other parts of the image. Methods for performing segmentations vary widely depending on the specific application, Imaging modality, and other factors. For example, In some applications, it may be useful to classify image pixels into anatomical regions, such as bones, muscles, and blood vessels, while in others into pathological regions, such as cancer, tissue deformities, and multiple sclerosis lesions.
The purpose of the segmentation of the lung region in the CT image is to achieve a better orientation in the image. The resulting binary images are then analyzed to choose among them the best image that may help in extracting the lung regions from the raw CT-image data with a certain degree of accuracy and sharpness. To refine the chosen image, other techniques were used for different purposes in a sequence of steps. Erosion, median filter, and dilation steps aim to eliminate irrelevant details that may add extra difficulties to the lung border extraction process. The outlining step aims to extract the structure’s borders. The lung border extraction step aims at separating lung structure from all other uninteresting structures.
C. Segmenting Extracted Lung Region
The main purpose of lung segmentation is to separate the voxels corresponding to the lung cavity in axial CT scan slices from the surrounding lung anatomy.
The proposed system includes a method for segmenting lung regions in CT scans: global thresholding is used to obtain the lung region and the thin structures attached to the lung region are cleared using morphological reconstruction.
The CT scan can be separated into two types of voxels, characterized by the density differences between the two anatomical structures. The high-density regions primarily consist of the body surrounding the lung cavity, whereas the low-density regions contain the lung cavity, the air surrounding the body, and other low-intensity regions. To extract the lung volume, we need to segment the low-density regions in the initial stage. For lung image segmentation, when using a histogram method, a fixed threshold value is needed in order to separate the low-density lung parenchyma from the surrounding lung anatomy, though the availability of different scanning protocols makes the selection of an appropriate threshold a challenging task. The appropriate threshold is selected using a global thresholding algorithm. Therefore, after applying a fixed threshold, the subsequent procedure is used to refine the initial segmentation results.
A thresholded image g(x, y) is defined as:
The following iterative procedure is one such approach:
1. Select an initial estimate for T.
2. Segment the image using T. This will produce two groups of pixels: G1 consisting of all pixels with gray level values <T and G2 consisting of pixels with values > T.
3. Compute the average gray level values μ1 and μ2 for the pixels in the regions G1 and G2.
5. Repeat steps 2 through 4 until the difference in T in successive iterations is smaller than a predefined parameter T0.
When there is a reason to believe that the background and object occupy comparable areas in the image, a good initial value for T is the average gray level of the image. When objects are small compared to the area occupied by the background, then one group of pixels will dominate the histogram and the average gray level is not as good an initial choice. A more appropriate initial value for T in cases such as this is a value midway between the maximum and minimum gray levels. The parameter T0 is used to stop the algorithm after changes become small in terms of this parameter. This is used when the speed of iteration is an important issue. Based on the threshold values the lung region is identified from the original CT image. A morphological reconstruction operation is applied after thresholding to extract the lung region alone.
The morphological reconstruction operation is used here to remove the objects that are connected to the image border. One of the useful applications of reconstruction is removing objects that touch the border of an image. Here, the key task is to select the appropriate marker to achieve the desired effect.
The marker image F, is defined as
Where I is the original image.
Then by using I as the mask image, the reconstruction
The Equation yields an image, H that contains only the objects touching the border. The difference, 1-H, contains only the objects from the original image that do not touch the border.
D. Lung Nodule Segmentation
After extracting the lung region from the original image, the lung nodules are segmented using thresholding operation. The threshold values obtained using global thresholding algorithm are used for lung nodule segmentation.
Mathematical morphology is a tool for extracting image components. The operations of MM are originally defined as a set of operations and are used to extract the edges of an image, to filter an image and to skeletonize an image. Here we have used this for filtering the false positives from the detected nodules. Morphological opening removes completely regions of an object that cannot contain the structuring element, smooth‘s object contours, breaks thin connections and removes thin protrusions.
The morphological opening of A by B, denoted B, is defined as the erosion of A by B, followed by a dilation of the
result by B:
The Morphological opening operation is defined as an erosion followed by dilation. This operation is useful for smoothing object contour, breaking narrow links, and eliminates thin protrusions. Together with closing, the opening serves in computer vision and image processing as a basic workhorse of morphological noise removal. Opening removes small objects from the foreground (usually taken as the dark pixels) of an image, placing them in the background, while closing removes small holes in the foreground, changing small islands
of background into the foreground. These techniques can also be used to find specific shapes in an image.
E. Feature Extraction
The Image features Extraction stage is very important in our work in image processing techniques that use algorithms and techniques to detect and isolate various desired portions or shapes (features) of an image. After the segmentation is performed on the lung region, the features can be obtained from it and the diagnosis rule can be designed to exactly detect the cancer nodules in the lungs. This diagnosis rules can eliminate the false detection of cancer nodules resulted in segmentation and provides better diagnosis.
In the literature we found among the features used in the diagnostic indicators:
• Area of the interest • Calcification
• Shape and • Size of nodule
• Contrast Enhancement
Similarly, we experimentally found the above texture features suitable to achieve an accurate diagnosis. As a matter of fact, the first feature (the area of the candidate region or object) is used to:
• Eliminate isolated pixels (seen as noise in the segmented image).
• Eliminate a very small candidate object (Area is less than a thresholding value).
The use of this feature usually eliminates a good number of extra candidate regions that do not have a chance to form a nodule; furthermore, its use tends to reduce the computation time needed in the next diagnostic steps.
The 2nd feature is calcification in which we Diffuse, central, laminated or popcorn calcifications are benign patterns of calcification. These types of calcification are seen in granulomatous disease and hematomas. All other patterns of calcification should not be regarded as a sign of benignity. The exception to the rule above is when patients are known to have a primary tumor. For instance, the diffuse calcification pattern can be seen in patients with osteosarcoma or chondrosarcoma. Similarly, the central and popcorn pattern can be seen in patients with GI-tumors and patients who previously had chemotherapy.
The 3rd feature is Shape Japanese screening studies showed that a polygonal shape and a three-dimensional ratio > 1.78 was a sign of benignity. A polygonal shape means that the lesion has multiple facets. A peripheral subpleural location was also a sign of benignity in this study. The three-dimensional ratio is measured by obtaining the maximal transverse dimension and dividing it by the maximal vertical dimension. A large three-dimensional ratio indicates that the lesion is relatively flat, which is a benign sign.
at high risk for lung cancer. Their findings are listed in the table on the left. They concluded that the benign nodule detection rate is high, especially if lesions are small. Of the over 2000 nodules that were less than 4 mm in size, none was malignant.
The 5th feature is Contrast Enhancement is taken. In this, less than 15 HU has a very high predictive value for benignity (99%). After a baseline scan, 4 consecutive scans at 1-minute intervals are performed.
This applies only for nodules with the following selection criteria:
1. Nodule > 5mm
2. Relatively spherical
3. Homogeneous, no necrosis, fat or calcification
4. No motion or beam hardening artifacts.
F. Applying Diagnosing Indicators
If the area of the candidate region exceeds the threshold value, then it is eliminated for further consideration. This rule will help in reducing the steps and time necessary for the upcoming steps. In this rule Threshold value is considered. For each candidate object, if the area of the object is less than a threshold value deletes it from the candidate list.
Applying this filter has the effect of decreasing the number of false positives that richly exist in the initial candidate objects. This decision may reduce the computation time needed for the diagnostic rules. By implementing all the above rules, the maximum of regions which does not consider as cancerous nodules are eliminated. The remaining candidate regions are considered as cancerous regions. This system helps in neglecting all the false positive cancer regions and helps in detecting the cancer regions more accurately.
5. Experimental Results:
The proposed method for lung cancer detection has been implemented and tested with CT scan images obtained from a Lung Image Database Consortium (LIDC) dataset that provides the chance to do the suggested research. We collected these CT scans images in order to evaluate the proposed system. This method works smoothly even in a complex structure, noise, and uneven illumination.
[image:5.595.321.538.71.247.2]For experimentation of the proposed technique, initially the lung CT image is pre-processed and the lung region is extracted from the CT image by performing thresholding and morphological reconstruction. Then from the extracted lung region, we are segmenting the lung region by using morphological operation. Then the nodules are segmented using thresholding and morphological operation which is used to reduce the number of false positives. The results are shown in the following Figures.
[image:5.595.317.538.76.504.2]Figure 2: Original lung CT image Figure 3: Extracted lung region.
[image:5.595.323.536.258.443.2]Figure 4: Segmented lung region
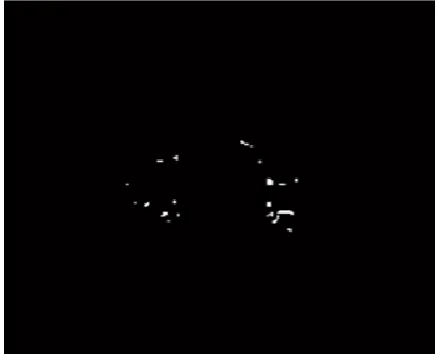
Figure 5: Nodule Detection using Thresholding
Figure 6: Nodule Detection using Morphological Operation
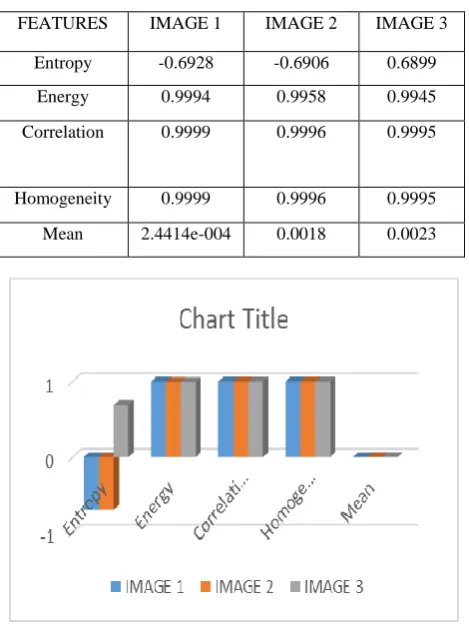
[image:5.595.319.539.466.643.2] [image:5.595.55.270.634.755.2]Table 1: Extracted Feature Values from the Lung Nodule Images
FEATURES IMAGE 1 IMAGE 2 IMAGE 3
Entropy -0.6928 -0.6906 0.6899
Energy 0.9994 0.9958 0.9945
Correlation 0.9999 0.9996 0.9995
Homogeneity 0.9999 0.9996 0.9995
Mean 2.4414e-004 0.0018 0.0023
Fig 7 – Bar Graph of Extracted Feature Values from the Lung Nodule Images
Comparisons have been made with a traditional data thresholding procedure and morphological operation for the detection of lung nodules on a set of patients. The two methods are shown to give about similar results, with the morphological procedure having the advantages of being automated and faster.
6.
CONCLUSIONS
Lung cancer is a major cause of cancer-related deaths; it can be detected early by detecting the lung cancerous nodules. Early detection can improve the survival rate of lung cancer patients.
The main idea of this project is to detect lung nodules and to classify nodules as cancerous and non-cancerous. Thus the lung CT image is subjected to various processing steps and features are extracted for a set of images. The purpose of using the CT-scan image is that it can easily differentiate between the soft tissues and multiple CT-scan images which can be combined to produce a 3-dimensional display.
In this paper, we achieved our purpose in developing a system for early detection of lung cancer by analyzing LUNG CT images using several steps.
The approach starts by extracting the lung regions from the CT image using several image processing techniques. The processing steps include thresholding, morphological operations, and feature extraction. By using these steps the nodules are detected and segmented and some features are extracted. The extracted features are tabulated for future classification.
The future work of this project is to identify the effective features for further classification. Genetic Programming-based Classifiers will be used for the classification of lung CT images as cancerous and non-cancerous by using the identified effective features.
7.
REFERENCES
[1] Non-Small Cell Lung Cancer, Available at: http://www.katemacintyrefoundation.org/ pdf/non-small-cell.pdf, Adapted from National Cancer Institute (NCI) and Patients Living with Cancer (PLWC), 2007, (accessed July 2011).
[2] Tarawneh M., Nimri O., Arqoub K., Zaghal M., Cancer Incidence in Jordan 2008, Available at: http://www.moh.gov.jo/MOH/Files/Publication/Jordan% 20Cancer%2 0Registry_2008%20Report_1.pdf, 2008, (accessed July 2011).
[3] Lung Cancer Database, Available at: https://eddie.via.cornell.edu/cgibin/ datac/signon.cgi, (accessed July 2011).
[4] Gonzalez R.C., Woods R.E., Digital Image Processing, Upper Saddle River, NJ Prentice Hall, 2008.
[5] Cristobal G., Navarro. R., Space and frequency varient image enhancment based in Gabor representation, Pattern Recognition Letters, Elsevier, 1994, 15, p. 273-277.
[6] Krishan A., Evaluation of Gabor filter parameters for image enhancement and segmentation, in Electronic Instrumentation and Control Engineering, Master. Punjab: Thapar University, 2009, p. 126.
[7] Nunes É.D.O., Pérez M.G., Medical Image Segmentation by Multilevel Thresholding Based on Histogram Difference, presented at 17th International Conference on Systems, Signals and Image Processing, 2010.
[8] Venkateshwarlu K., Image Enhancement using Fuzzy Inference System, in Computer Science & Engineering, Master thesis, 2010. [14] N. Senthilkumaran and R. Rajesh, “A Study on Edge Detection Methods for Image Segmentation”, Proceedings of the International Conference on Mathematics and Computer Science (ICMCS-2009), 2009,Vol. I, pp.255-259.
[9] Shapiro L.G., Stockman G.C., Computer Vision: Theory and Applications, Prentice Hall,2001.
[10] Huang Q., Gao W., Cai W., Thresholding technique with adaptive window selection for uneven lighting image, Pattern Recognition Letters, Elsevier, 2004, 26, p. 801-808.
[11] Levner I., Zhang H., Classification-Driven Watershed Segmentation, IEEE Transactions on Image Processing, 2007, 16(5), 1437-45.
[12] Rafael C. Gonzalez and Richard E. Woods, “Digital Image Processing”, Pearson Prentice Hall, 2008.
[13] Milan Sonka, Vaclab Hlavac and Roger Boyle, “Image Processing, Analysis and machine vision”, PWS Publishers,2007.
[14] A. K. Jain, Fundamentals of Digital Image Processing. Englewood Cliffs, NJ: Prentice Hall, 1989.
[16]A.C. Bovik, Digital Image Processing Course Notes, Dept. of Electrical Engineering, U. of Texas at Austin, 1995.
[17]J.C. Russ, The Image Processing Handbook, CRC Press, Boca Raton, FL., 1992.
[18]Bhabatosh Chanda and Dwijest Dutta Majumder, 2002, Digital Image Processing and Analysis.
[19]R.W.Jr. Weeks,(1996). Fundamentals of Electronic Image Processing . Bellingham: SPIE Press.
[20]SingaporeCancerSociety,http://www.singaporecancersoci ety.org.sg.
[21]American Cancer Society, “Cancer Statistics, 2005”, CA: A Cancer Journal for Clinicians,55:10-30, 2005, “http://caonline.amcancersoc.org/cgi/content/full/55/1/10 ”.
[22]B.V. Ginneken, B. M. Romeny and M. A. Viergever, “Computer-aided diagnosis in chest radiography: a survey”, IEEE, transactions on medical imaging, vol. 20, no. 12, (2001).
[23]K. Kanazawa, Y. Kawata, N. Niki, H. Satoh, H. Ohmatsu, R. Kakinuma, M. Kaneko, N. Moriyama and K. Eguchi, “Computer-aided diagnosis for pulmonary nodules based on helicalCT images”, Compute. Med. Image Graph, vol. 22, no. 2(1998),pp. 157-167.
[24]D. Lin and C. Yan, “Lung nodules identification rules extraction with neural fuzzy network”, IEEE, Neural Information Processing, vol. 4,(2002).
[25]B. Zhao, G. Gamsu, M. S. Ginsberg, L. Jiang and L. H. Schwartz, “Automatic detection of small lung nodules on CT utilizing a local density maximum algorithm”, journal of applied clinical medical physics, vol. 4, (2003).
[26]A. El-Baz, A. A. Farag, PH.D., R. Falk, M.D. and R. L. Rocco,M.D.,“detection, visualization, and identification of lung abnormalities in chest spiral CT scans: phase I”, Information Conference on Biomedical Engineering, Egypt (2002).
[27] Linda G. Shapiro and G.C. Stockman., Computer Vision: Theory and Applications. 2001: Prentice Hall.
[28] The DICOM Standards Committee. DICOM homepage. http: //medical.nema.org/, September 2004.
[29] B. Magesh, P. Vijaylakshmi, M. Abhiram, “Computer aided Diagnosis System for identification and classification of Lessions in Lungs”, International Journal of Computer Trends and Technology- May to June Issue 2011.
[30] Rachid Sammouda, Jamal Abu Hassan, Mohamed Sammouda, Abdulridha Al-Zuhairy, Hatem abou ElAbbas, “Computer Aided Diagnosis System for Early Detection of Lung Cancer Using Chest Computer Tomography Images”, GVIP 05 Conference, 19-21 December 2005, CICC, Cairo, Egypt.
[31] Yamomoto. S, Jiang. H, Matsumoto. M, Tateno.Y, Iinuma. T, Matsumoto. T, “Image processing for computer-aided diagnosis of lung cancer by CT (LSCT)”, Proceedings 3rd IEEE Workshop on Applications of Computer Vision, WACV '96, pp: 236 – 241, 1996.
[32] Dr Gurvinder Rull, “Computed Tomography (CT) Scans”, Document Id:1656 Version:22.
[33] Lynne Eldrige MD,”Diagnosis of Lung Cancer”, Reviewed by Medical Review Board, October 31, 2013.
[34] Jin Mo Goo, “A Computer-Aided Diagnosis For Evaluating Lung Nodules on Chest CT: Current Status and Perspective”, Korean Journal of Radiology, Mar-Apr 2011.
[35] Henk Heijmans,”Mathematical Morphological and Image Processing”,RESEARCH AND DEVELOPMENT ERICMS News No.37- April 1999
[36] Rafael C. Gonzalez, Richard E. Woods, Digital Image Processing, Second Edition.
[37] Gleb V. Tchesvski, “Spaial filtering fundamentals”, Spring, ELEN 4304/5365, 2008.