University of Southampton Research Repository
ePrints Soton
Copyright © and Moral Rights for this thesis are retained by the author and/or other
copyright owners. A copy can be downloaded for personal non-commercial
research or study, without prior permission or charge. This thesis cannot be
reproduced or quoted extensively from without first obtaining permission in writing
from the copyright holder/s. The content must not be changed in any way or sold
commercially in any format or medium without the formal permission of the
copyright holders.
When referring to this work, full bibliographic details including the author, title,
awarding institution and date of the thesis must be given e.g.
AUTHOR (year of submission) "Full thesis title", University of Southampton, name
of the University School or Department, PhD Thesis, pagination
U N I V E R S I T Y OF S O U T H A M P T O N
E V O L U T I O N OF A R T I F I C I A L S P A C E D E B R I S C L O U D S
by Simon Barrows ( B . E n g )
T H E S I S S U B M I T T E D F O R D E G R E E OF
D O C T O R OF P H I L O S O P H Y
F A C U L T Y OF E N G I N E E R I N G A N D A P P L I E D S C I E N C E
D E P A R T M E N T OF A E R O N A U T I C S A N D A S T R O N A U T I C S
M A R C H 1996
It's the final frontier - the place to boldly go where no man has gone before. Well it used to be, anyway. These days space is looking more like the final dustbin, where too many men have b^en and left all their rubbish behind.
U N I V E R S I T Y OF S O U T H A M P T O N
A B S T R A C T
F A C U L T Y OF E N G I N E E R I N G A N D A P P L I E D S C I E N C E
D E P A R T M E N T OF A E R O N A U T I C S A N D A S T R O N A U T I C S
D o c t o r of Philosophy
E V O L U T I O N OF A R T I F I C I A L S P A C E D E B R I S C L O U D S
by Simon Barrows ( B . E n g )
Over 120 cases of on-orbit breakups have now been recorded. Many more undetected events are believed to have occurred. Each time an object breaks up, whether by explosion or collision, a cloud of debris is formed. The overall objective of the PhD is to examine the interaction between the debris clouds produced by on-orbit fragmentation events and specific space systems. A breakup event will give rise to concentrations of debris which, for some time after the event, will have spatial densities considerably higher than the background flux. Thus, a detailed knowledge of the extent to which the cloud will grow over a given time period, and an accurate assessment of the risk of collision for a spacecraft passing through it, may prove to be important in mission planning and satellite shielding design.
C o n t e n t s
1 I n t r o d u c t i o n 1
1.1 Background 1
1.1.1 Sources of Space Debris 1
1.1.2 The Hazards of Space Debris 6
1.2 Project Description 14
1.2.1 Project Overview 14
1.2.2 Technical Objectives x 14
1.2.3 Software Development 15
1.3 Thesis Structure 17
2 R e v i e w of Debris Cloud Modelling Techniques 19
2.1 Breakup Modelling 19
2.1.1 Introduction 19
2.1.2 Types of Breakup Model 21
2.1.3 Fragment Distributions 21
2.1.4 Generation of the Debris Cloud 27
2.2 Debris Cloud Evolution and Collision Hazard Analysis 30
2.2.1 Introduction 30
2.2.2 Linearised State Transition Matrix Methods 31
2.2.3 Multi-Phase Models 33
2.2.4 Toroidal Models 34
2.2.5 Non-Linear State Transition Matrix Methods 36
2.2.6 Keplerian Propagation 37
3 M o d e l l i n g of t h e F r a g m e n t a t i o n Event 42
3.1 Introduction 42
3.2 Collision-Induced Breakups 42
3.2.1 Scenario 1 42
3.2.2 Scenario 2 43
3.3 Explosive Fragmentations 50
3.4 Generation of the Debris Cloud 50
3.4.1 Isotropic Continuum Cloud Model 50
3.4.2 Random Fragment Generation 54
3.5 Program BREAKUP 66
3.5.1 Programming issues 66
3.5.2 Results Validation 69
4 Calculation of Fragment Trajectories 85
4.1 Introduction 85
4.2 Orbital Motion 86
4.2.1 Ideal Orbital Theory 86
4.2.2 Predicting a Realistic Orbit 88
4.3 Methods of Orbit Propagation 91
4.3.1 State Transition Matrix Methods 91
4.3.2 Analytic Orbit Propagation 91
4.3.3 Numerical Integration 98
4.4 Program TRAJECTORY 100
4.4.1 Programming Issues 100
4.4.2 Comparison of Propagation Methods 102
4.4.3 Comparison of Results with Actual Orbital Data 114
5 Debris Cloud E v o l u t i o n 122
5.1 Introduction 122
5.2 Application of Fragment Propagation Techniques 123
5.3 Program EVOLUTION3.0 124
5.3.1 Programming Issues 124
5.3.3 Results Validation 132
6 Collision Hazard A n a l y s i s 142
6.1 Introduction 142
6.2 Calculation of Collision Probability 143
6.2.1 Overview 143
6.2.2 Method Implementation 145
6.3 Assessment of Target Survivability 154
6.4 TARGET Description 159
6.4.1 TARGET Versions 159
6.4.2 Program Operation 160
6.5 TARGET Case Studies 163
6.5.1 Overview 163
6.5.2 Single Target Parametric Analysis 163
6.5.3 Comparison of Propagation Methods 171
6.5.4 Target Damage Assessment 176
6.5.5 Satellite Constellations 188
6.6 TARGET Results Validation 196
6.6.1 Cloud-Target Encounter Detection 196
6.6.2 State Transition Matrix Calculation 197
6.6.3 Comparisons with Program DEBRIS 201
6.6.4 Comparison with the ESA MASTER Model 217
6.6.5 Use of Retrieved Spacecraft Debris Impact Data 221
7 Conclusions 230
7.1 Overview 230
7.2 Breakup Modelling 231
7.3 Fragment Trajectory Calculation 232
7.4 Debris Cloud Evolution 233
7.5 Collision Hazard Assessment 234
7.6 Further Work 237
7.7 Summary 239
A Relative M o t i o n Equations 240
List of Tables
6.1 Default target in-flight orientation 154
6.2 Damage assessment numbering scheme 159
6.3 Orbital element pairs 164
6.4 Test cases 179
List of Figures
1.1 Time-history of the catalogued population 2
1.2 Spatial density of debris vs altitude and latitude 4
1.3 Overall sensitivity of the NORAD Space Surveillance Network . . . . 7
1.4 Meteoroid environment compared to recent measurements of the
or-bital debris environment 9
1.5 LDEF intercostal impact frequency averaged over each of the four
primary rov/ directions 11
1.6 SDS software suite 16
2.1 Standardised debris ejection velocity distribution 25
2.2 Orbital coordinate frames 31
2.3 Three phase debris cloud evolution 34
2.4 Opening toroid 35
3.1 Collision schematic 44
3.2 Incident and resultant collision geometries 46
3.3 Macro-fragments 51
3.4 Use of KE equi-partitioning to calculate fragment Avs 53
3.5 Angles used for ejection direction specification 58
3.6 Uniform probability distribution 59
3.7 Forward/backward ejection biasing 59
3.8 Radial spread function 60
3.9 Isotropic fragment spread 61
3.10 Fragment spread with forward biasing 62
3.11 Fragment spread with forward and tangential biasing 63
3.12 Fragment spread with forward and radial biasing 63
3.13 Influence of on P{(/)) 64
3.14 BREAKUP4.0 input control file break4-control 68
3.15 BREAKUP4.0 menu 69
3.16 BREAKUP4.0 flowchart 70
3.17 Fragment mass and ballistic coefficient distributions 71
3.18 Fragment number and Av comparisons for scenarios 1 and 2 72
3.19 Fragment number and Av comparisons for scenarios 3 and 4 73
3.20 Gabbard diagrams for the NOAA-3 breakup 74
3.21 Simulated fragment ejection directions for the NOAA-3 breakup . . . 75
3.22 Gabbard diagrams for the Cosmos 1654 breakup 76
3.23 Gabbard diagrams for the Cosmos 1275 breakup 77
3.24 Gabbard diagrams for the Himawari breakup 79
3.25 Gabbard diagrams for the Cosmos 554 breakup 80
3.26 Gabbard diagrams for the SPOT-1 Ariane breakup 81
3.27 ' V diagrams for the SPOT-1 Ariane breakup 82
3.28 Inclination vs period plots for the SPOT-1 Ariane breakup 83
3.29 Simulated fragment ejection directions for the SPOT-1 Ariane 3 breakup 84
4.1 Geometry of an Earth orbiting body 89
4.2 CIRA-72 density vs altitude profiles, for a range of exospheric
tem-peratures 95
4.3 TRAJECTORY2.0 input control file traj2.control 101
4.4 Comparison of state transition matrix methods with Keplerian
prop-agation ; Case 1 103
4.5 Curl of fragment relative trajectory around breakup orbit 104
4.6 Comparison of state transition matrix methods with Keplerian
prop-agation : Case 2 105
4.7 Comparison of state transition matrix methods with Keplerian
prop-agation : Case 3, out-of-plane motion 106
4.8 Comparison of state transition matrix methods with Keplerian
prop-agation : Case 3, in-plane motion 107
4.9 Comparison of state transition matrix methods with Keplerian
prop-agation : Case 4 108
4.10 Comparison of orbit propagation techniques : Methods 4 and 5 . . . . 109
4.11 Comparison of orbit propagation techniques : Methods 5 and 6 . . . .110
4.12 Comparison of method 6 drag models I l l
4.13 Comparison of orbit propagation techniques : Methods 6 and 1 . . . . 112
4.14 Comparison of orbit propagation techniques : Methods 7 and 8 . . . . 1 1 3
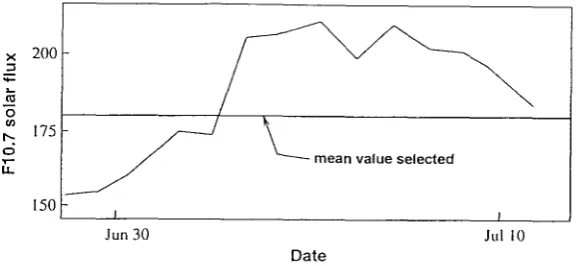
4.15 Fi o , 7 solar flux data for the China 2 rocket analysis 115
4.16 Orbital decay of China 2 rocket 116
4.17 Nodal regression and perigee precession of China 2 rocket orbit . . . . 1 1 7
4.18 i^io.7 solar flux data for the Sky lab 1 analysis 118
4.19 Orbital decay of Sky lab 1 119
4.20 Nodal regression and perigee precession of Skylab 1 120
4.21 Orbital decay of LDEF 120
4.22 Nodal regression and perigee precession of LDEF 121
5.1 Example 1 : Comparison of propagation methods 2 and 3 after 1 orbit 128
5.2 Example 1 : Comparison of propagation methods 3 and 4 after 1 orbit 129
5.3 Example 1 : Comparison of propagation methods 3 and 4 after 10
orbits 130
5.4 Example 2 : Comparison of propagation mist hods 5 and 6 after 20
minutes 131
5.5 Example 2 : Comparison of propagation methods 4, 5 and 6 after 1
orbit 133
5.6 Example 1 : Comparison of propagation methods 4 and 5 after 1 year 134
5.7 Example 1 : Comparison of propagation methods 4 and 5 after 1 year 135
1/4 orbit 136
1/2 orbit 136
1 orbit. . 137
4 orbits . 137 5.8 Comparison of Jenkin and EVOLUTIONS.0 debris clouds
5.9 Comparison of Jenkin and EVOLUTION3.0 debris clouds
5.10 Comparison of Jenkin and EVOLUTION3.0 debris clouds
5.11 Comparison of Jenkin and EVOLUTION3.0 debris clouds
5.12 Gabbard diagrams for the Cosmos 1654 breakup 138
5.13 Gabbard diagrams for the Cosmos 554 breakup 139
5.14 Gabbard diagrams for the SPOT-1 Ariane breakup 140
6.1 Target problem outline 143
6.2 Short- and long-way orbital transfers 147
6.3 Target surface numbering scheme with respect to spacecraft body axes. 153
6.4 Default target in-flight orientation 154
6.5 Three impact category damage model 157
6.6 Target-breakup-object Ae variation 166
6.7 Target-breakup-object A a variation, Ae=0.05 167
6.8 Target-breakup-object Ai variation, Ar2=7r/4rads 168
6.9 Target-breakup-object AQ variation 168
6.10 Target-breakup-object Aco variation 169
6.11 Target-breakup-object A/o variation, w=150deg., A e = 0 . 1 170
6.12 Collision probability distributions : Propagation method 4 172
6.13 Collision probability distributions ; Propagation method 5 174
6.14 Collision probability distributions : Propagation method 6 175
6.15 Comparison of cloud model debris density distributions 176
6.16 ENVISAT-1 satellite 178
6.17 ENVISAT-1 flight orientation # 1 179
6.18 ENVISAT-1 flight orientation # 2 180
6.19 Case 1 results # 1 181
6.20 Case 1 results # 2 182
6.21 Case 1 results # 3 183
6.22 Case 2 results # 1 184
6.23 Case 2 results # 2 185
6.24 Case 3 results # 1 186
6.25 Case 3 results # 2 187
6.26 The Iridium™ constellation 189
6.27 Constellation-threatening breakup scenarios 190
6.28 Constellation collision probability 193
6.29 Assessment of potential collision damage 194
6.30 Collision probability spike caused by cloud encounter 197
6.31 Cloud and target positions immediately before (a), during (b) and
just after (c) the encounter 198
6.32 Cloud and target positions during the encounter 199
6.33 Cloud volume and state transition matrix curves 200
6.34 Perturbed residuals 200
6.35 IMPACT3.0-BREAKUP3.0 comparison 203
6-36 Case 1 : Fragment density encountered by target during first 100
minutes after breakup, DEBR,1S3.1 sinudation 205
6.37 Case 1 : Fragment density encountered by target during first 100
minutes after breakup, TARGETS. 1 simulation 206
6.38 Case 2 : Fragment density encountered by target during first 100
minutes after breakup 207
6.39 Case 2 : Distribution of probability of collision per unit spacecraft
area over fragment encounter velocity magnitude 208
6.40 Case 2 : Distribution of probability of collision per unit spacecraft
area over fragment encounter velocity azimuth 208
6.41 Case 2 ; Distribution of probability of collision per unit spacecraft
area over fragment encounter velocity elevation 209
6.42 Fragment size distributions of Clementine/Titan II fragmentation. . . 2 1 1
6.43 Fragment density distributions of Clementine/Titan II fragmentation. 212
6.44 Gabbard diagrams of Clementine/Titan II fragmentation 213
6.45 Orbital geometry of cloud and shuttle at time of first encounter, 34
minutes after breakup 214
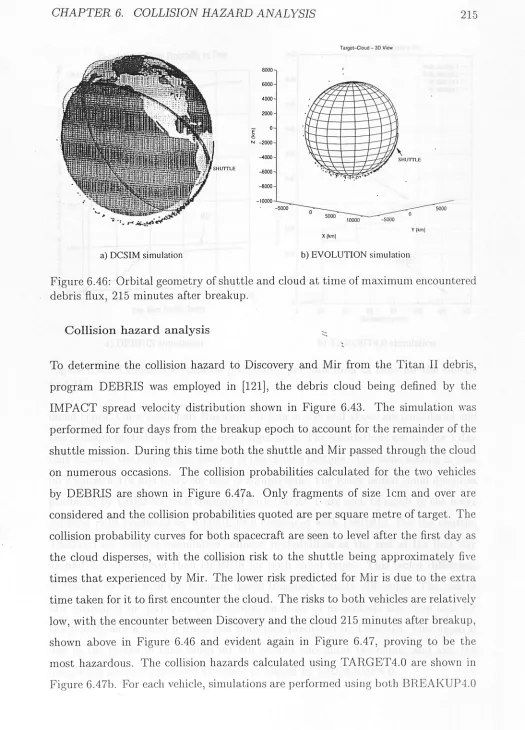
6.46 Orbital geometry of shuttle and cloud at time of maximum
encoun-tered debris flux, 215 minutes after breakup^;. 215
6.47 Cumulative collision probability per unit area vs time for the shuttle
and Mir 216
6.48 Debris flux versus impact velocity 218
6.49 Debris flux versus impact azimuth angle 219
6.50 Debris flux versus impact elevation angle 220
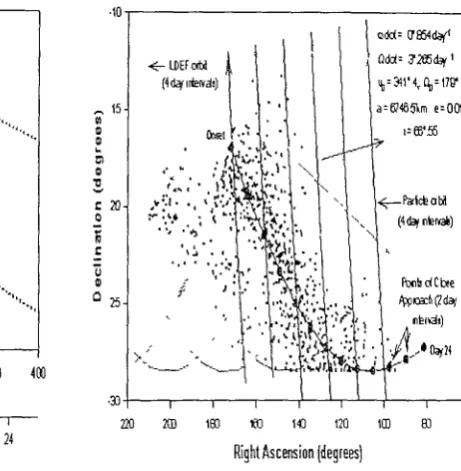
6.51 Surface distribution of May swarm impacts 226
6.52 Orbit checking of Method of Differential Precession solution 227
6.53 Comparison of LDEF impact locations with TARGET4.0-predicted
debris flux distribution 228
A.l Coordinate system 241
Acknowledgements
First of all, a big thank you to Graham for his constant guidance and support over
the last three years and for his rapid but diligent proof-reading of the thesis over
the last few weeks and months.
Thanks also to Adrian and Walter, my internal and external examiners, whose
valuable comments have helped add the finishing polish to the thesis.
Thank you to all the members of academic staff who have endeavoured to fill me
with knowledge over the course of my university career-and to all the secretarial,
administrative and support staff who have helped make life just that little bit easier.
Thank you to my colleagues and friends in the department, both past and
present, who have provided an enjoyable and stimulating working environment.
Thanks to the Particle Physics and Astronomy Research Council, the now
de-funct Science and Engineering Research Council and the British National Space
Centre for funding the research. A special thanks to Richard at the DRA for his
continued support of the work, in both an advisory and financial sense. Thanks also
to my colleagues and friends at DRA Farnborough for making me feel at home over
the last few months.
Thank you to everyone who has helped me enjoy life outside work, in particular
to Wilma for being such a special friend.
And finally to my parents, without whom none of this would ever have happened.
For their unrelenting love and encouragement over the last 26 plus years, I dedicate
this thesis to them.
Chapter 1
Introduction
1.1
B a c k g r o u n d
Since the 'Space Age' began man has continued to pollute the orbital environment.
As with other natural Earth resources such as the oceans, the rainforests and fossil
fuels, man's combination of a systematic disregard for, and a convenient ignorance
of the consequences of his actions has resulted in an unfortunate legacy for future
space users. It is only in the last decade or so that the international spacefaring
community has begun to recognise the seriousness of the problem.
Following the launch of Sputnik 1 in 1957, the number of objects in orbit has
grown steadily (Figure 1.1) [1]. Over 7600 Earth-orbiting objects currently reside
in the U.S. Space Command 'official' catalogue [2], Space debris now represents
a significant hazard to future space operations with around 94% of the catalogued
population being debris objects [3, 4], having total mass of around 3000 tons [3, 4, 5].
1.1.1
Sources of S p a c e D e b r i s
Space debris can be defined as 'those man-made objects in outer space deemed to
be valueless, as evidenced by a lack of operational control' [6]. A more rigorous
definition is 'any man-made Earth-orbiting object which is non-functional with no
reasonable expectation of assuming or resuming its intended function or any other
C%fAP:rER j. INmCWDLrCZnOff
E I USSR/CIS OBJECTS 5 USA OBJECTS
• ESA OBJECTS
• OTHER OBJECTS
i M I I I I I f l M M I I I I I t l l l l l l t l M l l l t l M t l l l
1957 1960 1963 1966 1969 1972 1975 1978 1981 , 1984 1987 1990 1993
YEAR
Figure 1.1: Time-history of the catalogued population [1]
and parts thereof [7], These definitions encompass the four main sources of space
debris, namely inactive pay loads, operational debris, fragmentation debris and
mi-croparticulate matter. Inactive payloads are those formerly active payloads which
can no longer be controlled by their operators. Over 1000 inactive payloads are
cur-rently in orbit [4]. Most of these are spent satellites. Operational debris are those
objects associated with space activities, which remain in outer space. Most of these
objects fall into the category of launch hardware and include rocket bodies, apogee
kick motors, satellite fairings and release mechanisms. Also included are items of
space trash as jettisoned by both American astronauts and Soviet cosmonauts and
various 'odds and ends' ranging from an astronaut's glove to one of the Hubble
Space Telescope (HST) solar arrays. Fragmentation debris is produced when space
objects breakup up as a result of explosions, collisions or possibly other unknown
i. i7v:rftof)[;c]rTo;v 3
objects [4], Explosions may be deliberate, to prevent recovery or as part of
anti-satellite (ASAT) weapons testing for example, or accidental. Accidental explosions
have generally occurred as a result of a propulsion system failure, with 'dead' rocket
bodies (e.g. Delta 2nd stage, Ariane V16 3rd stage) containing fuel residuals being
historically the worst culprits. Apart from the P-78 (Solwind) U.S. ASAT test in
1985, there have been no fragmentations to date which can be irrefutably classified
as being collision-induced. A number of events are suspected of being so, however,
most famously the breakup of Cosmos 1275 [8]. Even though the evidence to support
the collision theory is very strong in some cases, these events are generally
pigeon-holed in the 'unknown' category. The cause of around 40% of the 120 plus recorded
on-orbit breakups remains unknown [4]. Microparticulate particles are thought to
number somewhere in the billions to trillions and are typically in the //m size range.
Such particles are generally produced by exhaust plumes and nozzle erosion from
solid-propellant rocket motors (SRMs) and also spacecraft surface degradation, due
to radiation exposure, thermal cycling and atomic oxygen erosion. Hypervelocity
impacts can also produce very small debris particles.
Disregarding objects beyond geostationary Earth orbit (GEO), space debris is
primarily located in three regions of space: low Earth orbit (LEO), geostationary
transfer orbit (GTO) and GEO. LEO can be considered as being a spherical shell,
bounded below by the Earth's atmosphere at around 200km altitude and above by
more-intense regions of the Van Allen radiation belts at around 4000km altitude.
LEO is the most densely populated region of space, housing a variety of commercial
and military satellites. It is also the region in which manned space activities take
place, e.g. shuttle flights, space stations. Approximately two thirds of debris is in
LEO (three quarters of that below 2000km) [3], mostly in near-circular orbits [4, 9].
Concentrations of debris exist around the 900-1000km and 1400-1500kra [4, 10]
altitude bands due to fragmentations close to these altitudes and the lack of orbital
'cleansing' from atmospheric decay (Figure 1.2) [1]. Models of the debris population
and its long-term evolution [11, 12, 13, 14, 15] indicate that these regions (the
<000
Figure 1.2; Spatial density of debris vs altitude and latitude [1]
objects is reached, the rate of fragment generation from collisions will exceed the
rate of removal by atmospheric drag. Hence a 'chain reaction' or 'collisional cascade'
will occur and the debris population will increase even if no more objects are placed
in orbit. This would render much of near-Earth space unusable. The occurrence
and speed of propagation of such a cascade is found to be dependent on the number
of 'large' objects in orbit, e.g. satellites, rocket bodies, and their location, since the
most likely type of on-orbit collision is 'target-projectile' [11]. This type of collision
corresponds to a larger 'target' object being hit by a much smaller piece of debris.
Thus the likelihood of a cascade occurring would be reduced by limiting the number
of objects left in orbit (e.g. by de-orbiting spent stages/satellites, revising launch
practices), placing satellites in less crowded orbital regions and ideally removing
existing large items of debris [7, 12, 16, 17].
alti-tude orbits (200-300 km altialti-tude) witii GEO. Tliey can be considered to be utility
orbits since they do not contain operational spacecraft, but the debris in GTO is
important as it interacts with spacecraft in both LEO and GEO. The interactions
with LEO spacecraft occur at high relative velocities and on the spacecraft surfaces
which are generally the least protected ('trailing' or 'anti-iiight' faces) [9, 18]. The
lifetimes of objects in GTO can vary enormously (a few months to hundreds of
years) and are influenced by atmospheric drag, the Earth's asphericity and
luni-solar effects. Current launch practices often lead to rocket upper stages being left in
transfer orbits with extremely long lifetimes but through judicious choice of orbital
parameters the lifetimes of these objects, and hence any debris they create, can be
drastically reduced [9, 19, 20].
GEO is a member of the family of geosynchronous orbits (orbits with a period
of rotation equal to that of the Earth). Objects in GEO (approximately 35787 km
above the equator) appear to be stationary from the ground. The advantage of such
an orbit is that GEO spacecraft have a constant view of a large area of the Earth and
are easily tracked with a fixed ground antenna. This has made GEO a very popular
operational orbit for a variety of space activities and some orbital regions are already
overcrowded. In practice, however, perturbations from the non-spherical shape of
the Earth, the gravitational attractions of the Sun and the Moon and solar radiation
pressure cause periodic variations in the altitude and inclination of the orbit. To
counteract these perturbations, active payloads such as telecommunications
satel-lites must periodically perform station-keeping manoeuvres to remain close to their
nominal orbital positions. Inactive payloads and items of space debris are, however,
not controlled and hence their orbits are free to be perturbed by the various forces
acting [21, 22]. These perturbed orbits cross GEO and so pose a collisional hazard
to active payloads, although the relative velocities for such encounters in GEO are
typically much less than those in LEO. Supersynchronous 'parking' or 'graveyard'
orbits can be employed to remove spent satellites from the GEO region at a cost
to the operator but not only is the minimum 'safe' height above GEO a matter of
encroach upon GEO [20, 23, 24].
1.1.2
T h e H a z a r d s of S p a c e D e b r i s
Debris d e t e c t i o n
The space debris environment is not completely defined. The primary source of
information on the numbers, sizes and orbits of space debris is the worldwide
Space Surveillance Network (SSN) operated by the U.S.-Canadian North
Ameri-can Aerospace Defense Command (NORAD). The SSN was not designed and built
with a debris-tracking capability in mind, however, but instead to act as an
early-warning defence system. Attempting to track all debris accurately would not only
be technically unfeasible (sensor limitations, resource saturation) but would also
compromise the primary objectives of the network. The SSN consists of a
combina-tion of radars and optical sensing systems and can provide reliable sensing of objects
greater than Im in diameter up to geosynchronous orbit and as small as 8cm at very
low altitudes (Figure 1.3, redrawn from [10]). Many of the SSN sensors can operate
at a significantly greater resolution than this 'overall' limit but no object can be
catalogued unless two or more sensors can reliably track it. The network sensitivity
is consequently somewhat less than that of the best sensor in the system.
Large items of space debris have re-entered the Earth's atmosphere and hence
posed a small but well publicised threat to people and resources 'on the ground'.
The most notable examples have undoubtedly been the re-entries of Skylab (raining
debris over Australia) and Cosmos 954 (peppering part of north-west Canada with
radioactive fragments) in the late 1970s [25]. These incidents served to increase
governmental and public awareness of the dangers of space junk. The greatest
hazard posed by space debris, however, is not its re-entry into the atmosphere but its
interaction with other 'active' objects in space. From Figure 1.3 it can be seen that
objects smaller than about 8cm in diameter cannot be reliably tracked by NORAD
at any altitude. Particles of this size are large enough, however, to cause serious or
even catastrophic damage to a satellite in a collision. Collision velocities for objects
100000 50000
20000
detected objects
W Q :d
undetected objects
OPTICAL
10000
RADAR
500
-.1 .2 .5 1 2 5 10 20 50 100 200 500
LIMITING DIAMETER, cm
Figure 1.3; Overall sensitivity of the NORAD Space Surveillance Network
high as twice orbital velocity, i.e. around 15 km/s. At'these enormous speeds, a piece
of debris can possess more destructive power (in the form of kinetic energy) than
ten times its equivalent mass in T.N.T. [7]. Herein lies the major hazard of space
debris. Large, catalogued objects can (in theory at least) be tracked and avoided
and are also relatively few in number. Enormous numbers of small particles exist
but these can generally be guarded against by shielding and appropriate spacecraft
design (the largest fragment that can be shielded against is thought to be around
1cm in diameter [4, 26]). Debris in the 1-8 cm-size range cannot be reliably tracked
or detected and due to spacecraft mass constraints cannot realistically be shielded
against. Large numbers of such fragments are thought to exist, possibly several
times the catalogued population [4, 10, 15, 29]. The risk to operational spacecraft
is dependent on orbit altitude and inclination, spacecraft characteristics and the
epoch in question. The probability t h a t a satellite will be hit by a trackable piece of
debris in LEO is thought to be less than 0.01% per year [7, 28, 30] but as spacecraft
get larger, operational lifetimes increase and the debris environment worsens, so the
collision hazard will grow. Collision probabilities in GEO are considerably less than
CHAPTER 1. INTRODUCTION 8
involved. The current hazard in GEO is almost certainly underestimated, however,
due to the inability to detect objects smaller than around Im in diameter.
M e t e o r i t i c debris
Spacecraft were originally designed to operate in an environment where the primary
threat of collisional damage came from meteoroids. These are natural particles which
typically range in size from a fraction of a micron to several millimetres in diameter.
Meteoroids are in heliocentric orbits and encounter the Earth as a consequence of
the intersection of the meteoritic orbits with that of the Earth. They can often be
seen as 'shooting stars' in the night sky and the level of meteor activity varies with
the time of year as the Earth revolves around the sun. Meteors cross the paths
of Earth-orbiting spacecraft at very high speeds, on average around 20km/s [7, 26]
(i.e. double the average LEO collision velocity), but have a much lower density
than man-made objects (around 0.5g/cm^ compared with 2.8g/cm^ for aluminium
alloys) [7, 26]. However they are only transient with respect to near-Earth space.
Early space activities discovered that the threat from meteors was much less than
originally predicted [25] and could be countered with a minimal amount of shielding
and appropriate design practices. Artificial orbital debris now markedly exceeds
the meteor population for objects larger than 1 mm [5, 7, 26] (Figure 1.4, redrawn
from [5]) and as a result is now considered the design environment for manned
and unmanned space systems. It is worth noting however that although the threat
from natural particles may still dominate in GEO [5] and under 'storm' conditions
meteor streams (e.g. Leonid, Perseid) can pose short-lived hazards many times
the 'background' debris level [31, 32, 33]. In fact one of the major threats to the
survivability of space platforms/stations over time-scales of the order of decades
may be the occurrence of meteor storms. The 1993 Perseid outburst caused evasive
manoeuvres to be taken by the HST (oriented so as to present the minimum
cross-sectional area to the stream), delay of the Discovery STS-51 launch, audible impacts
on the Mir-1 space station (with over 2000 impacts recorded for the 24 hours centred
CffAP^TEAl. fAmSCWDCKTrfOff
10
1 2 O ^ 10
- 2 - 4 1) CL 10 o c X P
^ 10
w > p
10
D 10 u
10
1 0 "
GOLDSTONE RADAR
HAYSTACK RADAR
GEODSS TELESCOPES
METEORS CATALOGUE
10 10 '
DIAMETER, cm
10 10
Figure 1.4: Meteoroid environment compared to recent measurements of the orbital debris environment
ESA Olympus satellite. The most likely meteor stream to undergo storm activity
during the next 6 years is the Leonids
Evidence from retrieved spacecraft surfaces
Objects returned from space highlight the severity of the combined debris and meteor
environment. Most notably these have included NASA's Long Duration Exposure
Facility (LDEF), the EUropean REtrievable CArrier (EURECA) and the HST solar
array. Returned spacecraft surfaces can be used to analyse the meteor and debris
populations and to validate/refine environment models.
LDEF provided, by virtue of an unprecedented area-time product and
gravity-gradient stabilisation, a unique study base for identifying debris and meteor flux
components. Meteoroids were found to be dominant for particles around 5 microns
1. IffjTf&ODITCGrTOTV 10
geometries indicated a clear link between the microparticles encountered and Mob
niya orbits [34]. Over 30000 craters were discovered on the spacecraft as a whole,
ranging from less than a micron to 5mm in size [3, 35]. The East (ram), North and
South faces received the majority of the impacts [36], with the ram side dominating
the 'lee' side by around a factor of 10 [35, 37] (Figure 1.5, from [37]).
Simula-tions [18, 38] have shown that debris in elliptical orbits are capable of encountering
the rear faces of spacecraft such as LDEF. Impact crater chemical analysis suggests
that around 10-15% of the impacts on the rear surfaces were caused by orbital
de-bris and probably around double this on the front and side surfaces [5, 39]. The
percentage of debris impacting the trailing and 'end' surfaces is much greater than
originally predicted, indicating the presence of significant amounts (possibly as much
as 30 times the level expected [35]) of debris in highly elliptical, low inclination,
or-bits [40]. Generally, however, both the meteor and debris fluxes derived from LDEF
crater data showed reasonable agreement with modeljjredictions [39, 41].
Data from the EURECA spacecraft supports the LDEF-derived fluxes.
EU-RECA's attitude was sun-pointing and its impact record was found to lie between
the LDEF maximum (ram face) and minimum (trailing face) accordingly [42]. Over
1000 impacts were recorded on the EURECA and HST arrays which are visible to
the naked eye (the largest craters being in the 0.5-1 cm size range) but there was no
functional failure on either EURECA or the Hubble array which can be related to
an impact [43]. The impact records of LDEF, EURECA and the HST array suggest
that the debris and micrometeor environment is unlikely to cause catastrophic
fail-ures on Space Station Alpha, but over the course of its lifetime the station will be
hit repeatedly and most likely suffer a number of 'small' failures [35]. The measured
crater flux from a French debris/meteor experiment deployed outside the Russian
MIR space station was found to be higher than expected when compared with that
determined from LDEF, however, even taking into account the differences in orbital
altitude and inclination between the two spacecraft. It is possible, therefore, that
the environment of a permanently manned space station is populated by a large
CHAPTER 1. INTRODUCTION 11
A v e r a g e LD^F(Zraiar'mg F r e q u e n c y / Y e a r
1000
re 100
0)
E
10
M
2 o 1
0.1
•
:
^ — - —LEGEND
; * * — ^ - North
I
--N \
• East —— —-South
/ ~^West
:
10 100 1000
Crater Diameter (pm)
(Data from JSC Detailed Scans of LDEF Intercostals)
10000
Figure 1.5; LDEF intercostal impact frequency averaged over each of the four pri-mary row directions
the background level [42]. It has also been suggested that the greatest collision risk
to Alpha is itself, or more precisely debris created by construction/servicing craft in
similar orbits [44].
The LDEF Interplanetary Dust Experiment (IDE) [45] provided a unique
spatio-temporal insight into the fluxes of both orbital debris and micrometeoroids, with
nearly a year's worth of d a t a being obtained. One of the major findings of the
ex-periment was the discovery of debris in the form of orbiting clouds of micron-sized
particles. Most of the 15000 impacts recorded were associated with debris 'swarms',
the events occurring at the same place each orbit for a number of successive orbits.
The episodic nature of the impacts indicates that the particles were almost certainly
man-made (e.g. from SRM burns, spacecraft surface erosion). The highest impact
(Tff/LjSGTf&Ft j. irVTrfKlDUCTfOfV 12
obviously has serious implications on models which assume that the debris
environ-ment is relatively isotropic. The results of IDE experienviron-ment are discussed in more
detail in Chapter 6.
T h e U.S. space shuttle
The space shuttle has been both a creator and a victim of space debris. For example,
the first 8.2 days of data from the IDE experiment had to be discarded due to
contamination from the shuttle (Challenger) which placed LDEF into orbit. This
period (2.4% of the experiment duration) produced 36% of the total number of hits
recorded on the Earth face low sensitivity detectors, 14% on the West face and 9%
on the Space face [45]. Orbital debris, however, has been found to be the cause of
the majority of the pits found in the STS outer windows and is responsible for nearly
90% of the 50 plus windows that have required replacement since the shuttle program
began in 1981 (the most celebrated case of a debris impact being the STS-7
paint-fleck in 1984) [25, 46]. Shuttle operational practices (Flight Rule 2-77) specify that
the orbiter adopt the 'safest' orientation (tail forwards and cargo bay towards Earth)
wherever possible, as long as mission objectives are not compromised. Similarly,
avoidance manoeuvres are only carried out if objects are projected to encroach
into or close to the shuttle's 5x2x2km 'manoeuvre box' (5km in the along-track
dimension, 2km in the radial and normal directions), the collision risk is diminished
by the manoeuvre (i.e. the probability of moving out of the way of the object is
greater than the chance of actually moving into its path through imprecise knowledge
of its orbit, or alternatively moving into the path of another object) and mission
objectives are not severely affected. Two such encounters occurred in relatively rapid
succession in 1991 when Atlantis 'dodged' a 1 tonne plus object on November 19,
just three months after Discovery manoeuvred to avoid the Cosmos 955 rocket body.
This was the first time that an orbital debris avoidance manoeuvre was performed
j. ifvirftODL/CjrfOf/ 13
Space station A l p h a
The increasing hazard of orbital debris means that the policy of disregarding the
possibility of a severely damaging or even catastrophic collision is unacceptable for
Space Station Alpha. Alpha will be much larger than the shuttle (bigger target),
be in-orbit for much longer (larger cumulative debris fiux) and also be less able to
'move out of the way' of an on-coming object in the time available (more warning
needed). These factors make the collision avoidance problem for the proposed space
station quite different from that of the orbiter. An on-board passive optical/IR
sensor [47], used in conjunction with an active radar to filter out false alarms
(oth-erwise 'switched off' to save on power), could only provide a few minutes warning
of an impending collision. This would only give enough time for the crew to carry
out a few emergency procedures to minimise collision damage and risk to life
be-fore the potential impact. Another problem would be the number of false alarms
that could be registered if the manoeuvre box was set- too large. Space station
activities will tend to be complex with experiments possibly taking hours to
ac-tivate/deactivate and extravehicular activity (EVA) and free flyer outings causing
long collision-preparation times. The use of a multi-'alert level' safety procedure
and carefully chosen 'acceptable-danger' criteria would help to reduce the number
of expected manoeuvres to a reasonable level. Improved object detectability
tech-nology (both ground and in-orbit) would reduce the number of manoeuvres required
and, of course, improve overall mission safety [48]. As stated at the beginning of
this section, however, a 'data-gap' currently exists where potentially 'lethal' debris
cannot be reliably tracked. It is in this area where modelling of the debris
environ-ment is most germane and indeed provides the only real estimates of the collision
hazard for spacecraft with these dangerous and extremely numerous 'mid-size' pieces
of debris. As fragmentation events are the dominant source for the production of
this type of debris, the modelling of on-orbit breakup events, and the risk they pose
to existing and future spacecraft, is of vital importance in assessing the hazards to
1.2
P r o j e c t D e s c r i p t i o n
1.2.1
P r o j e c t O v e r v i e w
The funding for the work described in this thesis was initially provided by the BNSC
(British National Space Centre) and channeled into a CASE (Cooperative Award in
Science and Engineering) PhD project by the DRA (Defence Research Agency) at
Farnborough. The main aims of the CASE scheme are to help forge a stronger link
between industry and academia, allowing industry to play a driving role in certain
key areas of university research and providing students with experience outside the
academic environment. The technical objectives of this PhD were, therefore,
pri-marily set out by the needs of the sponsor, the DRA, with the direct usefulness and
relevance of the work to the space industry being a major concern. Fortunately, the
potentially conflicting interests of the sponsors needs and the PhD's demands for
originality of work have been met together through the development of
state-of-the-art simulation software. The software produced complements the DRA's existing
and developing capabilties and has been written with the requirements of satellite
designers and operators firmly in mind. Included in the software are a number of
novel developments which also make the work eminently suitable for PhD
consid-eration. The software is as applicable for pure scientific research as it is for the
performance of industrially-focussed case studies.
1.2.2
Technical O b j e c t i v e s
The overall objective of the PhD is to examine the interaction between the debris
cloud produced by an on-orbit fragmentation event (e.g. a hypervelocity collision
or explosion) and specific orbiting space systems (satellites, satellite constellations,
space stations). Such a breakup event will give rise to concentrations of debris which,
for some time after the event, will have spatial densities considerably higher (possibly
by orders of magnitude) than the background flux. Thus, a detailed knowledge of
the extent to which the cloud will grow over a given time period, and an accurate
J. 15
for mission planning and satellite shielding design. Current shielding strategies
generally tend to focus on the satellite's ram face, where the majority of debris
impacts will normally be registered, and consider only the background debris flux.
Quantifying the additional collision risk from debris clouds will help to either support
existing spacecraft protection methodologies or show the need for revisions in current
practices.
Modelling the evolution of a space debris cloud and the collision risk associated
with it is essentially a two-stage process. First of all there is the necessity to simulate
the fragmentation event itself. This takes the form of a quantitative description of
the event with regard to the distributions of fragments produced and the processing
of these distributions to yield a set of parameters which describe the breakup in a
form which can serve as input to the second stage of the overall simulation. On
receipt of the output from the fragmentation model, the debris cloud propagator
can then evolve the cloud forward in time and the desired analysis on the spread
of fragments produced can be performed. This analysis may take the form of an
investigation into the size, shape and general behaviour of the cloud itself or
alter-natively may concentrate on the cloud's interaction and possible collision with other
orbiting objects.
1.2.3
S o f t w a r e D e v e l o p m e n t
Simulation software has been developed and written, from scratch, to implement
both the existing models used and the new ones developed. The SDS (Space Debris
Simulation) software suite consists of four main Fortran 77 programs (Figure 1.6), a
shared library of 'calculation' modules and a Matlab-based graphical interface with
numerous customised data-processing and plotting routines. The integrated
struc-ture of the software developed enables a wide variety of analyses to be conducted
and simulations of both historic and potential future orbital fragmentation events to
be performed. Program BREAKUP uses a combination of empirical and analytical
models to simulate catastrophic and non-catastrophic collisions, and also variable
16
vbLUtioN3.0 ^
SDS Software Suite : Main Programs
inA3E€T0By?rn
Figure 1.6: SDS software suite
model for producing and controlling non-isotropic fragment spreads.
TRAJEC-TORY acts as a test-bed for orbit propagation techniques, providing the facility
for convenient and direct method comparison. EVOLUTION enables the complex
dynamics of debris growth to be visualised and in particular the effects of
propaga-tion method to be examined. Program TARGET employs a novel implementapropaga-tion
of the method of probabilistic continuum dynamics to perform collision hazard
as-sessments for spacecraft which encounter debris clouds. Among the additional new
developments available for use in TARGET are the consideration of atmospheric
drag, a direct interface with a non-isotropic cloud model, the use of a cellular target
spacecraft representation and impact energy-related damage assessment algorithm,
and a built-in satellite constellation analysis facility.
The SDS suite constitutes a fully-integrated software package, orginally written
to operate in X-Windows on the Sun Sparc workstation cluster in the Department
of Aeronautics and Astronautics at the University of Southampton. The software
has also been installed at the DRA in Farnborough and has been fully documented
according to the retrospective application of the DRA's Informal Software
Stan-i . Stan-irV^TftODf/C^jTZO/V 17
dards [49]. The modelling capabilities of the SDS software suite are illustrated and
tested through the use of several case studies, including the simulation of several
historic fragmentation events and the debris cloud collision risks to EN VIS AT-1 and
the Iridium™ satellite constellation. The results produced by the software are
val-idated by comparisons with other simulation software and, wherever possible, with
actual breakup event, debris impact and object orbit data.
1.3
T h e s i s S t r u c t u r e
The structure of the thesis follows a logical progression through the various stages
of the overall modelling approach and the software developed. Chapter 2 sets the
scene for the remainder of the thesis by reviewing the current state-of-the-art in
debris cloud modelling, looking at both the simulation of the breakup event and the
subsequent evolution of the fragments produced. The various techniques employed
to calculate collision probabilities for spacecraft encountering the cloud are also
discussed.
Chapter 3 describes the models used to simulate an on-orbit fragmentation event
and how these models are implemented into program BREAKUP. The different
breakup scenarios are discussed and compared, and the different methods employed
to generate a debris cloud from the fragment distributions produced are outlined.
Particular attention is given to BREAKUP'S novel parametric technique for creating
a non-isotropic spread of fragments. Program BREAKUP is then used to simulate
a number of actual documented fragmentation events for results validation and to
'showcase' the new non-isotropic cloud model.
Chapter 4 examines a variety of orbit propagation techniques applicable to
frag-ment trajectory calculation. These include two linearised relative motion methods,
Keplerian propagation, Keplerian propagation with the analytical addition of
per-turbation effects and numerical integration. The implementation of these
meth-ods, along with a novel second-order state transition matrix method, into program
which also serves as a test-bed for the techniques employed in EVOLUTION and
TARGET. TRAJECTORY is used to compare the various methods installed for a
number of test cases and results validation is conducted through the simulation of
actual satellite orbits.
Chapter 5 considers the evolution of a debris cloud under a number of the
prop-agation techniques described in Chapter 4. The implementation of these methods
into program EVOLUTION is described and the dynamics of debris cloud growth
are analysed, with particular attention given to the cloud's regions of high debris
density and the effects of orbital perturbations. The results from EVOLUTION are
validated by the comparison of cloud shapes with those generated by another code
for a test example and through the coupling of EVOLUTION with the BREAKUP
non-isotropic cloud model to produce 'decayed' Gabbard diagrams for actual
frag-mentation events.
Chapter 6 focuses on the collision hazard the debiis. cloud poses to spacecraft
which fly through it. The novel implementation of the probabilistic continuum
dy-namics method of collision probability calculation used in program TARGET is
described in some detail, as is TARGET'S unique 'building-block' spacecraft
rep-resentation and method of collision damage assessment. Single and multi-target
(i.e. satellite constellation) case studies are utilised to illustrate the program's
ca-pabilities and assess current spacecraft protective design practices in the context of
a debris cloud encounter. Results from other computer codes and data from the
LDEE IDE experiment are used for results comparison/validation.
Chapter 7 concludes the main body of the thesis by discussing the results of the
work carried out, in particular the novel developments made in breakup modelling
and collision hazard assessment. Recommendations for future areas of
study/follow-on work are also made.
In the Appendix, the equations of relative motion between a piece of debris and
Chapter 2
R e v i e w of Debris Cloud Modelling
Techniques
2.1
B r e a k u p M o d e l l i n g
2.1.1
I n t r o d u c t i o n
On-orbit fragmentation events fall into two main categories, explosions and
hyper-velocity collisions, both of which lead to a number of possible scenarios.
Histori-cally, explosive breakups have been the dominant source of fragmentation debris.
Explosions can be physical (e.g. a pressure burst), chemical (e.g. battery or
pro-pellant related) or even nuclear [50]. Also, a chemical explosion may be high or
low-intensity in nature, depending upon how the explosive 'charge' is coupled to the
spacecraft structure [51]. The most common type of explosive breakup has been the
low-intensity fragmentation of 'dead' rocket bodies, most notably the Delta second
stages in the 1970s and more recently the fourth stages of the Russian Proton launch
vehicle. The cause of both these event families is thought to be the same, namely
hypergolic ignition of residual propellants due to bulkhead failure, probably caused
by thermal (i.e. solar) stressing [52]. The fragmentation of the SPOT-1 Ariane V16
third stage in 1986 was a particularly pollutive event, producing nearly 500
track-able fragments [53]. Overpressurization of the rocket body from residual propellants
is thought to have been the cause of the breakup. Evidence indicates that other
Ariane third stages may have also broken up, the effects being masked by
2. DfCZBfZJf) CIxOl/D jVfODj3I,I,fArG ^T^fCZffTVfCaiLUSjS 20
to-observe low inclination oii)its. In the case of Ariane V16, a hypervelocity collision
cannot be completely ruled out, however. A close conjunction between the Cosmos
1G80 rocket body and the SPOT-1 Ariane third stage occurred at about the time
of the breakup of the Ariaue rocket body. Even accounting for orbit propagation
errors, it was found that a collision between the two rocket bodies could not have
taken place, but there is the possibility that the Ariane stage encountered a piece
of debris that was 'accompanying' the Cosmos rocket [54].
To date, there have been no accidental collision-induced fragmentations officially
recorded, although the Cosmos 1275 breakup is thought to have possibly been caused
by a debris impact [8] and was even briefly classified as such [2], Determining the
cause, location and time of a suspected fragmentation event is generally far from
easy. A number of different methods have been proposed for event classification,
including methods based upon the optical properties (e.g. albedo) of the debris
produced [55], the radar cross-sections (RCS) and area to mass distributions, debris
plane change angles and ejection velocity direction distributions [56], and the SAFE
(Satellite Fragmentation Event) Tests which examine the debris mass distributions
and velocity spreads using weighted 'Gabbard' diagrams [8, 51]. One of the major
difficulties of the task is that the greatest difference between the fragment
distri-butions produced by each type of event lies with the very small particles. These
particles cannot generally be detected, however, and the trackable fragments do not
tend to display a distinctive event-characterising collision or explosion 'signature'.
For this reason, a reliable autonomous classification technique has yet to be
devel-oped. Pinpointing the location and time of a fragmentation event is also fraught
with uncertainties. Errors in orbit determination and propagation mean that even
if a cloud of fragments produced by a breakup can successfully be identified, in
practice they can never be back-propagated to a single point. If the state vectors
of each fragment are simultaneously back dated then the coincidental peaking of
different positional difference functions can be used to establish the time of the
breakup. The pseudo time-independent method of Dasenbrock et al [57] uses the
ci,c)[/D TuroDfci/Uoxrc; TiEJCZPfrvTcziLUsc? 21
of the fragmentation. In practice, this method is complicated by the effects of orbit
perturbations, in particular Earth oblateness effects, and also by the poor definitions
of nodal positions due to the relatively small changes in orbit inclination that are
produced.
2.1.2
T y p e s of B r e a k u p M o d e l
In general, breakup models can be organised into three families - complex,
semi-analytic and empirical. Complex models are based on fundamental physical
princi-ples and include hydrodynamic (hydro) codes and structural response programs [58,
59]. Semi-analytic (or semi-empirical) models are developed from theoretical
ex-pressions but are normally calibrated through the use of experimental data. These
models have a rigorous physics base and can generally be applied to a wide range
of breakup scenarios. Empirical models are primarily derived from the curve fitting
of data from impact/explosion experiments with some incorporation of analytic
ex-pressions. They tend to be based on limited data and are only tenuously based on
fundamental physics. They are normally by far the simplest models to use, however,
requiring only a few input parameters and negligible computation time. For these
reasons, they are the most commonly used for both debris cloud and environment
modelling.
The breakup models used and discussed in the remainder of this section will all
be of the third of the above three types, i.e. empirical. As stated, these are by far the
simplest to use and implement computationally and because of their rapid execution
are the most appropriate for both debris cloud and environment modelling.
2.1.3
F r a g m e n t D i s t r i b u t i o n s
The cloud of debris produced by a breakup event constitutes the initial conditions
(IC) for both short and long-term hazard assessments. The key parameters of the
breakup IC are velocity, mass, number and ballistic coefficient distributions. The
2 (ZyLOC/D AdlCUCIElCJLIfVt? Gr2r(%FfArfq)[/E%S' 22
mass relationship prescribes the 'lethality' of a future impact, i.e. the degree of
damage a fragment is likely to cause. The ballistic coefficient distribution has a
secondary effect on both the cloud's evolution under the influence of atmospheric
drag and the lethality of the fragments [60].
As the physical processes involved in explosions and hypervelocity collisions are
so different, each must be modelled separately regarding the ejection velocities and
numbers of fragments produced. Collision-induced breakups produce enormous
numbers of small debris particles but explosive fragmentations are more effective
at producing and dispersing trackable fragments than hypervelocity collisions with
equivalent breakup (i.e. kinetic) energy [50]. Relating mass and ballistic coefficient
to fragment size can be considered to be a non-event-specific task, however, and so
common models may be used.
In many respects, deriving and indeed using empirical breakup models is still very
much a 'black-art', with models based on scant, and in; some cases inappropriate,
data generally being employed for a much wider range of fragmentation scenarios
than they were originally intended. No universal, consistent set of fragmentation
equations exists, although at least one attempt has been made to bring together
a combination of empirical equations and observational data to produce a unified
breakup model [61]. Whether a single set of simple equations will ever be able to
accurately describe the complete range of potential breakup scenarios is doubtful,
however, but more dedicated experimental data is certainly needed to remove many
of the large uncertainties in current models.
McKnight [60] provides a comprehensive review of the most common and widely
accepted empirical breakup models in current usage. The development histories of
the different fragment distribution equations are outlined, and the appendix
sum-marises the most exercised and validated relationships for each distribution, with
appropriate disclaimers and cautions with regard to their implementation included.
For explosions, an exponential law is adopted to determine the fragment number
distribution,
:2. oj? DjsjguRURs cZvOfjD jvroi)jE%vi,ifV(3 23
where CN is the cumulative number of fragments with a mass greater than Mf (in
grams), Mt is the target mass (also in grams), and T and U are empirical constants
(with nominal, i.e. mean, values of 0.0005 and 0.04 respectively).
For hypervelocity collisions, a power law is used,
CN = . (2.2)
where Mg is the mass of ejecta in grams, and a and b are empirical constants (nominal
values of 1.0 and 0.65 respectively). The ejecta mass, M^, is the mass that would be
excavated from the target in a cratering impact, if the target was very much larger
than the projectile striking it for example. It is defined as
Me = Mpvl , (2.3)
where Mp is the projectile mass (g) and Vc is the magnitude of the relative collision
velocity (km/s). Note that equation (2.3) is dimensionally incorrect. It is an
empir-ically derived relationship which introduces the effect of collision energy variation
into the resultant mass distribution. Without the factor, equation (2.2) would
produce the same fragment distribution for any projectile/target combination,
re-gardless of the kinetic energy of impact.
The collision is deemed to be catastrophic (i.e. the whole of the target structure
fragments as a result of the impact) if Mg exceeds, or is equal to, 10% of the target
mass, Mf. In this case it is assumed that the projectile and 10% of the target mass
(i.e. Mp+O.lMt) fragment as per equation (2.2), and the remaining 90% of the target
breaks up as per a low intensity explosion, the cumulative number distribution of
which is described by equation (2.1).
The mass of a particular fragment can be related to its size by the expression
Tkf/ == jFD* , (2.4)
where D is the fragment's mean diameter in metres and / and g are constants
(nominal values 45000 and 2.26 respectively).
Similarly the ballistic coefficient (BC), in vn?/kg, can be found using
CHAPTER 2. REVIEW OF DEBRIS CLOUD MODELLING TECHNIQUES 24
where BC is defined as
B C == (2X^1
Here Cd is the drag coefficient of the fragment (a common 'default' value is 2.2), X
is its average cross-sectional area (m^) and M/ is this time expressed in kg. The BC
of an object is essentially a measure of its compactness and determines the object's
response to atmospheric drag. An object with a small BC will tend to have a longer
orbital lifetime than one with a large BC.
For a hypervelocity collision, the velocity distribution of fragments produced is
described by
= A - D > , (2.7)
and log{^) = A if D < Dm , (2.8)
Vp
where v (in km/s) is the nominal velocity for a fragment of diameter D metres, Vp is
the projectile velocity (km/s), the threshold d i a m e t e r . i s equal to £'^^76.194 x
10^, where Bp is the kinetic energy of the projectile (in J), and A and B are constants
(nominal value of A is 0.175, B has a fixed value of 0.1022).
For an explosive event, normalisation to a projectile velocity is not possible.
Reynolds [62] provides a standardised velocity distribution which is purely a function
of debris size, D (m),
Zop?; = -0.0676[Zop(D)]^- 0 . 8 0 4 ( o g D - 1 . 5 1 4 . (2.9)
A spread is usually made about whichever of the above nominal velocity curves
is used. This is done to model the fact that all the fragments of a given size will not
have the same velocity. The NASA triangular spreadin