STATISTICAL AND SOCIAL INQUIRY SOCIETY
OF IRELAND.
THE FUTURE POPULATION OF SAORSTAT EIREANN AND SOME OBSERVATIONS ON POPULATION STATISTICS.
By R. C. GEARY.
[Read on Fridaxy, 29th November, 1935.]
While the principal object of this paper is to place on record the results of a couple of experiments in forecasting population, certain extended digressions have been made into the past (sometimes the distant past) not always with a view to extrapolation into the future. If these digressions depart too much from the main theme, it is hoped that they will compensate, in however small a degree, in interest »for what they lack in relevance.
Future Population,
It would be an inestimable advantage if population could be fore-cast even within wide limits of error. These forefore-casts are really implicit in all long-term fixed capital investment, including building of all kinds (universities, schools, factories, shops, as well as private dwelling schemes); investment in industrial and commercial enter-prises; construction of roads and drainage works, etc. For the purpose of public administration these figures would be most useful, for example in connection with the provision to be made for old age and other public pension schemes. The extent to which government would be justified in embarking on long-term investment (perhaps with the intention of relieving present-day distress), or " mortgaging the future " as the saying goes, must depend to a considerable extent on the anticipated size of the population.
Mention of schools and old age pensions brings to mind the necessity of forecasting not only total population but also its break-up into age groups and sexes, which has also an important bearing on the problem of estimating the future earning power of the population as indicated say by the proportion of males between the ages of 15 and 65 and the burden of dependency as indicated by the proportion of population outside of these ages.
statistics and estimates of the numbers of births and immigrants tending to increase population, and of the numbers of deaths and emigrants tending to dimmish it. As each of these figures in any year constitutes only a small proportion of the existing population, forecasts can be made fairly accurately for a short term of years, but the unpredicability increases rapidly as the term advances. The effect on population 50 years hence of what might appear to be small changes in birth and death rates may be considerable. In the past emigration has been the most fluctuating, and therefore the most unpredicable, feature of all It is only because emigration overseas has practically ceased, and for some years to come may be assumed to be negligible, while emigration to Great Britain has not assumed large dimensions, that these computations have any interest
By R. C. Geary. 17
TABLE 1
FUTURE POPULATION OF SAORSTAT EIREANN.
YEAH
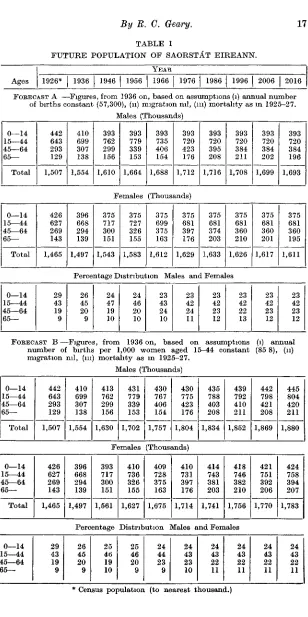
1926* 1936 1946 1956 1966 1976 1986 1996 2006 2016 FOEECAST A —Figures, from 1936 on, based on assumptions (I) annual number
of births constant (57,300), (n) migration ml, (m) mortality as in 1925-27. Males (Thousands)
0—14 15—44 4 5 — 6 4 6 5 —
Total 442 643 293 129 1,507 410 699 307 138 1,554 393 762 299 156 1,610 393 779 339 153 1,664 393 735 406 154 1,688 393 720 423 176 1,712 393 720 395 208 1,716 393 720 384 211 1,708 393 720 384 202 1,699 393 720 384 196 1,693 Females (Thousands) 0—14 15—44 45—64 6 5 —
Total 426 627 269 143 1,465 396 668 294 139 1,497 375 717 300 151 1,543 375 727 326 155 1,583 375 699 375 163 1,612 375 681 397 176 1,629 375 681 374 203 1,633 375 681 360 210 1,626 375 681 360 201 1,617 375 681 360 195 1,611
Percentage Distribution Males and Females 0—14
15—44 45—64
6 5 —
29 43 19 9 26 45 20 9 24 47 19 10 24 46 20 10 23 43 24 10 23 42 24 11 23 42 23 12 23 42 22 13 23 42 23 12 23 42 23 12
FORECAST B —Figures, from 1936 on, based on assumptions (I) annual number of births per 1,000 women aged 15-44 constant (85 8), (n) migration nil, (m) mortality as in 1925-27.
Males (Thousands)
0—14 15—44 4 5 — 6 4 6 5 —
Total 442 643 293 129 1,507 410 699 307 138 1,554 413 762 299 156 1,630 431 779 339 153 1,702 430 767 406 154 1,757 430 775 423 176 1,804 435 788 403 208 1,834 439 792 410 211 1,852 442 798 421 208 1,869 445 804 420 211 1,880 Females (Thousands) 0—14 15—44 45—64 6 5 —
Total 426 627 269 143 1,465 396 668 294 139 1,497 393 717 300 151 1,561 410 736 326 155 1,627 409 728 375 163 1,675 410 731 397 176 1,714 414 743 381 203 1,741 418 746 382 210 1,756 421 751 392 206 1,770 424 758 394 207 1,783 0—14 15—44 4 5 — 6 4 6 5 —
29 43 19 9 Percentage 26 45 20 9 25 46 19 10 Distribution 25 46 20 9 24 44 23 9
Males and Females
24 43 23 10 24 43 22 11 24 43 22 11 24 43 22 11 24 43 22 11
The numbers for the years 1946 and onwards have been based on the estimated figures for 1936, using the Saorstat Life Table (1925-27) survivorship ratios and ignoring migration. In computing the 1936 figures allowance has been made for overseas emigration. The estimates for ages 0-9 were based upon the Registrar-General's statistics of deaths at these ages and births during the years 1926-1934. Sufficiently reliable statistics of migration to the United Kingdom during the whole period since 1926 have not been available to allow for this factor in the computation, so that next year's Census figure may be 20,000 or 30,000 less than that shown in the table.
For obvious reasons it will be noted that m Table 1A after a certain stage the numbers of persons in each age group are identical; similarly, that the corresponding numbers in Tables 1A and IB are the same at the later ages for a number of '' Census years,'' because, of course, these numbers are unaffected by the hypotheses as to the number of births For this reason, as well as for the fact that they are unlikely to be much affected by migration, the estimates for the later ages are to be regarded as more reliable than those for the younger ages.
The trends in population resulting from each set of assumptions are shown in the diagram. It will be seen that by Forecast A the population will increase from 2,972,000, m 1926, to a maximum of 3,349,000 in the year 1986, after which it will gradually recede to 3,304,000, m 2016. According to Forecast B the population will increase steeply at first and then more gradually to reach 3,663,000, in 2016. At the present time this country is different from almost all European countries in having a male excess in the population; both forecasts show that this will continue during the next 80 years.
Pop (mJ)
s
SAORSTA7
POPULATION
AND BMTHS 82! - 20/6
Ll^?!ir!2^
number or 6/rt/t£ = SJt 3co
' -J I ! i i I I f I 1 L
B,rths
per JOOQ
<0O
B
A
By R. C. Geary. 19 much the same. The trends in the births per 1,000 women aged 15-44, actual from 1871 to 1926, and as resulting from the different assumptions from 1936 on, are also illustrated on the diagram.
Births.
The crude birth rate is now about 19 per 1,000 of the total population, as compared with 28 in the seventies and perhaps 321
in the forties of the last century. That there has been such a decline has been commonly lost sight of, possibly because it has been much less evident here than in other countries during the last 20 years. In Table 2 the trend since 1871 is analysed to show the effect of (i) the proportion of women at the child-bearing ages, say 15-44, in the population, (ii) the proportion of married women at these ages, (iii) the ages of married women, and (iv) natural fertility.
TABLE 2.
BIRTHS, 1870-72 TO 1932-34
1. Birth rate
2. Births per 1,000 women aged 15-44
3. Fertility (births per 1,000 married women aged 15— 44)
4. Standardising ratio (1925— 27 = 1)
5. Standardised fertility (i.e., 3 divided by 4)
1870-1872
27 6
129
312 1 106
282
1880-1882
24 1
109
289 1-050
2 7 5
Annual Average
1890-1892
21 9
99
293 1029
285 1900-1902
22 0
95
298 1035
288
1910-1912
22 8
104
312 0-997
313 1925-1927
20 6
97
279 1 279
1932-1934
19 1
87
(a) (a)
(a)
NOTES—Figures at 4 represent proportionately (1925-27 = 1) number of births per married woman if fertility rates at each age of married women were constant throughout (equal to Swedish 1896-1905 rates). Figures at 5 represent quotient of 3 and 4. (a) Not available.
Between 1871 and 1926, both the crude birth rate and the number of births per 1,000 women aged 15-44 declined by about 25 per cent., showing that the decline in the former was in no wise due to any alteration in the aggregate number of women aged 15-44 in the population. The decline in the births per 1,000 "married women aged 15-44 was only 11 per cent, so that the principal cause of the decline in the birth rate was the smaller proportion of married women at the child-bearing ages It is evident that the figures at 4 are a measure of the increasing age of married women through-out the period, and that the figures at 5 represent what the fertility would have been had the age distribution of married women aged 15-44 been the same as in 1926. These figures may accordingly be regarded as indicating the trend in " natural fertility." It is remarkable that there was a pronounced increase in this figure from 275, in the years 1880-82, to 313 in 1910-12, all the more so when we bear
1 R. R. Kuczmski m The Balance of Births and Deaths (p. 80) suggests 30.
20
in mmd the increased degree of urbanisation during; the 30 years. It was partly due, no doubt, to the selective effect of the increased age at marriage of females and perhaps to some slight extent to improvement in registration. Between 1911 and 1926 there was a marked decline in natural fertility (as denned) which has probably continued to the present year. In 1926, however, the figure was still at about the 1870-72 level.
In this connection reference may perhaps be made to the fertility inquiry which was one of the many novel features in the remark-able Census of 1841, which is the chief glory of Irish statistics. This must have been one of the earliest of these inquiries made anywhere, if it was not actually the first The curious thing about it is that it appears to have been undertaken principally with the object of finding if the different ages at marriage of husbands and wives, and the durations of marriage, had any bearing on the male-female birth ratio. With some adjustment a comparison can be made between the results of the 1841 and 1911 inquiries for durations of marriage under ten years :—
Duration
of
Marriage
i n
Years 1— 2 2— 3 3— 4 4— 5 5—10
CHILDREN ]
1841 H : Under 26 W : ,, „
66 106 153 191 292
P E R
H:
w-.TABLE 3
100 MARRIAGES, 1841 AND 1911, ALL
Census and Age at Marriage 1911
Under 25 „ ,, 59 105 155 196 313
H
W
1841 26-35 : Under 26
68 110 152 192 300
H
W
1911 25-34 Under 25
58 104 155 196 314
IRELAND.
1841 H 26-35 W: „
70 110 146 176 270
1911 H 25-34 W : „
52 95 141 183 289
NOTES —H : Husband ; W . Wife The 1841 figures refer to marriages in which neither husband nor wife wai married before , the 1911 figures to all marriages m which husband and wife were returned on the same family form The 1841 figures are simple averages of the rates for durations ^ - 1 ^ years and l£-2£ years , etc. The 1911 figures are the actual figures for durations 1-2 years, 2-3 years, etc
•
Having regard to the somewhat different ages at marriage in the two years, the figures for durations 5-10 years indicate a small but real increase in the natural fertility in the 70 years. For durations under three years the fertility seems to have been appreciably greater in 1841 Compared with other countries, however, the most remark-able fact is the constancy of the rates over so extended a period during which so many changes, both economic and social, took place.
By R. G. Geary. 21
TABLE 4.
(A) MARBIED WOMEN UNDER 45 YEARS PER 1,000 or POPULATION AND (B) CHILDREN UNDER 5 YEARS PER 100 MARRIED WOMEN UNDER 45 YEARS.
Country Saorstat Eireann Sweden
Northern Ireland Finland
Norway Switzerland Scotland Portugal Esthonia . . Netherlands Denmark
Simple Average 11 Countries
A
74 91 91 92 94 104 105 106 108 109 112
99 B
131 103 111 114 118 81 92 95 74 104 93
101
Country Czechoslovakia Italy
Australia
England and Wales Belgium
New Zealand . Canada Germany
Union of South Africa Hungary
USA.
Simple Average 11 Countries
A
119 119 121 121 122 123 125 125 127 139 142
126 B
64 78 91 71 57 82 96 75 97 60 77
77
NOTES.—Most of the figures extracted from tables on pp. 82 and 83, General Report, Census of Population, 1926 The figures for all countries refer to 1920 or 1921, except those for Germany (1925), Saorstat Eireann, Northern Ireland, New Zealand, Finland (1926) and England and Wales (1927).
The countries are arranged in ascending order according to the magnitude of " A . " It will be observed that the average fertility (represented by children aged 0-4 at the censuses per 100 married women at child-bearing ages) in the 11 countries with the lowest proportions of married women was 101, compared with 77 in the remaining countries; furthermore, that the 11 countries with the lowest "A" include 9 countries with highest " B ".* The relationship is perfectly evident. Its significance is not diminished by the fact which will presently be made clear that it has its origin in the no less remarkable circumstance that there appears to be no relationship between the marriage rate and the birth rate. For if we have many pairs of numbers a (marriage rate) and c (birth rate) and if a and o are independent there will evidently be an inverse relationship between a and b = c/a (fertility rate).
The statistics in the preceding table suffer from the defects that they relate for the greater part to the years 1920 and 1921 when the age distributions of the populations of many countries were still abnormal as a result of the European War and also because legitimate are not distinguished from illegitimate children at the Census enumerations. In the following table the marriage rates, legitimate birth rates and " fertility rates " in 28 countries, m 1931-33, are compared. The concept of " fertility rate yj in this table is not a
completely sound one. The numbers of legitimate births should be classified according to ages of mothers Unfortunately these statistics are compiled only for a very few countries and for the present the somewhat over-simplified analysis must suffice.
1 Note also that the 4 countries with highest " B " amongst the 11 countries
TABLE 5.
MARRIAGE RATES, LEGITIMATE BIRTH RATES, PER 1,000 POPULATION PER ANNUM, AND BIRTHS PER MARRIAGE, 1931-33.
Country
Saorstafc Eireann Nth Ireland . Iceland . Norway Australia Greece Italy . Canada . Finland Scotland Austria Sweden New Zealand Portugal
Simple Average 14 Countries Marri-age Rate 4-5 5 8 6 2 6-2 6 6 6 7 6 7 6 7 6 8 6 8 6 9 6 9 6 9 7 0 6*5 Leg Birth Eate 18 5 18 9 19 9 14 7 16 4 29 0 22 9 20-1 18 1 17 1 10 8 12 1 16 5 27 0 18'7 Births per Marri-age 4-1 3 3 3-2 2-4 2 5 4-3 3'4 3 0 2 7 2 5 1-6 1 7 2 4 3 9 2*9 Country Netherlands France Esthonia England and Wales Luxembourg Switzerland Belgium Lithuania Latvia Denmark Hungary Czechoslovakia Union of South Africa Bulgaria
Simple Average 14 Countries Marri-age Eate 7-2 7-5 7*7 7 8 7 8 7 8 7-9 7 9 8 2 8 3 8 4 8 6 8 6 9 5 8-1 Leg Birth Eate 21-3 15 6 15-3 14 5 17 0 15 9 16 9 24 5 17 1 15 9 20 9 18 3 23 8 21 3 19 0 Births per Marri-age 3-0 2 1 2 0 1-9 2 2 2 0 2-1 3-1 2 1 1-9 2 5 2 1 2 7 3-1 2 3
The countries are arranged in ascending order according to marriage rate. Again the inverse relationship between marriage rate and " fertility rate " (as defined for this table) is evident from the simple averages for the respective groups of countries; also, that while the simple average marriage rates differ considerably, as they must, from the manner in which the table has been drawn up, the average birth rates are practically the same. The coefficients of correlation are as follows:—
Between marriage rate and birth rate ... + *19 Between marriage rate and " fertility rate" - -44
For 28 'c units " the first is not significant and the second very
pro-bably is. (The odds against the phenomena being unrelated are about 50 to 1).
By R. C. Geary. 23
but the manner in which the economic check operates is not under-stood. It seems likely that, as population is an aggregate of individuals all of whom are attempting to achieve as high a standard of comfort for themselves and their families as circumstances permit, population, however blindly, must be adjusting itself as to numbers so as to attain the highest average satisfaction. Still, in the light of a statement by two medical experts in a recent issue of the Quarterly Bulletin of the League of Nations Health Organisation,1 in which it is stated that the amount of food which the world at present produces is enormously less than the amount required adequately to nourish its peoples, we cannot complacently rule out Malthus's theory in its entirety, although we are equally far from assessing it at his own valuation that " the exuberant strength of the argu-ment permits of almost any concession "
The Saorstat counties bear out the conclusion already obtained that the higher the proportion of married women at the child-bearing ages the lower the fertility rates. In fact, at the 1926 Census, the 13 counties with the lowest proportion of married women under 45 years were precisely the 13 counties with the highest ratio of children 0-4 years per married woman. Using the notation of Table 4 above, the simple average of UB " for the 13 counties with lowest " A '" is 143 compared with 130 for the 13 counties with highest " A ", the respective simple averages of " A " being 65 and 76.
Subject to this inverse relationship between fertility rate and marriage rate, or the lack of relationship between marriage rate and birth rate, being confirmed by more elaborate and detailed analyses, we may observe that it is easier to understand how the high fertility rate acts as a deterrent to marriage than the reason why the low marriage rate is a cause of the high fertility rate. At the same time amongst certain classes or at certain periods it may w^ell be that there has been a reluctance to assume the married state with its concomitant of parenthood. In this country the fact of the low marriage rate associated with the high fertility rate seems to con-stitute a good reason for an examination m all its aspects of the institution of a Family Allowance system I venture to suggest it as an appropriate subject for a paper for this Society, which is justifiably proud of its tradition of preparing the way for legislation.
Emigration.
What is the future of emigration? That will depend on (1) the individual attitude and national policy in this mother country and (2) the policy of other countries towards Saorstat immigration, of which no doubt the United States and Great Britain will remain the most important.
With regard to the Irish attitude towards emigration in the future there is one aspect of the matter of such importance that no apology seems necessary for dealing with it at some length here. It is that all the evidence, both statistical and other, supports the thesis that over most of the period since the famine, emigration has been due more to attraction from abroad than repulsion from within this country:—
(1) That the percentage decline in rural population has been much the same in all Saorstat counties since 1841, while the percentage
increases in cattle and declines m tillage areas have differed widely, is sufficient evidence that there has been little relationship between the decline m rural population on the one hand and the increase in cattle and the decline in tillage on the other. This has been proved using the (former) Poor Law Union as a statistical unit for rural population and tillage in the three intervals 1851-1881, 1881-1911 and 1911-1926.1 It may be of interest to place on record the results of
the corresponding analysis for rural population and cattle for the interval 1881-1911 :—
TABLE 6
INCBEASE IN CATTLE AND DECREASE IN RURAL POPULATION, SAORSTAT EIREANN 1881-1911.
Poor Law Unions in which Increase in Cattle from 1881-1911 was .
0/ /o
0—15 15—20 20—25 25—30 30 and over
Increase in Cattle 1881-1911
0/ /o
8 7 17 5 22 9 27 7 37 7
Decrease in Rural Population 1881-1911
0/ /o
23 4 24 4 27 2 26 7 27 6
Although during the period 1881 to 1911 cattle increased by 21 per cent., while rural population declined by 25 per cent., the phenomena have but little connection—the decline in population was but little greater in the group of Poor Law Unions in which the cattle herds increased by 38 per cent, as in the group m which the increase averaged only 9 per cent.
(2) At the present time there is no marked relationship between density of rural population (per acre of crops and pasture) on the one hand and density of cattle and tillage on the other.
(3) Fluctuations m immigration from Ireland into the United States seem to have depended more on economic conditions m the United States than in Ireland Year to year changes in the number of immigrants from Germany and Ireland corresponded in direction (up or down) m 42 cases out of a possible 50 from I860' to 1910.
(4) In the quota years of emigration to the United States, when the Saorstat was so generously treated, it is understood that 95 per cent, of emigrants' fares were paid by relatives in the United States. This is " attraction " with a vengeance. It is an indication of the strength of family ties across the Atlantic.
(5) Quite apart from statistics, the attitude of the people in the emigration districts is well known. As one writer strikingly put it, " Connemara children are born with their faces towards the West.7'
How much emigration was part and parcel of the lives of the people may perhaps be most graphically described in the fact that out of every 100 young people aged 15-19 in 1911 in Connacht, 53 had migrated from the province by 1926, and of these the great majority left the country. This is also a measure of the social disturbance occasioned by the cessation of overseas emigration.
• (6) It will presently be seen that during the past 100 years the rise in money wages of the labouring classes has been far greater
By B. C. Geary. 25 here than m England, great as the increase has been in that country. There is no evidence of persistent pressure of population in this fact. (7) Overseas emigration from all Ireland was actually greater during the years 1850-54 (average 207,000 per annum), when the crop yields were the highest on record, than m 1846-49 (average 182,000 per annum).
There is nothing m the statistics inconsistent with the view that the great exodus of 1847-54, in placing vast Irish population across the Atlantic and the Irish Sea which created a powerful magnetic field m which millions of Irish were irresistibly drawn from their native country during subsequent decades, was the fount and origin of Irish emigration and depopulation
The bearing of these observations on the present problem is clear. It is by no means too soon to consider what Saorstat repercussions to a change m the United States immigration policy would be. I have been informed by a most competent observer that m the Connemara area the whole outlook on emigration has been altered partly by the pessimistic letters with ever decreasing remittances from the United States and partly by the Unemployment Assistance Act, whereby large numbers of small farmers7 relatives, the great
class from which emigrants were drawn in the past, came into benefit. Now, to city wage-earners the amounts received may seem small— possibly the average for males over 18 in this agricultural class does not exceed 5/- per week It should be borne in mind, however, that such amounts received are for expenditure over and above a standard of living which, if low, at least includes food At any rate, this observer informed me that, notwithstanding the acute agricultural depression, there is little evidence of restlessness amongst young people who would otherwise have emigrated, for which the contrast of their favourable condition with that of their friends and relatives m the United States during the last few years is no doubt a strong contributory cause.
At the same time one may well question whether an inclination which is " bred in the bone " can be eradicated in so short a time. It is my opinion that industrial development, and economic develop-ment generally with fair wages offering, will not of itself suffice to hold these people in this country The longer the restrictions last, however, the more the force of attraction is likely to diminish.
The intensification of the industrial drive in this country in the last few years has been favoured by the immigration policy of the United States, in making available to industry here a more than adequate supply of labour. If United States consular visas are issued freely in future, and if no impediments to emigration are made on this side, something like a scarcity of labour may result, with a con-sequent increase in wages.
a marked cleavage of opinion in the United States about immigration, employers desirous of a plentiful labour supply favour immigration while labour organisations oppose it as tending to depress wages.
The Scripps Foundation1 forecast that (even allowing for an annual
immigration of 200,000) ^the population will reach a maximum of only 145,000,000, about 1970, and will then slowly decline. Dr. Louis I. Dublin,2 on the assumption of an ultimate mortality rate
based on an expectation of life at birth of 70 and an ultimate birth rate of 14 per 1,000, prognosticates a maximum population of 154,000,000, between 1980 and 1990, and a gradual decline thereafter. As he regards the assumption of an ultimate birth rate of 14 as too high he makes an alternative computation, on the basis of 10 per 1,000, which indicates a maximum population of 148,000,000, in 1970, and thereafter a marked decline to 76,000,000 in 2100. Dr. Dublin adds that " my extreme prediction for 2100 may be conservative after all."
Now, in making these prognostications, American statisticians are performing the useful function in indicating as succinctly as may be the ultimate effect of present-day trends, but one cannot but feel that these gloomy anticipations will not be realised. A maximum popula-tion of 150,000,000 would give the United States, with all its natural riches, a density of population of 50 per square mile, or less than half that of An Saorstat at present. For reasons of prestige, and because so much capital investment has been based on the assumption of a future population of over 200,000,000, it seems unlikely that any United States government will allow population to be stabilised at so low a figure. When the upward trend m the economic cycle is well under way a marked change in policy may take place. It may be assumed that, once the principle of immigration is conceded, Irish immigrants will be welcome, perhaps more welcome than any other immigrant stock. The very favourable quotas accorded to An Saorstat m the years 1924-1930, which made this country the envy of the world, will be borne in mind in this connection.
Under the conditions which may be expected to obtain in future, a reconsideration of the historic Irish attitude towards emigration may be necessary. The sundering of families will be a less serious con-sideration in the future than it was in the past if wages or ocean transport charges permit of reasonably frequent visits to the Mother-land. Apart from the sentimental aspect there is the practical one that the more closely these ties are maintained the greater remittances and tourist expenditure will be. Only lately has the magnitude of these remittances been realised and the part which they played in redressing the Saorstat visible balance of payments Remittances have been estimated at £4 000,000, in 1932 (i e., at the depth of the depression m the United States), it is not too much to surmise that in the previous frve years they may have averaged £5,000,000 per annum.
It may be taken as axiomatic that no Saorstat Government will allow emigration to assume dimensions which will lead to a permanent lowering of the present population. Next to the French-Canadians the Irish are possibly the most naturally fertile white race, and under the stimuli of an increased home and foreign demand for population
1 P K Whelpton, " The Future Growth of the Population of the United States,"
Problems of Population, p 80.
By B. C. Geary. 27 the marriage rate may be increased and the age at marriage con-siderably reduced to give a higher birth rate, and mortality rates will certainly be lowered in the future, so that some .emigration may not be inconsistent with an increasing population. The late Professor C. H. Oldham often remarked that Ireland m the last century was not so remarkable for a high emigration rate as for a low birth rate; m the 1880s it was the lowest in Europe.
There is an important aspect of this matter which will certainly not be overlooked if and when overseas emigration again becomes a live question. There is plenty of evidence that at the beginning of the present century the social condition of the Irish in the United States left very much to be desired. In 1900 (the latest year for which the statistics were compiled) 15 per cent of occupied males of Irish parentage were " labourers (not specified)" (probably the least desirable occupational group) a percentage which was exceeded only by Austrians, Hungarians and Poles, which nationalities arrived in much later streams of migration than the Irish and consequently • might be expected to be lower in the social scale. No less than 31 per cent, of occupied females of Irish parentage were " servants and waitresses." In 1910, the standardised general mortality rates of Irish born, both males and females, 10 years of age and over, residing m Pennsylvania and New York States were almost twice as high as for United States native-born of native parentage and far higher than for five other leading race stocks. The mortality from phthisis was more than three times as great amongst the Irish born as amongst the United States native-born of native parentage.1 There were also
too many Irish amongst the mentally diseased2 and amongst the
prison populations (although, significantly, very few for grave offences).3 I t should be emphasised that these facts and figures relate
to a quarter of a century ago since when the position of the Irish has probably improved. But has the relative position changed? These aspects of emigration overseas were naturally not stressed by emigration agents. It will be borne in mind that the classes from which emigrants are mainly drawn are amongst the healthiest in the country. In contrasting wages (even the " real " wages) in Ireland and New York, how many prospective emigrants set a cash value on the ten years of life (at a conservative estimate) which they sacrificed?
Emigration to the United Kingdom.
A table given on page 20 of the General Report of the 1926 Census shows that, during the last 100 years, emigration to Great Britain must have been nearly half as great as emigration to the United States. The almost insuperable difficulty of collecting current statistics with regard to this stream of migration has somewhat obscured its significance. Notwithstanding the virtual cessation of emigration overseas since 1931, migration to Great Britain has not assumed formidable dimensions. From the statistics of passenger movement by sea published in the Statistical Abstract, 1934, and the
1 Louis J. Dublin and Gladden W Baker, " The Mortality of Race Stocks."
Journal of the American Statistical Association, March, 1920
2 Rollm H. Burr, " A Statistical Study of Patients Admitted at the Connecticut
Hospital for Insane from the Year 1868 to 1901, " ibid June, 1903.
3 John Koren, " Some Facts About the Prison Population mthe United States,'
Board of Trade Journal, I estimate that net emigration to Great Britain averaged about 4,000 per annum during the four years 1931-1934, compared with about 6,000 per annum during the inter-censal decade 1901-1911
The Board of Trade Journal1 points out that there has been an increase in migration to Great Britain during 1934, compared with the five years immediately preceding This is probably due to the economic recovery in Great Britain; for although the increase in the numbers employed in non-agricultural occupations has been relatively greater in the Saorstat than in the United Kingdom between 1925 or 1926 and 1934—30 per cent here2 compared with
5 per cent, there3—in assessing the force of attraction it is the absolute figure that counts. No doubt many thousands will continue to migrate annually to Great Britain, which as Professor Bowley* has shown is, like the United States, faced in the near future with the prospect of a declining native population if present-day trends continue.
Death Rate and Expectation of Life.
For the construction of Table 1 it has been assumed that from 1936 on the mortality experience will be the same as in 1925-27. This is an assumption which is fortunately not likely to be realised; there is every reason for believing that the death rates will continue to decline and expectation of life to improve.
TABLE 7.
EXPECTATION OF LIFE IN YEARS.
Males : 1910-12 1925-27 1933 Females :
1910-12 1925-27 1933
A G E
0
53-6 57-4 59-3 54-1 57-9 59-4
15 49-2 50-7 51-1 49-4 50-5 51-3
4 5
25-9 26-5 26-2 26-4 27-0 26-8
65
13-0 12-8 12-6 13-4 13-4 13-1 NOTE.—The figures for 1910-12 and 1933 have been calculated by Brownlee's abridged method (" The Use of Death Rates as a measure of Hygienic Conditions," Medical Research Council, London).
It will be seen that the expectation of life at birth has increased by 1.9 years for males and 1.5 years for females during the seven years 1926-1933, so that the improvement since 1910-12 has been well maintained. Most of this increase has been due to the decline in infantile mortality; the expectation at later ages having slightly
1 March 7, 1935, p. 366.
2 The Trend of Employment and Unemployment in the Saorst&t, p . 28. 3 Based on figures published m The Ministry of Labour Gazette, January, 1935,
p. 2.
By R. C. Geary. 29
declined I have shown elsewhere1 that the wiping-out of tuberculosis would add a further four years to the expectation oi life. There is little doubt that a figure of 70 may be achieved during the next half century. There would be little difficulty about adjust-ing Table 1 in accordance with reasonable hypothesis as to improve-ment m health. As against this, however, there is the fact that the future of migration is quite unpredictable.
The Standard of Living.
Mr. James Meenan, in a paper2 read before this Society a few years ago, tentatively advanced the interesting theory that the increase in the age at marriage m this country has been due partly to the desire of people to achieve a suitable standard of living and that their ideas of what constitutes a suitable standard are based largely upon those of England and the United States, where that standard is particularly high. Does this theory explain the depopulation of Ireland since the famine? In so far as the fall m the birth rate has been due entirely to the fall in the marriage rate and the increase in the age at marriage, if Mr. Meenan's theory is true in regard to the marriage rate it is also a cause of depopulation. To say that emigration has been due to attraction from abroad is to say that the emigrants left this country to improve their standard of living and, as the wealth of the country has been derived for the greater part from the soil principally through the bounty of nature and only to a lesser degree to the application of labour, more wealth remained for those who stayed at home. The following table gives some idea of the enormous increase in the wealth pert head in rural Ireland since before the famine and at intervals since then.
(This table must suffice instead of " output " which it would be impossible to estimate for the remote past)
TABLE 8.
VALUATION OF STOCK AT 1926 PEICES AND PRODUCTION OF CROPS AND PASTURE (IN STARCH TONS), TOTAIS AND PER HEAD OF RURAL POPULATION.
Year
(1)
1841 1861 1881 1911 1926
Rural
Popula-tion
(2)
000
5,437 3,424 2,946 2,207 2,028
Yield
Corn and Green Crops and Hay
(3)
of Crops Pasture
Pasture
(4)
million starch
(a)
1-9 1 9 2-3 2-4
(a) 0 9 1 1 1-4 1-3
and
Total
(5)
tons
(a) 2-8 3 0 3-7 3-7
"\7*alno •fiirvn V dlucluiUi.1 of Stock
at 1926 Prices
(6)
£million
37 7 61-1 63 1 74 9 71-9
Per Head of Rural Population
Crops and Pasture (Starch)
(7)
tons
(a) 0 8 1-0 1-7 1-8
Valuation of Stock
(1926) Prices
(8)
£
6-9 17 8 21-4 33-9 35-5
NOTES.—Column (2) : Population outside towns of 1,500 population or over. Yield of crops : quinquennial average central to years in column (1). Column (4) : yield of pasture based upon acreage under grass assuming (at a guess) that yield of grass was one-fourth of yield of crops (including hay). Column (6) : valuation makes no allowance for improvement in quality of livestock.
(a) Not available.
The " estimate " in column (4) is based on a conjectural yield of grass-lands at one-fourth of the yield of crops. The correct pro-portion may be one-third or one-fifth; it is put up ( to be shot at) principally because the fact that grass-lands have any yield at all has too frequently been ignored in economic controversy in this country. The figures in column (5) show that the soil of An Saorstat is probably producing more food for man and beast at the present time than ever before. Our present interest lies principally, however, in columns (7) and (8) which give some idea of the increase in the average wealth and income in rural Saorstat. The figures in the last column are most conservative, because they ignore the marked increase in the quality of live stock. But what is of still greater importance is the fact that the increase m the standard of living m this country during the last century was greater than in England. The national income in An Saorstat, in 1926, was about £170 million (1926)1 compared with about £3,975 million in the United Kingdom
(1924)2 so that the average, per head of the population, was about
65 per cent of the United Kingdom average, a proportion which is confirmed by the figures of material output.3 One might safely
assume that in the 1840s the ratio was not 50 per cent. The International Labour Office4 calculated that in July, 1930, the
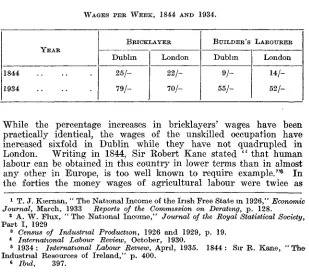
[image:16.395.47.356.313.592.2]average level of real wages was 93 for An Saorstat (three towns) with Great Britain 100 (seven towns). I t is of much interest to compare the money wages in Dublin and London for a typical skilled and unskilled occupation over a space of 90 yearss
TABLE 9.
WAGES PEB W E E K , 1844 AND 1934.
YEAR
1844 1934
BRICKLAYER
Dublin 25/-
79/-London 22/-
70/-BUILDER'S LABOURER
Dublin 9 / -
55/-London 14/-
52/-While the percentage increases in bricklayers' wages have been practically identical, the wages of the unskilled occupation have increased sixfold in Dublin while they have not quadrupled in London. Writing in 1844, Sir Robert Kane stated " that human labour can be obtained in this country in lower terms than in almost any other in Europe, is too well known to require example."6 In
the forties the money wages of agricultural labour were twice as
1 T. J. Kiernan, " The National Income of the Irish Free State m 1926," Economic
Journal, March, 1933 Reports of the Commission on Derating, p. 128.
2 A. W. Flux, " The National Income," Journal of the Royal Statistical Society, Part I, 1929
3 Census of Industrial Production, 1926 and 1929, p. 19.
4 International Labour Review, October, 1930.
5 1934 : International Labour Review, April, 1935. 1844 : Sir R. Kane, " The-Industrial Resources of Ireland," p. 400.
3y Li. C. Geary. 31 high in England as here; m recent years the ratio has been about three to two. There can be little doubt that during the la&t century the average standard of living m this country increased fiom being one of the lowest to one of the highest m Europe.
To consider whether the standard of living is too high in this country, having given the natural wealth of the country and the talent of its people, raises many problems of a non-statistical nature and I do not propose attempting to deal with them.
It seems quite likely that the demographic changes have been due principally to the relatively high level of wages and the increase in the last 100 years in wages in the English-speaking countries, with the great catastrophe of 1846-47 as the basic cause in making migration part of the ordinary life of nearly every family in Ireland, and thus making Irish labour the most mobile in the world and the most free to pursue its best market.
The Population of 1841.
That according to present indications the population of An Saorstat is not likely to exceed 4 millions may come as a surprise to people for whom the 1841 population of 6J millions represents, for understand-able reasons, the goal to be aimed at. Even with Mr Hilaire Belloc's warning m mind that we should be on our guard against jadging the past by the criteria of our own age, there can be little doubt that Ireland was overcrowded in the forties. This opinion is based largely on the standard work on this period, Professor O'Brien's " Economic History of Ireland from the Union to the Famine," although it is right to add that the author is himself content to state the case for and against. With most of her industries destroyed, in Ireland the pressure of population was on the land, and the increase was accord-ingly of an entirely different character from the increase in the popu-lation of England, which was accompanied by increased imports of foodstuffs1.
Sir Josiah Stamp2 has drawn attention to the remarkable fact that
the Famine had little effect on the statistics of consumption of spirits, beer, tobacco, tea and coffee, because " the class of people concerned were so wretchedly poor that their whole sustenance was drawn from the land and their actual disappearance hardly affected the business and commercial activity which is reached by Schedule D (Income Tax)... The diminution of population of this hopelessly indigent class, with practically no spending power whatever, leaves little trace in this respect." Stamp3 also gives estimated figures showing that
Schedule D assessments (profits on businesses, professions, etc.) increased between 1842 and 1865 from about £3.4 millions to £6.5 millions in Ireland compared with £65.8 millions to £143.1 millions in Great Britain. Expressed as per head of the respective populations in the two years, the increase in Ireland was much greater than in
1 In both Ireland and England the percentage increases between about 1750
and 1845 appear to have been of the same order of magnitude ; the population probably more than doubled. The " Hearth-money " and other estimates of Irish population for years prior to 1788, given in the 1821 Census Report, seem much too low. When Malthus stated that the population of Ireland increased more than any other European country in the interval 1695-1821, he was probably misled by these faulty estimates.
England—180% compared with 66%. This has a bearing on-the analysis developed in the preceding section.
Conclusion and Retrospect.
The scattered threads of fact and argument may now be drawn together. With certain simple assumptions as regards future births and deaths and with migration nil it would appear that the population of An Saorstat is unlikely to exceed 3,700,000 during the next 80 years. The artificial nature of these assumptions became evident when trends in births, deaths and emigration have been analysed, but it should be emphasised that the errors may be compensatory. As the diagram shows, the birth trend indicated by Forecast A seems most akely during the next decade. It is tentatively suggested that there is but little relationship between marriage rates and birth rates, or, what comes to the same thing, there may be an inverse relationship between marriage rates and fertility rates These relationships seem to subsist whether different countries or the different counties of An Saorstat are regarded as statistical units, which would go to show •from yet another angle that the economic organisation of each com-munity requires a certain more or less predetermined number of births each year; that in the aggregate births are less forfuitous than is commonly supposed. With regard to emigration, as the available statistics appear to indicate that for most of the period since the famine emigration was more of a " pull " than a " push," a resump-tion of overseas emigraresump-tion is not unlikely if the existing restricresump-tions are removed and if prospects of obtaining work improve in the United States. At the same time it is recognised that the longer the period of the restrictions the more the attraction will diminish. There has been a marked increase in the expectation of life between 1926 and 1933, which continues during the present and last year, and further diminution in the death rates may furnish a surplus for emigration under better conditions in the future than in the past and even with an increase in the existing population. The theory was examined that most of the demographic changes in the last 100 years were due principally to an immense effort to improve the standard of living; and figures are given which indicate that in this country the increase has been proportionately greater than in England
May I emphasise that, while the available statistics support them, certain of the explanations here advanced of the principal demo-graphic changes in Ireland during the last century are still to be regarded as " working hypotheses." Demographic statistics are usually measures of the effects in the aggregate of single events, no two of which are exactly alike, and in these circumstances we are fortunate if we can segregate a. single major " cause," and we recog-nise that this by no means precludes the possibility of other causes acting concurrently. I have been less concerned to propound theories than to place before the Society the results of certain computations; with the necessary qualifications, it is hoped that these at least will be accepted.
33
DISCUSSION.
Mr. Meenan said it gave him much pleasure to propose a vote of thanks to Mr. Geary for his invaluable paper. The portion of the paper dealing with an estimation of the population of this country m the next eighty years was especially interesting m a country like this, which had come to the end of an economic cycle During the last century the population of Ireland had diminished through emigration, but m the last few years emigra-tion had ceased, and populaemigra-tion was now governed by the ordinary forces which determined its trend m any country—marriage rate, birth rate and death rate. There was a very widespread idea that, emigration having ceased, Ireland would, m course of time, have a population resembling that of the Famine years, and arguments were based on whether this population would reach 16 millions or 12 millions Mr Geary's paper gave a salutary check to these speculations, since he showed that population would remain at very much the same level throughout the rest of the present century.
The marriage rate in Ireland was more dependent on causes peculiar to this country—the system of land tenure, family ties, etc , than to emigration He was glad that Mr. Geary had killed the idea—often killed before, but enjoying resurrection—that the population of this country had varied inversely with the amount of tillage. He hoped other speakers would deal with the social effects of the rate of growth of the population ; it was going to affect the industrial policies of the country if it were equipped for an increasing market, and the market remained very much as it was to-day. This would throw the economic system out of joint. It would also affect the stratification of society, since the increase of an industrial population in the cities would mean fewer people m the countryside.
Professor Duncan, seconding the vote of thanks, drew attention to two further considerations that might affect the future movement of population. First, marriage and birth rates m urban areas in the I F S. are higher than m the rural districts. Of the eleven counties with the highest urban propor-tions (with populapropor-tions living in "towns and villages" exceeding 30%? or living m "towns with populations of 1,000 or m o r e " exceeding 24%, of the total), 10 are contained in the group of eleven counties with the highest marriage rates (4 8 or over) and seven m the group of eleven counties with highest birth rates (20 3 or over). The highest marriage-rates are m Dublin, Limerick, Cork and Louth ; and the highest birth-rates in Dublin, Limerick, Louth and Waterford. Secondly, marriage and birth rates are higher in those counties where large holdings preponderate. Excluding Dublin, Waterford, Louth and Cork (on account of the distortion introduced by their large urban percentages, exceeding 44 5 and 37 0 on the variant bases used above), and omitting from consideration holdings not exceeding £4 P.L.V. (on the ground that they rarely form the sole support of a family), there are nine counties where the holdings not exceeding £24 P.L.V. constitute less than one-half of the total number of holdings ; seven of these are among the group of nine counties having the highest marriage-rates and seven in the group of nine highest birth-rates (4 6 and 20 2 or more, respectively). Any change m the distribution of the population in these two respects is likely to affect the rates of natural increase of the whole population that may be expected m the future.
certain more or less predetermined number of births each year ; that m the aggregate births are less fortuitous than is commonly supposed " He was not sufficiently equipped philosophically to make a comment on this, but felt that he could not agree with a mechanistic conception of society, which imposed consequences on the individual, and implied that he had no choice.
With regard to the relationship between the marriage rate and the fertility rate, Mr. Geary's tables given on pages 21 and 22 did not prove anything. He placed a country like Iceland on the same level as countries like Great Britain, France and Italy Further, in the table on page 21, Sweden is one of the highest countries under Table B, and is one of the lowest m the table on page 22. Hungary, which is low m the table on page 21, is high in the table in page 22. Also Mr. Geary's list was not an exhaustive one ; Poland— as important as Iceland—was omitted The suggestion here was that the second series—the fertility rate—was m inverse relationship to the first series—the marriage rate. It might be expected that if the figures for these countries were re-arranged in order of fertility, correlation would be found. He had also made a test for evidence within the Free State and had found no relationship between the result he got and Mr Geary's figures
On the question of emigration, he disagreed strongly with the contention that it was due to attraction from abroad and not to repulsion from home He thought the answer was given m Mr Geary's quotation from Sir Robert Kane. The reason for emigration from Ireland was obviously poverty ; the people went to America because they had no work at home.
Dr. Gregory said this extremely important paper raised two sets of issues of a very dissimilar kind. The first was the result of Mr. Geary's calculation that the population of Ireland is likely to vary for the next eighty years only by about half a million He had no criticism to offer of the calculation, but would like to emphasise the remarkable congruity with the results arrived at for a whole series of countries It indicated that, different as the religious, political and economic circumstances of this island might be, nevertheless the general trend of population was exactly as was predicted for Germany, the United States, Italy and Great Britain. A great many illusions on the subject of Ireland's population were thus dispelled ; but also a great many hopes There was, if Mr. Geary's forecast was correct, not going to be the great mass of consumers to take, if urban, the products of the rural areas, or if rural, the products of the urban areas. Nor would Ireland have to seek territorial expansion for her surplus population.
He could understand that the marriage rate and the number of births per marriage should be influenced by the economic position. But Mr. Geary seemed to imply that—other things being equal—it made no difference whether people married at the age of 20, 30 or 40 There was no relationship between the marriage rate and fertility. He was not a statistician, but that did seem to him to be contrary to commonsense. Another point to be cleared up was the statement that " the economic organisation of each community requires a certain more or less predetermined number of births each year " He could understand that the community required a certain number of births per year to compensate for deaths, but could not understand what the arrange-ment between them was
35
had fewer children. Mai thus' contention that as income increased people had more children had been proved wrong. Mr. Geary was too strongly Malthusian, and should give more attention to new factors important m determining the development of population One other matter. Mr Geary quoted on page 29 from a paper of Mr James Meenan the interesting theory " that the increase in the age at marriage in this country has been due partly to the desire of the people to achieve a suitable standard of living, and that their ideas of what constitutes a suitable standard are based largely upon those of England and the United States, where that standard is par-ticularly high " He felt that this was eminently true. Dreams determined a great deal of human activity, and the dream of Ireland had been a dream of a better life ; the people compared themselves with the town population of Great Britain, and in America they went to the cities. The Swedish farmer's dream was to get a bigger farm—and he went to Minnesota and got it The high death rate of the Irish in America was due to the difficulty of the man from the country adapting himself to city life.
Professor O'Brien said that on behalf of himself and the students present
from University College, he wanted to add his voice to that of the other speakers and thank Mr Geary for what he had done for Irish students of economics, both officially and personally.
The President remarked that as only a short time had been left for Mr.
Geary to deal with the questions raised, he would only add an expression of his great appreciation of the paper and ask that the vote of thanks should be approved.
Mr. Geary, replying, said that he had found the discussion very helpful.
He would like to emphasise that what he had said m his last paragraph was not what he might call " protective civil servese," but a genuine expression of scientific doubt He did not actually resent being called a Malthusian ; what he had tried to do throughout was to find a reasonable explanation of certain statistical relationships. It was useless to calculate correlation coefficients unless there were commonsense grounds for believing that a relationship existed.
With regard to Professor Busteed's criticisms of Tables 4 and 5 he had included every single country m which he could get statistics in the particular form required As he explained in the paper he did not regard this analysis as finally satisfactory, and had no intention of accepting it until all the statistics could be examined He intended to pursue the inquiry by means of the method of partial correlation, taking into account degree of urbanisa-tion, age at marriage, etc , m the different countries and different counties. He failed to follow Professor Busteed's analysis of the statistics m Table 5. The coefficient of correlation of — 44 was unaffected by the order m winch the phenomena were taken, and the coefficient was probably significant. There could not be the slightest doubt that the county analysis yielded a significant result also. In regard to Professor Busteed's observation about emigration, he would merely observe that the Professor had made no attempt to meet the points m the paper.
He did not mean, as Professor Gregory thought he did, that the age at marriage had no effect on fertility. Amongst the white peoples, he would have expected to find a relationship between marriage rate and birth rate. He did not find that relationship, and an explanation was wanted. To say that the results of a calculation were not inconsistent with a certain hypothesis was far fiom saying that the hypothesis was proved. Some attention was directed to the very tentative view that " the economic organisation of each country seemed to require a more or less predetermined number of births." Mr. Geary would be content to have the word " social " substituted for " economic," so that his view really seemed to coincide with Professor Gregory's.