IURA: An Improved User-based Collaborative
Filtering Method Based on Innovators
Qianru Zheng, Chi-Kong Chan, and Horace H.S. Ip
Abstract—User based collaborative filtering (UserCF) is a method that generates recommendations based on the prefer-ences and past actions of like-minded users. Currently, most UserCF based recommendation systems do not consider the users’ purchase precedence and activeness when locating those like-minded users. Yet, these two factors contain valuable information that can contribute to recommendation accuracy and diversity. First, according to the Diffusion of Innovations Theory (DIT), the earlier that a like-minded user purchased an item, the more likely that he would be a trend leader in his respective area of interest. Such users are called the innovators, and they should have higher level of influence on their followers than a typical like-minded user. Second, innovators are typically more active and more adventurous users. They are the ones who are more willing to try out new products of various genres, and would therefore contribute the diversity of the recommendation. Based on these reasons, we propose in this paper an improved UserCF mechanism based on innovators instead of simply like-minded users. The proposed method is simple to implement, and also applicable even in the cases where item release time is not available. Extensive experiments were conducted to evaluate the proposed mechanism using various metrics and the results were encouraging: our proposed scheme not only achieved the best results in term of accuracy, but also performed well in terms of diversity (including intra-list and aggregate diversity) as well.
Index Terms—collaborative filtering, innovators, recommen-dation systems, ordering of users, intra-list diversity, aggregate diversity.
I. INTRODUCTION
R
ECOMMENDATION systems find interesting itemsfrom an overwhelming amount of available informa-tion. To the users, it provides useful and personalized product recommendations among an ever-growing list of selections. To the merchants, it provides an effective cross-selling so-lution for their products. There have been already many successfully applications in various areas [1], ranging from the more traditional applications such as movies recommen-dation in Movielens and Netflix, book and consumer products recommendation in Amazon, to more recent applications in tourism and travel recommendation [2], and social network recommendation [3].
One popular technique commonly employed in recommen-dation system is user based collaborative filtering (UserCF). The idea of UserCF can be summarized briefly in the following steps. Firstly, for all the users, UserCF calculates a similarity score for each pair of users based on the number of items that both users have selected. Secondly, for each target
user, UserCF locates the k most like-minded users based
on the similarity-scores. Any items that have been already
Q. Zheng and H. Ip are with the Department of Computer Science, City University of Hong Kong, Kowloon, Hong Kong, e-mail: ([email protected] and [email protected]).
C. Chan is with Department of Computing, Hang Seng Management College, Hong Kong, e-mail: ([email protected]).
purchased by those k like-minded fellows but not yet by
the target user then form a candidate recommended items set. Finally, the relevance between the target user and each candidate item is computed, and the items with the highest predicted relevance are recommended to the user.
In order to locate the like-minded fellow users, many current UserCF [4] employ a simple counting method. That is, it simply counts the number of co-selected items, and then measures their consistency rating. In such models, all fellow users are treated equally, and are assumed to have equal influence. However, there are evidences that this is not always the case in reality. For example, according to the Diffusion of Innovations Theory (DIT) [5], users can be classified into five categories depending on the time of purchase of their items, namely, the innovators, the early adopters, the early majority, the late majority and the laggards. Innovators are the members of a society who would typically be the first ones to adopt new products. They are aware of their own preference and they are often the trend leaders, whose purchase decisions will have influence on the general public [5]. Thus, if this theory is correct, then not all like-minded fellow users should be treated equally in a recommendation system. Rather, the early adopters, i.e., the innovators, should be given higher weights so that recommendation accuracy can be improved. Moreover, innovators are also more ad-venturous. They are more likely to try out various kinds of items. Thus, innovator-based recommendation system would also have result in higher degree of product diversity as well. After all, diversity improves user satisfaction [6], and is also an important element of recommendation systems.
Based on the above discussions, we proposed an Improved UserCF Recommendation Algorithm (IURA) based on the concept of innovators. The proposed method is easy to imple-ment. Furthermore, it can be applied even in the cases where the item release time is not available, which is often the case in reality. The contributions of this paper are summarized as follow.
• We proposed an Improved UserCF Recommendation
Algorithm (IURA) for recommendation system. IURA is based on the concept of innovator for generating recommendations, resulting in higher recommendations accuracy and diversity.
• We proposed a novel method for finding innovators.
Instead of using item release time, which is not always available, our method is based on the relative purchase ordering of the innovator out of all buyers for the given products. This makes our approach more applicable in real life applications than various related schemes. Additionally, we also proposed novel activeness-based criteria for finding the innovators, which helps to in-crease the diversity of the recommendations.
two representative datasets and compared the results with other popular methods using various evaluation metrics. Experimental studies showed IURA achieved the highest recommendation accuracy compared to other baseline methods. Additionally, IURA also performed well in other recommendation quality metrics, namely intra-list diversity [6], [7] and aggregate diversity [8].
The rest of the paper is organized as follows: we first review the related works in Section II; Section III presents our proposed scheme. Experiment design and results will be shown in Section IV; Conclusion will be given in Section V.
II. RELATEDWORK
There are two research areas that are closely related to our work, namely, collaborative filtering algorithms and the concept of innovators. In the following, we will give an overview on these related literatures.
A. Collaborative Filtering Method
Collaborative Filtering (CF) is one of the most widely used recommendation algorithms. Depending on their tech-nical natures, CF-based methods can be classified as either memory-based or model-based methods. The difference is that while memory-based methods use all data to generate recommendations directly, model-based methods use the data to first learn a model, and then make recommendations through the model. Examples of model-based methods in-clude latent factor models [9] and Bayesian model [10]. Model-based methods require more time to learn the models, while memory-based methods are usually simpler and require less offline computation. Typical memory based CF methods include K-Nearest Neighbors (KNN) CF [4], [11]: UserCF [4] and ItemCF [11]. The mechanism of ItemCF differs from UserCF in that ItemCF calculates the similarity between each pair of items rather than between the users. To measure the similarity between each pair of items, ItemCF counts the number of users who have selected the pair, and then computes the user rating consistency for the two items. For
each candidate recommended item, top k similar items are
then chosen from selections of the given user and a relevance score between the candidate recommended items and the given user is computed.
Although it has been reported that ItemCF achieves better scalability [11], [12], in this paper we mainly focus on UserCF. There are two main reasons for this decision. First, UserCF mines inter-user relationship instead of inter-item relationship as done in ItemCF. And as argued by Kawamae et al. in [13], [14], inter-user relationship is one of the key factors for predicting user future preference. Second, it has been reported that UserCF produced superior performance in top-n recommendation [12], [13], [14], which is an impor-tant evaluation metric in real life applications. Nevertheless, UserCF can still be improved in many aspects. Examples include extending the applicability of UserCF to other data types (e.g. stream data [15]), and improving the overall efficiency (e.g. tackling the cold-start item problem [1]) of UserCF by combining it with content based methods. In this paper, we focus on improving the top-n recommendation per-formance of UserCF by adopting the concept of innovators.
B. Innovators based Methods
The concept of innovators has seen applications in social networking. For instance, in [16], Tyler et al. used innovators to classify items and to predict their likely followers. In [17], Song et al. located the innovators by counting the number of times that a user purchased an item ahead of the others. The concept of innovators has also been applied in UserCF. In [13], [14], Kawamae et al. proposed an innovator-based UserCF by measuring the amount of time that a candidate innovator selected an item ahead of a given user. However, a drawback of this model is that both the user purchase date and the item release date are required. In many real life situation, while the user purchase date is easy available, the item release dates often turn out to be not as easily obtainable as it seems. For example, the exact release dates of some old movies are not available in many movie databases and even in the cases that the dates are available, they are typically not unique as the same movie may be launched in different countries at different time. In such cases, it would be difficult, or even impossible, to calculate the likelihood of a user being an innovator according to the proposed model.
Our current work is partially inspired by Kawamae’s method, but with one important difference. Instead of using the amount of time elapsed between product release time and the purchase time to find the innovators, our model is based on the position of a user among all users who has purchased an item. For this reason, our method has higher applicability as it can be applied even in the cases where the exact item release time is not known. The proposed method is also novel in that we take into account the activeness of the candidate innovator, which is important for providing diversified recommendations. The details of our scheme will be described in the next section.
III. PROPOSEDSCHEME
In this section we describe the proposed scheme in details. The new scheme is named IURA, which stands for Improved User-based Recommendation Algorithm.
A. Finding the Innovators
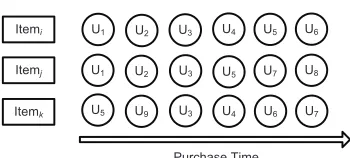
According to the Diffusion of Innovations Theory [5], innovators venture to be the first one to adopt new items or products, and introduce them into the community. Other members get to know the innovation from them. In accor-dance with the innovators’ characteristics of early adoption, we identify potential innovators for a given user based on 2 principles: (1) for the co-selected item, innovators should buy it ahead of the given user. The earlier s/he has bought it, the more likely that s/he is an innovator for the given user; (2) For the candidate innovators, s/he should be active to try out newly released items. In other words, an innovator should purchase the items soon after the items were released. Note that, however, in this interpretation, the concept of innovator can be relative to a user. That is, each user can have his own personal innovators, who are the trend-leaders in his area of interest, who have the greatest influence for that user.
U1 U2 U3 U4 U5 U6
U8
U7
U1 U2 U3 U5
U6
U5 U9 U3 U4 U7
Itemi
Itemk Itemj
[image:3.595.81.256.48.127.2]Purchase Time
Fig. 1. User Ordering of Each Item.
a group of users, it is natural that some users would choose it ahead of the others. An ordered list of users can therefore be generated according to their respective purchased time (Fig.1). LetΠj={uj1, uj2,· · · , ujn}represents the list of the
n users who have chosen an itemj, anduji denotes the ith
user who has purchased the item. Let OΠj,ui represents the
position of ui inΠj. The earlier the user selected the item,
the higher position is his/her position in the ordering list. As
an example, consider useru5 andItemk in Fig. 1. Sinceu5
was the first user to select k,OΠk,u5 is 1 in this case.
We can then define the activeness of the innovators and the lead-time that an innovator purchased an item ahead of other users as follows. First, the activeness of a user is determined by the frequency that the user is located near the top positions of the user orderings of the items that s/he had chosen.
The idea is implemented in Eq.1, whereActive(ui)is the
active score of user ui, |Πj| is the number of users who
selectedj,S(ui)is the set of items selected by userui. The
function avg() computes the average position that a user
locates on the user orderings. The more frequently the user selected the item soon after it released, the higher the active score s/he achieves.
Active(ui) =avg(1−
OΠj,ui
|OΠj|
), j∈S(ui) (1)
In addition to the active score of a user, we also compute the lead time that a candidate innovator selects an item ahead of a given user. The idea is presented in Eq.2, where InterU ser(ui, u) is the inter-user score between ui (the
candidate innovator) and u (a given user) that measures
how much earlier ui selected the co-selected item ahead
of u. S(ui, u) is the set of co-selected items byui and u.
δj(OΠj,ui, OΠj,u) is an indicator function defined in Eq.3:
if ui (the candidate innovator) selected j (the co-selected
item) earlier thanu(the given user),δj(OΠj,ui, OΠj,u)is 1, otherwise it is 0.
InterU ser(ui, u) =
X
j∈S(ui,u)
δj(OΠj,ui, OΠj,u)
[(OΠj,u−OΠj,ui)]
|OΠj|
(2)
Eq.2 is advantageous because it tends to give a higher weight to the innovators who share more co-rated items with the given user. The inter-user score accumulates for each co-selected item. So, as a result, the candidate innovators who have more co-selected items with the given user will achieve higher inter- user score, which in turn indicates that they would have more common interests with the given user, and hence should be able to provide more accurate recommen-dation with higher confidence. In our implementation, the Inter-user scores are normalized using Max-Min method.
With the active score and inter-user score in place, the like-lihood that a given user can serve as an innovator for another
user is then predicted by Eq.4, whereP(ui, u)represents the
likelihood thatuiis an innovator from the perspective of user
u. This way, the users who shares similar interests with the
given user and is active to try out newly released items would have higher chance to be an innovator for the given user. All three functions, Active (ui),InterU ser(ui, u)andP(ui, u)
range from [0,1].
P(ui, u) =Active(ui)·InterU ser(ui, u) (3)
B. The IURA algorithm for User-based Recommendation
Before generating recommendations for a given user,
IURA first locates the top K innovators for a given user
according to Eq. 1-3. Items that have already selected by an innovator but not yet by the given users then constitute the candidate recommended items set for the user. For each candidate item, a predicted rating of it for the given user is then calculated by Eq.4, which computes a weighted average of the innovators’ ratings for the candidate item. Here,r(uk, i)is the rating ofuk (the innovator) for the item
i.
ˆ
r(u, i) =
P
uk∈Inno(u,K)P(uk, u)·r(uk, i) P
uk∈Inno(u,K)P(uk, u)
(4)
Notice that in Eq.4, the denominator forces the predicted rating falls in the specific range, e.g.[15] in Netflix dataset. However, in most of the cases, only the items with the highest predicted ratings will be shown, but the predicted ratings of them are not. This is referred to Find Good Item Task in [18]. To deal with such tasks, we can simplify Eq.4 by removing the denominator as
RP(u, i) = X
uk∈Inno(u,K)
P(uk, u)·r(uk, i) (5)
A benefit of this approach (Eq.5) is that higher rankings would be given to items with many innovators, resulting in higher level of confidence for the recommendations. Note that the computed coefficient in Eq.5 is a recommendation priority (RP), which is not equivalent to the predicted rating, although the higher is an item’s RP, the higher the predicted rating should be. Items with higher RPs are recommended to the user.
IV. EXPERIMENT
To evaluate our proposed method, we conducted a series of experiments on two representative datasets and adopted various metrics for evaluation. In Section IV-A, the adopted datasets are introduced. Experiment setup is presented in Section IV-B. Experiment results are shown in Section IV-C.
A. Datasets
TABLE I
STATISTICAL PROPERTIES OF TWO DATASETS
# of users # of items # of ratings Density Movielens 2,113 10,196 800k 3.976% Netflix 2,000 5,260 215k 6.01%
17k items, 480k users and 100M ratings. For the sake of scalability, the original Netflix dataset is sampled to be a smaller dataset. The statistical properties of these two datasets are summarized in Table.I.
B. Experiment setup
As in general practice, we split the data into two disjoint sets chronologically. The older data constitute the training set, which is used for generating recommendations, and the more recent data constitute the test set, which is used for evaluation. During evaluation, each user was provided with 10 lists of recommendations, with size of 10, 20,. . . , 100 items respectively. The accuracy of each recommendation list is then evaluated.
A number of metrics were employed to evaluate the recommendation quality. The first one was accuracy. In the literature, a popular metric for accuracy evaluation is the Root Mean Square Error (RMSE), which measures the difference between the predicted rating and the true user rating. In many practical recommendation systems, however, the systems only provide a number of ’best bet’ items to the users without revealing the predicted ratings. (Such problems are called the find good items task). For this reason, we adopted three popular top-N performance metrics, namely, precision (Eq.6), recall (Eq.7) and F1-score (Eq.8). Here,
RS(u, N) represents the top N recommendations in the
recommendation list of useru.T estSet(u)is the set of items
in the test set and also chosen by u. Precision measures the
proportion of recommendations among the recommendation list which are actually selected by the users. Recall measures the proportion of the recommendations which are actually selected by the users among the items in the test set. F1-score is a metric which considers both Precision and Recall.
P rec@N=
P
u|RS(u, N)∩T estSet(u)|
N˙|U| (6)
Recall@N=
P
u|RS(u, N)∩T estSet(u)|
|T estSet(u)| · |U| (7)
F1@N =2·P rec@N·Recall@N
P rec@N+Recall@N (8)
In addition to accuracy, the diversity of the recommenda-tions is also evaluated. Diversity is an important concept in recommendation systems because it allows the merchant to cross-sell not just the popular items, but also the ’long-tail’ items (the items located in the tail of the sales distribution) as well. Additionally, a high diversity is also beneficial to the user because it can broaden the user’s horizon and increase his/her satisfaction [6], [8]. In this paper we employed two major types of diversity as evaluation metric, namely, intra-list diversity [6], [7] and aggregate diversity [8]. Intra-list diversity measures the difference between each pair of recommendations in the list. The concept is depicted in
Eq.9, where d(i, j) is the dissimilarity between i (an item)
and j (another item). In this paper, we adopted a
content-independent metric [7] to calculate the similarity between any two items, which is illustrated by Eq.10. The difference functiond(i, j)is then obtained by1−sim(i, j).
IntralistDiversity@N = 2
|U| ·N(N−1)·
X
u
X
i∈RS(u,N) X
j6=i∈RS(u,N)
d(i, j) (9)
sim(i, j) =
P
u∈S(i,j)
(ru,i−ru)·(ru,j−ru)
r P
u∈S(i,j)
(ru,i−ru)2
r P
u∈S(i,j)
(ru,j−ru)2
(10) A related metric that we adopted is the aggregate diversity [8], which measures the number of distinct items recom-mended across all users (Eq.11). A high aggregate diversity in recommendation is beneficial to the e-retailer since it indicates that more distinct items are recommended to the users, thus increases the sale potential.
AggDiversity@N=| ∪u∈URS(u, N)| (11)
To evaluate our scheme, we compared the performance of our method with a number of representative methods. Three schemes for making personalized recommendations are included in this study, namely UserCF [4], an innovator-based UserCF method proposed by Kawamae et al. [13] and SVDpp, which is a representative latent-factor-based method. Latent factor models get popular recently due to their good performance in top-n recommendation problems [25], and SVDpp [9] is an representative approach which considers user-item rating bias and user implicit preference for prediction (interested readers can refer [9] for more details). Apart from these representative methods, we also implemented three other non-personalized approaches to serve as benchmark algorithms, namely, AvgRating, Random and Toppop. AvgRating recommends the items which have the highest average ratings to the user. Random uses a random algorithm to recommends the non-chosen items to the users. Toppop recommends the most popular items to the users.
C. Experiment Result
1) Accuracy Performance: We first evaluated the accuracy
related performance for the seven approaches. The results (precision, recall and F1-score) are presented from Fig. 2 to 7. The performance of Toppop and Avgrating turned out to be very close in this case. Thus, for clarity in display, only the Toppop results are shown in the figures.
10 20 30 40 50 60 70 80 90 100 0
0.05 0.1 0.15 0.2 0.25 0.3 0.35 0.4
Precision
Recommendation List Size N
Precision@N on Movielens IURA
[image:5.595.341.515.52.169.2]Kawamae’s SVDpp UserCF Random Toppop
Fig. 2. Prec@N of each method on Movielens
10 20 30 40 50 60 70 80 90 100 0
0.05 0.1 0.15 0.2 0.25 0.3 0.35
Precision
Recommendation List Size N
Precision@N on Netflix IURAKawamae’s
[image:5.595.84.256.54.171.2]SVDpp UserCF Random Toppop
Fig. 3. Prec@N of each method on Netflix
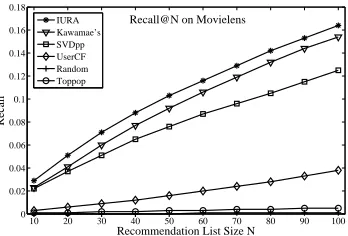
10 20 30 40 50 60 70 80 90 100 0
0.02 0.04 0.06 0.08 0.1 0.12 0.14 0.16 0.18
Recall
Recommendation List Size N Recall@N on Movielens
IURA Kawamae’s SVDpp UserCF Random Toppop
Fig. 4. Recall@N of each method on Movielens
higher than SVDpp, and four times higher than that of UserCF. Similar results can be observed in other metrics. For instance, in Fig.6, our method achieved 27% higher F1-score than the second best method (Kawamae’s method) in
Movielens dataset when N=10. The improvement is even
more significant in the Netflix dataset (Fig.7). Several other observations can be made from Fig.2 to 7. First, all person-alized methods performed better than the non-personperson-alized baseline methods. Second, the two innovator-based methods (IURA and Kawamae’s method) performed better than the others, which provide further evidence on the usefulness of innovators in recommendation systems.
2) Diversity Performance: Finally, we measured the
di-versity performance of the various methods. In previous studies, it has been suggested that diversity (which includes both intra-list and aggregate diversity) is achieved at the expense of accuracy [8], [6]. Based on this background, one of the target of this paper is to provide initial evidence that this is not necessarily so. In fact, we argue that accuracy should be the premise of diversity. Thus, another objective of this paper is to show that diversity and accuracy could be both achievable. For this purpose, we further evaluated the diversities of the three methods that produced highest
10 20 30 40 50 60 70 80 90 100 0
0.02 0.04 0.06 0.08 0.1 0.12 0.14 0.16
Recall
Recommendation List Size N Recall@N on Netflix
[image:5.595.82.257.205.319.2]IURA Kawamae’s SVDpp UserCF Random Toppop
Fig. 5. Recall@N of each method on Netflix
10 20 30 40 50 60 70 80 90 100 0
0.05 0.1 0.15 0.2
F1−Score
Recommendation List Size N F1−Score@N on Movielens
[image:5.595.337.515.208.327.2]IURA Kawamae’s SVDpp UserCF Random Toppop
Fig. 6. F1-Score@N of each method on Movielens
10 20 30 40 50 60 70 80 90 100 0
0.02 0.04 0.06 0.08 0.1 0.12 0.14 0.16 0.18 0.2
F1−Score
Recommendation List Size N F1−Score@N on Netflix
IURA Kawamae’s SVDpp UserCF Random Toppop
Fig. 7. F1-Score@N of each method on Netflix
accuracy in section IV-C1, namely our method (IURA), Kawamae’s method and SVDpp. The results for both intra-list and aggregate diversity are shown in Tables II to V.
[image:5.595.84.258.349.467.2] [image:5.595.340.515.365.481.2]TABLE II
INTRA LIST DIVERSITY ONMOVIELENS DATASET
N 10 20 30 40 50 60 70 80 90 100
SVDpp .391 .424 .453 .472 .484 .494 .502 .511 .519 .528 Kawamae’s .647 .687 .714 .736 .753 .767 .779 .789 .799 .807 Our’s .648 .688 .717 .738 .755 .769 .781 .792 .801 .809
TABLE III
INTRA LIST DIVERSITY ONNETFLIX DATASET
N 10 20 30 40 50 60 70 80 90 100
SVDpp .446 .518 .559 .591 .619 .644 .663 .679 .691 .704 Kawamae’s .732 .802 .842 .870 .889 .904 .915 .924 .959 .939 Our’s .733 .804 .846 .873 .892 .906 .917 .927 .935 .941
TABLE IV
AGGREGATE DIVERSITY ONMOVIELENS DATASET
N 10 20 30 40 50 60 70 80 90 100
SVDpp 61 95 125 150 173 197 221 247 269 289 Kawamae’s 214 320 398 476 529 571 627 681 724 762 Our’s 235 355 441 522 580 632 680 731 780 852
TABLE V
AGGREGATE LIST DIVERSITY ONNETFLIX DATASET
N 10 20 30 40 50 60 70 80 90 100
SVDpp 52 95 131 165 194 224 250 278 302 329 Kawamae’s 215 320 389 459 521 579 621 670 716 750 Our’s 246 372 460 550 618 698 762 818 869 920
V. CONCLUSION
An improved UserCF recommendation algorithm (IURA) for making recommendation based on the concept of innova-tors is proposed in this paper. Innovainnova-tors are those users who often select items ahead of the general public and are active in trying out the new items. More importantly, they are the trend leaders, and would have greater influence on the future choice of the follower. The proposed scheme identifies the innovators through the activeness of the candidate innovators as well as the relative ordering position that an innovator purchased an item among all buyers. The result is a scheme that is not only easy to implement, but can also be applied in real life situation where item release dates are not available. To evaluate the proposed scheme, a series of experiments were conducted on two datasets using various performance metrics. The obtained results are very encouraging. Exper-iment results suggested that, our scheme not only achieved the best performance in terms of accuracy (precision, recall, and F1), but it also performed well in term of intra-list and aggregate diversity also. This is significant because it has been previously suggested that diversity are achieved at a price of accuracy. Our results seem to suggest a new and effective direction in innovator-based recommendation.
REFERENCES
[1] G. Adomavicius and A. Tuzhilin, “Toward the next generation of recommender systems: a survey of the state-of-the-art and possible extensions,” Knowledge and Data Engineering, IEEE Transactions on, vol. 17, no. 6, pp. 734–749, 2005.
[2] J. P. Lucas, N. Luz, M. N. Moreno, R. Anacleto, A. A. Figueiredo, and C. Martins, “A hybrid recommendation approach for a tourism system,” Expert Systems with Applications, vol. 40, no. 9, pp. 3532 – 3550, 2013.
[3] H.-N. Kim, A. E. Saddik, and J.-G. Jung, “Leveraging personal photos to inferring friendships in social network services,” Expert Systems
with Applications, vol. 39, no. 8, pp. 6955 – 6966, 2012.
[4] P. Resnick, N. Iacovou, M. Suchak, P. Bergstrom, and J. Riedl, “Grou-plens: an open architecture for collaborative filtering of netnews,” ser. CSCW ’94, 1994, pp. 175–186.
[5] E. M. Rogers, Diusion of Innovations. New York: The Free Pres, 1995.
[6] C.-N. Ziegler, S. M. McNee, J. A. Konstan, and G. Lausen, “Improving recommendation lists through topic diversification,” ser. WWW ’05. ACM, 2005, pp. 22–32.
[7] M. Zhang and N. Hurley, “Avoiding monotony: improving the diversity of recommendation lists,” ser. RecSys ’08. ACM, 2008, pp. 123–130. [8] G. Adomavicius and Y. Kwon, “Improving aggregate recommenda-tion diversity using ranking-based techniques,” Knowledge and Data
Engineering, IEEE Transactions on, vol. 24, no. 5, pp. 896–911, 2012.
[9] Y. Koren, “Factorization meets the neighborhood: a multifaceted collaborative filtering model,” ser. KDD ’08. ACM, 2008, pp. 426– 434.
[10] J. S. Breese, D. Heckerman, and C. Kadie, “Empirical analysis of predictive algorithms for collaborative filtering,” ser. UAI’98. Morgan Kaufmann Publishers Inc., 1998, pp. 43–52.
[11] B. Sarwar, G. Karypis, J. Konstan, and J. Riedl, “Item-based collab-orative filtering recommendation algorithms,” ser. WWW ’01, 2001, pp. 285–295.
[12] G. Karypis, “Evaluation of item-based top-n recommendation algo-rithms,” ser. CIKM ’01. ACM, 2001, pp. 247–254.
[13] N. Kawamae, H. Sakano, and T. Yamada, “Personalized recommenda-tion based on the personal innovator degree,” ser. RecSys ’09. ACM, 2009, pp. 329–332.
[14] N. Kawamae, “Serendipitous recommendations via innovators,” ser. SIGIR ’10, 2010, pp. 218–225.
[15] X. Li, J. M. Barajas, and Y. Ding, “Collaborative filtering on streaming data with interest-drifting,” Intell. Data Anal., vol. 11, no. 1, pp. 75– 87, 2007.
[16] S. K. Tyler, S. Zhu, Y. Chi, and Y. Zhang, “Ordering innovators and laggards for product categorization and recommendation,” ser. RecSys ’09. ACM, 2009, pp. 29–36.
[17] X. Song, B. L. Tseng, C.-Y. Lin, and M.-T. Sun, “Personalized recommendation driven by information flow,” ser. SIGIR ’06. ACM, 2006, pp. 509–516.
[18] J. L. Herlocker, J. A. Konstan, L. G. Terveen, and J. T. Riedl, “Evaluating collaborative filtering recommender systems,” ACM Trans.
Inf. Syst., vol. 22, no. 1, pp. 5–53, 2004.
[19] J.Bennett and S. Lanning, “The netflix prize,” in Proceedings of KDD
Cup and Workshop, 2007.