Original Article
Effect of phosphorylation of p38 mitogen-activated
protein kinase on Homer1a expression in
the cortex of rats with diffuse brain injury
Cheng-Jing Xue1, Ya-Ning Zhao2, Jian-Min Li1, Chang-Xiang Chen1, Shu-Xing Li1, Ai-Jun Fu1
1Affiliated Hospital of North China University of Science and Technology, Tangshan, China; 2Department of Reha-bilitation, North China University of Science and Technology, Tangshan, China
Received November 3, 2015; Accepted January 5, 2016; Epub April 1, 2016; Published April 15, 2016
Abstract: Objective: To investigate the effect of p38 mitogen activated protein kinase (MAPK) inhibitor SB203580 on phosphorylated p38 MAPK and Homer1a in the cortex of rats with diffuse brain injury (DBI). Method: Rat DBI model was established using Marmarou’s method in the central laboratory in the Department of Neurosurgery of North China university of Science and Technology. 149 male Sprague-Dawlley rats were divided into sham operation (SO) group, DBI group and DBI+ SB203580 intervention group (intraperitoneal injection, 0.01 μg/kg). Brain tissues were removed from each group at 1 h, 6 h, 24 h, 48 h, and 72 h after injury, respectively. Cerebral cortex neutrons were observed under the optic microscope and electron microscope for morphological changes. Levels of phos-phorylated p38 MARPK and Homer1a were detected using immunohistochemistry and immunoblotting. Statistical analysis of experimental data was conducted using SPSS 17.0. Intergroup factorial ANOVA was conducted. P < 0.05 indicated that differences were statistically different. Results: Compared with SO group, degeneratie and necrotic changes were observed in some cerebral cortex neurons of DBI group rats and the number of alived neurons was reduced. Phosphorylated p38 MAPK level was elevated at each time point, reaching a peak level at 24 h and decre-asing at 48 h and 72 h (0.694±0.26 vs. 0.224±0.07; 0.982±0.38 vs. 0.220±0.09; 1.146±0.66 vs. 0.224±0.08; 0.864±0.32 vs. 0.220±0.09; 0.680±0.28 vs. 0.218±0.08; all P < 0.05). Homer 1a expression level was elevated at each time point, reaching a peak level at 24 h and decreasing at 48 h and 72 h, but still higher than that of SO group (0.096±0.020 vs. 0.011±0.010; 0.144±0.026 vs.0.010±0.009; 0.172±0.030 vs. 0.010±0.010; 0.136±0.023 vs.
0.010±0.010; 0.114±0.020 vs. 0.011±0.019; all P < 0.05). Compared with DBI group, DBI+ SB203580 group exhibited reduced morphological and structural lesions in cerebral tissues, increased number of alive neurons, sig-nificant decrease of phosphorylated p38 MAPK level at each time point (0.380±0.18 vs. 0.694±0.26; 0.556±0.29 vs. 0.982±0.38; 0.698±0.36 vs. 1.146±0.66; 0.542±0.28 vs. 0.864±0.32, 0.378±0.26 vs. 0.680±0.28, all P < 0.05), and significantly enhanced expression level of Homer1a at each time point 0.156±0.026 vs. 0.096±0.020; 0.198±0.029 vs. 0.144±0.026; 0.246±0.038 vs. 0.172±0.030; 0.154±0.021 vs. 0.136±0.023, 0.132±0.012 vs. 0.114±0.020, all P < 0.05). Conclusion: The post DBI expression level of Homer1a in the cortex was associated with p38 MAPK activation. Inhibition of p38 MAPK phosphorylation elevated expression of Homer1a and reduced apoptosis of neurons in the cortex.
Keywords: Diffuse brain injury, Homer1a, apoptosis, rat, mitogen-activated protein kinase
Introduction
With the rapid development of transport indus-try, diffuse brain injury has become the most common cause of death or disability in children and adolescents [1]. Pathogenesis of diffuse brain injury includes activation of oxygen free radicals by excitatory amino acids, calcium ion overload, inflammatory factor and electrolytes imbalance, cell apoptosis, etc., causing secon- dary brain tissue injury [2, 3]. Homer is a major
signal transduction protein present in the cen-tral nervous system. The Homer family can be divided into three types, Homer1, Homer3 and Homer3. Homer1a, the first recognized family member, regulated by a variety of stimuli, can block Homer1b/c binding with metabotropic glutamate receptor and regulate intracellular Ca2+ release, thereby affecting synaptic
tion on Homer1a after cerebral injury. Desi- gned to provide new ideas for the treatment of DBI and using a DBI model, this study intro-duced p38 MAPK specific inhibitor SB2033590 intervention and observed the changes of p38 MAPK and Homer1a expression.
Materials and methods
Animal groups and preparation of experiment model
149 male Sprague-Dawley rats were divided into control group (n=35), DBI group (n=69) and DBI+SB203580 intervention group (n=45). Ea- ch group was further divided into five subgroups with time point of 1 h, 6 h, 24, 48 h and 72 h. Animals of DBI group were prepared for DBI models following Marmarou’s method [7]. Ani- mals were anesthetized using ether for 70~150 s. A 450 g copper stick with a diameter of 18 mm was dropped vertically from a 1.5 height to hit the stainless pad placed at the center of rat coronal suture and sagittal suture, causing severe DBI in the rats. Rats in the control gro- up were only anesthetized without brain injury. For DBI+SB203580 inhibitor group, SB203580 was dissolved with dimethysulfoxide (0.4 µg diluted in 4 µl DMSO) and injected intraperito-neally in animals 1 h before injury (0.01 µg/kg). During preparation of models, 34 rats in DBI group died with a mortality of 49.3% and 10 rats in DBI+SB203580 inhibitor group died with a mortality of 22.2%.
Light microscopy: Three rats from each time point were selected from each group. The ani-mals were anesthetized using 0.4% sodium pentobarbital. The heart was exposed following thoracotomy and perfused with 4% paraformal-dehyde. Following decapitation, the brain was removed and an incision was made at the coro-nal region at 1 mm and 6 mm behind the optic chiasm. The central part was removed, fixed in 4% paraformaldehyde, embedded with paraf-fin, sectioned into 5 µm slides, and subjected
in each region were counted using Motic-6.0 image collection and analysis system (200×), expressed as the average cell percentage in each region (% of alive cells number in total cell number).
Electron microscopy: One rat from each time point was selected from each group and was decapitated quickly. The brain was removed and cerebral cortex was separated on ice. Tissue of 0.2 cm at coronal suture was removed, sliced into 1×1×1 mm tissue block, and immedi-ately fixed using 4% glutaraldehyde. It was then flushed with 0.1 mol/L cacodylate buffer twice, fixed in 1% osmium tetroxide and flushed again with buffer. Tissue blocks were then dehydrat-ed with acetone gradient, soakdehydrat-ed in epoxy resin, embedded, sectioned into thin slices, stained with uranyl acetate and lead citrate. Brain microstructure was observed using trans-mission electron microscope (H-7650, Japan) for changes.
Immunohistochemistry assay of Homer1a and phosphorylated p38 MAPK
Immunoblotting of Homer1a and phosphory-lated p38 MAPK
Three rats from each time point were selected from each group. The bilateral cortical tissue was removed immediately after euthanasia and weighed out 0.6 g. Tissues were thoroughly washed with 4°C PBS and added with three times volume of 4°C whole cell lysis buffer. Tissues were homogenized on ice and centri-fuged at 4°C, 12000 r/min for 5 min. Super- natant was collected. Protein concentration in each sample was detected using Coomassie Blue method and samples were stored in -80°C for use. Detection steps: 40 µg protein sample was mixed with the same volume of loading buffer and boiled for 10 min. Samples were subjected to 100 g/L sodium dodecyl sulfate polyacrylamide gel electrophoresis (SDS-PA- GE), membrane transfer, and shaken in block-ing buffer at room temperature for 2-3 h. Ho- mer1a antibody (1:2000) or phosphorylated p38 MAPK antibody (1:2000) was added and incubated at 4°C overnight. Membranes were washed with TBST, and incubated with labeled secondary antibody at 37°C for 1 h. Membranes were washed again with TBST and subjected to ECL development. Intensity was detected using imaging system for quantitative analysis. Statistical analysis
Data were analyzed using SPSS17.0 statistical software. Factorial analysis of variance was employed. Data were expressed as mean ±
standard deviation (x±s). P < 0.05 indicated statistical significance.
Results
Morphological and structural changes of brain tissue
[image:3.629.92.534.79.177.2]Hemorrhage spots were observed in the brain tissue in both DBI group and DBI+SB203580 inhibitor group following injury, without obvious laceration. Under the optical microscope, sub-arachnoid hemorrhage or jaundice, extensive cerebral cortical edema, and vascular cavity expansion and congestion were observed in both groups. Scattered degenerated neurons in cerebral cortex, triangular shaped soma, less stained cytoplasm, shrunk and darkly stained nuclei and presence of intracellular space were observed in both rat groups at different time points. Nuclear dissolution and vacuolar degen-eration of neurons were also observed. Intra- cellular space was significantly increased. Un- der the electron microscope, axonal derange-ment, swelling, sheath bubbling, infolding, lay-ering, obscured axonal neurofilament (degen-eration) and axonal fracture were observed in both DBI rat groups. In addition, capillary pe- ripheral edema and large amount of organelles accumulated in the degenerated swelling neu-rons were observed. The above micro-structur-al changes were micro-structur-alleviated in the DBI+SB203580 group. Together with animal morality and tissue morphological changes, this experimental ani-mal model was successfully established [7].
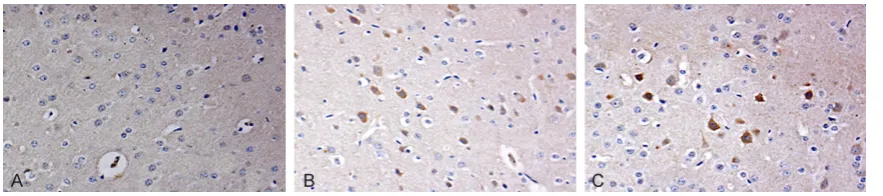
Figure 1. Morphological changes of neurons in rat cortex from various group 24 h after injury. (HE staining ×200, A. Control group; B. DBI group; C. SB203580).
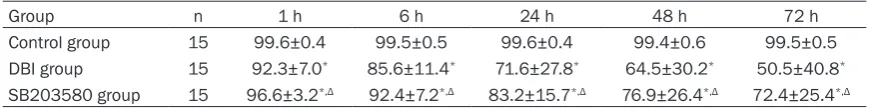
Table 1. Comparison of the rate of survival nerve cells in cortex (%/view, _x±s)
Group n 1 h 6 h 24 h 48 h 72 h
Control group 15 99.6±0.4 99.5±0.5 99.6±0.4 99.4±0.6 99.5±0.5 DBI group 15 92.3±7.0* 85.6±11.4* 71.6±27.8* 64.5±30.2* 50.5±40.8*
SB203580 group 15 96.6±3.2*,Δ 92.4±7.2*,Δ 83.2±15.7*,Δ 76.9±26.4*,Δ 72.4±25.4*,Δ
[image:3.629.97.534.243.298.2]Compared with control group, the survival rate of neurons in DBI group was reduced at each time point. Compared with DBI group, the sur-vival rate of neurons in DBI+ SB203580 inhibi-tor group was increased at each time point (P < 0.05, Figure 1; Table 1).
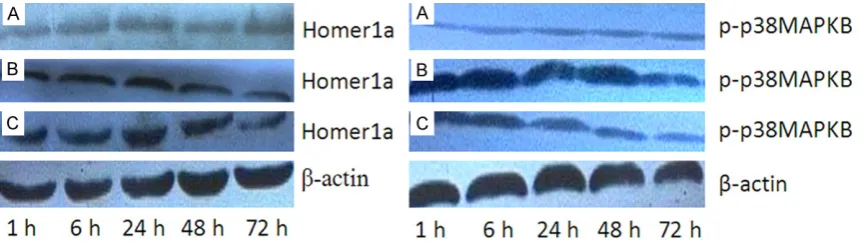
Immunohistochemistry and immunoblotting of Homer1a and phosphorylated p38 MAPK Homer1a was mainly expressed in the cyto-plasm of neurons or extruded yellow-brown granules, while phosphorylated p38 MAPK ma- inly expressed in the nuclei of neurons. There was a very small amount of Homer1a and
phos-phorylated p38 MAPK positive cells stained lightly in the cortex of control group rats. Compared with control group, DBI group exhib-ited more Homer1a and phosphorylated p38 MAPK positive cells in each time point, and both reached a peak level at 24 h (P < 0.05). Compared with DBI group, DBI+ SB203580 inhibitor group exhibited more Homer1a posi-tive cells and decreased phosphorylated p38 MAPK positive cells (P < 0.05, Figure 1; Tables 2, 3). Immunoblotting: clear bands of Homer1a and phosphorylated p38 MAPK were shown and the absorbance of β-actin was used as internal standard for calibration and semi-Table 3. Comparison of the rate of phosphorylated p38MAPK positive cells in cortex (%/view, _x±s)
Group n 1 h 6 h 24 h 48 h 72 h
Control group 15 2.26±0.58 2.30±0.46 2.28±0.40 2.32±0.38 2.28±0.42 DBI group 15 24.38±6.26* 68.42±10.84* 76.98±16.64* 64.86±10.84* 52.68±9.92*
SB203580 group 15 16.16±8.72*,Δ 42.12±9.16*,Δ 54.82±12.48*,Δ 41.72±9.28*,Δ 28.76±7.26*,Δ
[image:4.629.98.533.95.151.2]Note: Compared with control group, *P < 0.05; Compared with the class: DBI group, delta ΔP < 0.05.
Figure 2. Changes of Homer1a positive nerve cells in rat cortex from various group 24 h after injury by immunohis-tochemistry ×200 (A. Control group; B. DBI group; C. SB203580).
[image:4.629.99.533.197.253.2] [image:4.629.95.534.283.383.2] [image:4.629.97.539.428.526.2]quantitative analysis of absorbance of each bands. Compared with control group, Homer1a level was elevated at each time point in DBI group. The protein level reached a peak at 24 h, and reduced at 48 h and 72 h, but still higher than that in control group (P < 0.05). Compared with DBI group, Homer1a protein expression was significantly increased at each time point in DBI+ SB203580 inhibitor group (P < 0.05, Figures 2, 4; Table 4). Compared with control gro- up, phosphorylated p38 MAPK level was elevat-ed at each time point in DBI group. The protein level reached a peak at 24 h, and reduced at 48 h and 72 h, but still higher than that in con-trol group (P < 0.05). Compared with DBI group, phosphorylated p38 MAPK level was decreased at each time point in DBI+ SB203580 inhibitor group (P < 0.05, Figures 3, 4; Tables 4, 5). Discussion
Apoptosis is a process of programmed cell self-destruction and death, regulated by certain sig-naling and apoptotic genes. Since neuron
[image:5.629.102.534.79.202.2]apop-tosis was demonstrated present after brain injury in the 90 s of last century, reduction or inhibition of neuronal apoptosis has become a critical step in the treatment of craniocerebral trauma. P38 MAPK is a serine-threonine pro-tein kinase, extensively expressed in eukaryot-ic cells and its activated form plays a negative regulatory role in the occurrence and develop-ment of central nervous system disease. Drugs blocking or inhibiting p38MAPK activity can sig-nificantly reduce the neuron cell death in hypox-ic-ischemic encephalopathy, decrease the vol-ume of brain damage, and also greatly facilitate the recovery of nerve functions [5, 6, 8]. This study showed that SB203580 reduced damage degree of cortical neuronal morphology in DBI rats and significantly increased the number of alive neurons, indicating that p38MAPK activa-tion played damaging role in the loss of neu-rons in DBI while SB203580 protected DBI rats by regulating p38MAPK activity. These results were consistent with the published literatures [5, 8]. Studies reported that once activated, p38MAPK mediated mitochondrial pathway of Table 4. Comparison of the Homer1a protein expression in cortex
Group n 1 h 6 h 24 h 48 h 72 h
Control group 15 0.011±0.010 0.010±0.009 0.011±0.010 0.010±0.010 0.010±0.010 DBI group 15 0.096±0.020* 0.144±0.026* 0.172±0.030* 0.136±0.023* 0.114±0.020*
SB203580 group 15 0.156±0.026*,Δ 0.198±0.029*,Δ 0.246±0.038*,Δ 0.154±0.021*,Δ 0.132±0.012*,Δ
[image:5.629.99.535.261.317.2]Note: Compared with control group, *P < 0.05; Compared with the class: DBI group, delta ΔP < 0.05.
Table 5. Comparison of the phosphorylated p38MAPK expression in cortex
Group n 1 h 6 h 24 h 48 h 72 h
Control group 15 0.224±0.07 0.220±0.09 0.224±0.08 0.220±0.09 0.218±0.08 DBI group 15 0.694±0.26* 0.982±0.38* 1.146±0.66* 0.864±0.32* 0.680±0.28
SB203580 group 15 0.380±0.18*,Δ 0.556±0.29*,Δ 0.698±0.36*,Δ 0.542±0.28*,Δ 0.378±0.26*,Δ
Note: Compared with control group, *P < 0.05; Compared with the class: DBI group, delta ΔP < 0.05.
[image:5.629.97.532.367.420.2]signal transduction, synapse formation and cel-lular positioning of receptors. Homer1a protein was the first identified member of Homer fami-ly. The main roles of Homer1a include regulat-ing distribution of metabotropic glutamate re- ceptor, reducing the number and activity of polymers of ionotropic glutamate receptor R, regulating cellular Ca2+ release, triggering BK
channel opening (the large-conductance calci-um activated potassicalci-um channel), influencing plasticity of synapses and protecting neurons [4, 11, 12]. In the present study, Homer1a expression was continuously increased in the early stage of brain damage (1-24 h), while decreased at 48 h and 72 h after injury, which was inconsistent with Homer1a dynamic ex- pression results published by Lei Zhang and observed in cerebral ischemia reperfusion ani-mal model and hydraulic brain injury aniani-mal model [13]. The author believed that increased Homer1a level in a short time in the early brain injury enhanced neuron regulatory ability of increased calcium ions, and thus at this stage most of neurons were alive. However, the in- creased Homer1a was not enough to recover the neuronal lesion led by calcium overload, so at 24 h after injury, Homer1a expression reached the peak with significant amount of dead neurons. With prolonged injury time, Ho- mer1a level was decreased; calcium overload and other damaging factors triggered by calci-um resulted in a large amount of necrosis and apoptosis, with rapid reduction of alive neuro-nal density (after 24 h). This study found that Homer1a expression was increased after p38 MAPK pathway blocked by SB203580, sug-gesting that Homer1a participated in the post injury nerve damage mediated by p38 MAPK activation. After brain injury, Homer1a expres-sion elevation was associated with glutamate excitatory activity and calcium ion influx [14, 15]. And the excitatory toxicity generated by glutamate was able to cause rapid expression of cytokines and fast activation of p38 MAPK, thus activation of p38 MAPK was essential in this process [16]. Inhibition of p38 MAPK path-way by SB203580 reduced glutamate
accumu--ubiquitin proteasome, thereby affecting Homer1a [18]. It needs further study to investi-gate the relationship of MAPK signal and Homer1a in the pathological process of brain injury.
In summary, the expression level of Homer1a in the cortex following DBI was related to p38 MAPK activation. Inhibition of p38 MAPK phos-phorylation elevated expression of Homer1a and reduced apoptosis of neurons in the co- rtex.
Disclosure of conflict of interest
None.
Address correspondence to: Dr. Jian-Min Li, Af- filiated Hospital of North China University of Scien- ce and Technology, 78 Jian She South Road, Tang- shan 063000, Hebei Province, China. Tel: +86+150- 81978570; E-mail: [email protected]
References
[1] Graham DI, McIntosh TK, Maxwell WL and Nicoll JA. Recent advances in neurotrauma. Neuropathol Exp Neurol 2000; 59: 641-51. [2] Urban RJ, Harris P and Masel B. Anterior
hypo-pituitarism following truamatic brain injury. Brain Inj 2005; 19: 349-358.
[3] Mcpeak LA, Stries WM and Cope VN. Disability evaluation following traumatic brain injury. Phys Med Rehabil Clin N Am 2001; 12: 587-601.
[4] Sakagami Y, Yamamoto K, Sugiura S, Inokuchi K, Hayashi T and Kato N. Essential roles of Ho-merl a in homeostatic regulation of pyramidal cell excitability: a possible link to clinical ben-efits of electroconvulsive shock. Eur Neurosci 2005; 21: 3229-3239.
[5] Tang ZH, Liao ZB, Shi QH, Xie YF, He ZH and Zhan Y. Blocking p38 signal pathway lowers MMP-9 expression and reduces brain edema in rats with traumatic brain injury. Nan Fang Yi Ke Da Xue Xue Bao 2012; 07: 928-931. [6] Li JM, Zhao YN, Chen CX and Li SX. Ischemic
func-tion. Zhong Hua Shen Jing Wai Ke Za Zhi 2011; 27: 741-745.
[7] Marmarou A, Foda MA, van den Brink W, Campbell J, Kita H and Demetriadou K. A new model of diffuse brain injury in rats. Part I: Pa-thophysiology and biomechanics. Neurosurg 1994; 80: 291-300.
[8] Piao CS, Kim JB, Han PL and Lee JK. Adminis-tration of the p38 MAPK inhibitor SB203580 affords brain protection with a wide therapeu-tic window against focal ischemic insult. J Neu-rosci Res 2003; 73: 537-44.
[9] Li GM, Li J and Cao H. SB202190 reduce gerbil hippocampal CA1 area of cerebral ischemia reperfusion and phosphorylation Caspase 3 levels. Zhong Guo Yao Li Xue Tong Bao 2005; 21: 1150-1151.
[10] Wei ZF, Wang YS, Zhou HX, Zhang ZF, Tian QY, Gao JL and Zhang YX. Inhibit p38MAPK path-way the substantia nigra of Parkinson’s dis-ease model mice and BAD influence of cas-pase 3 expression. Zhong Guo Yi Ke Xue Xue Xue Bao 2009; 38: 497-500.
[11] Sato M and Suzuk S. NMDA receptor stimula-tion and brain-derived neurotrophic factor up-regulate homer 1a mRNA via the mitogen-acti-vated protein kinase cascade in cultured ce- rebellar granule cells. Neurosci 2001; 21911: 3797-3805.
[12] Salm EJ and Thayer SA. Homer proteins accel-erate Ca2+ clearance mediated by the plasma
membrane Ca2+ pump in hippocampal
neu-rons. Biochem Biophys Res Commun 2012; 424: 76-81.
[13] Zhang L, Liu W, Liu WB, Pan WS and Fei Z. After ischemia-reperfusion injury rats cortex Homer-la protein change and significance. Lin Chuang Shen Jing Wai Ke Za Zhi 2009; 01: 1-3. [14] Potschka H, Krupp E, Ebert U, Gümbel C,
Leichtlein C, Lorch B, Pickert A, Kramps S, Young K, Grüne U, Keller A, Welschof M, Vogt G, Xiao B, Worley PF, Löscher W and Hiemisch H. Kindling-induced over expression of Homer 1 A and its functional implications for epilepto-genesis. Eur Neurosci 2002; 16: 2157-2165. [15] Shin DM, Dehoff M, Luo X, Kang SH, Tu J,
Nay-ak SK, Ross EM, Worley PF and Muallem S. Homer 2 tunes G protein-coupled receptors stimulus intensity by regulating RGS proteins and PLC beta GAP activities. J Cell Biol 2003; 162: 293-303.
[16] Chaparro-Huerta V, Flores-Soto ME, Gudiño-Cabrera G, Rivera-Cervantes MC, Bitzer-Quin-tero OK and Beas-Zárate C. Role of p38 MAPK and pro-inflammatory cytokines expression in glutamate induced neuronal death of neonatal rats. Int J Dev Neurosci 2008; 26: 487-495. [17] Cebere A and Liljequist S. Ethanol differentially
inhibits homoquinolinic acid- and NMDA-in-duced neurotoxicity in primary cultures of cer-ebellar granule cells. Neurochem Res 2003; 28: 1193-9.
![Bis[(4 bromobenzoylmethyl)triphenylphosphonium] di μ bromido bis[dibromidomercurate(IV)]](data:image/gif;base64,R0lGODlhAQABAIAAAP///wAAACH5BAEAAAAALAAAAAABAAEAAAICRAEAOw==)