www.impactjournals.com/oncotarget/ Oncotarget, 2017, Vol. 8, (No. 40), pp: 66784-66795
Evaluation of the 7
thand 8
theditions of the AJCC/UICC TNM
staging systems for lung cancer in a large North American
cohort
Lin Yang1,2, Shidan Wang2, Yunyun Zhou2,3, Sunny Lai2, Guanghua Xiao2, Adi
Gazdar4,5 and Yang Xie2
1 Department of Pathology, National Cancer Center/Cancer Hospital, Chinese Academy of Medical Sciences and Peking Union
Medical College, Beijing, China
2 Department of Clinical Sciences, Quantitative Biomedical Research Center, University of Texas Southwestern Medical
Center, Dallas, Texas, USA
3 Department of Data Science, University of Mississippi Medical Center, Jackson, Mississippi, USA
4 Hamon Center for Therapeutic Oncology, University of Texas Southwestern Medical Center, Dallas, Texas, USA
5 Department of Pathology, University of Texas Southwestern Medical Center, Dallas, Texas, USA
Correspondence to: Adi Gazdar, email: [email protected]
Correspondence to: Yang Xie, email: [email protected]
Keywords: non-small cell lung cancer, AJCC/UICC staging system, national cancer database, survival analysis, external validation Received: February 15, 2017 Accepted:April 04, 2017 Published: May 24, 2017
Copyright: Yang et al. This is an open-access article distributed under the terms of the Creative Commons Attribution License 3.0 (CC BY 3.0), which permits unrestricted use, distribution, and reproduction in any medium, provided the original author and source are credited.
ABSTRACT
Purpose: The new 8th American Joint Committee on Cancer (AJCC)/International Union for Cancer Control (UICC) lung cancer staging system was developed and internally validated using the International Association for the Study of Lung Cancer (IASLC) database, but external validation is needed. The goal of this study is to validate the discriminatory ability and prognostic performance of this new staging system in a larger, independent non-small cell lung cancer (NSCLC) cohort with greater emphasis on North American patients.
Methods: A total of 858,909 NSCLC cases with one malignant primary tumor collected from 2004 to 2013 in the National Cancer Database (NCDB) were analyzed. The primary coding guidelines of the Collaborative Staging Manual and Coding Instructions for the new 8th edition AJCC/UICC lung cancer staging system was used to define the new T, M and TNM stages for all patients in the database. Kaplan-Meier curves, Cox regression models and time-dependent receiver operating characteristics were used to compare the discriminatory ability and prognostic performance of the 7th and the revised 8th T, M categories and overall stages.
Results: We demonstrated that the 8th staging system provides better discriminatory ability than the 7th staging system and predicts prognosis for NSCLC patients using the NCDB. There were significant survival differences between adjacent groups defined by both clinical staging and pathologic staging systems. These staging parameters were significantly associated with survival after adjusting for other factors.
Conclusions: The updated T, M, and overall TNM stage of the 8th staging system show improvement compared to the 7th edition in discriminatory ability between adjacent subgroups and are independent predictors for prognosis.
INTRODUCTION
Lung cancer is one of the most common malignant tumors in the world and the leading cause of cancer-related death worldwide [1]. Although considerable progress has been made in the screening of early lung
cancer and in applying targeted therapy to treat advanced cancers, the prognosis of lung cancer remains poor [2, 3]. Accurate categorization of the tumor stage is crucial for prognostic assessment and determining the stage-specific therapeutic strategy. The American Joint Committee on Cancer (AJCC)/International Union for Cancer Control
(UICC) tumor, node, and metastasis (TNM) staging
system for lung cancer has been revised from the 5th to the
8th editions over the last two decades, and the 8th edition
will be instituted in January 2018. As compared to the 7th
edition, the 8th edition staging system introduced changes
to classification in both the T and M categories as well as in the overall stage grouping [4-6].
For the purposes of developing the newly revised
8th edition of TNM lung cancer staging system, a new
database was collected by the International Association for the Study of Lung Cancer (IASLC). The database contained 94,708 cases of patients diagnosed with lung cancer from 1999 to 2010, donated from 35 sources in 16 countries [7], and was used for both the development
and the internal validation of the 8th edition of the staging
system. However, external validation of the 8th edition
of the classification is necessary. For the 7th edition,
external validation was performed using the North American Surveillance, Epidemiology, and End Results Registries (SEER) database [4]. External validation of
the proposed changes made by the 8th edition could not
be performed with the SEER database due to the limited availability of certain site-specific factors. In addition, only 5% (N=4,660) of patients in the IASLC database
for the 8th staging system were from North America. In
comparison, 21% (N=21,130) of patients in the IASLC
database developed for the 7th edition were from North
America. Factors beyond anatomic characteristics of the disease have important implications on prognosis, including geographic region, time period, and type of database. Since North American patients are relatively
underrepresented in the 8th edition, external validation in
a large North American cohort is especially important. The National Cancer Database (NCDB) includes over 1.1 million patients diagnosed with non-small cell lung cancer (NSCLC) from 2004 to 2013 in the United States, providing an ideal external dataset to validate
the discriminatory and prognostic performance of the 8th
edition lung cancer staging system. The goal of this study is to evaluate the discriminatory ability of the revised
8th edition T category, M category and overall stages as
well as the prognostic accuracy of the staging system
and compare it with the 7th edition staging system in the
NCDB cohort.
RESULTS
Evaluation of the T component
A total of 368,367 cases with cT and 177,409 cases with pT parameters were included in the comparison of
the 7th and 8th edition T categories. Patient numbers in
different subgroups according to the 7th and 8th edition
subdivision guidelines were cross-tabulated in Table
1. As the table shows, changes occurred mainly in the
following categories: the 7th edition T1a was divided into
the 8th edition T1a & T1b categories; T2a was divided
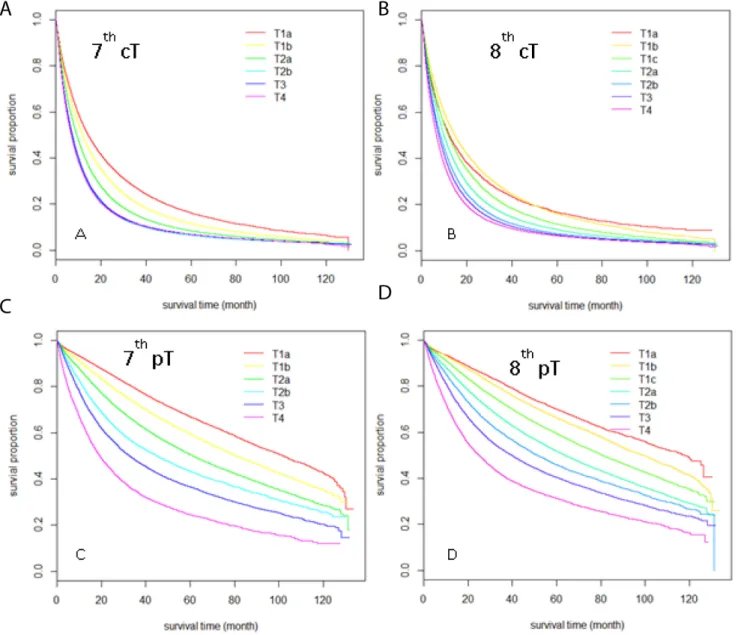
into T2a and T2b categories; and T3 category was re-categorized into T2, T3 and T4 groups. To see how these changes affected the overall survival (OS) outcomes, we drew Kaplan-Meier curves for OS for the subgroups
of the T category of the 7th and 8th editions based on cT
staging (Figure 1A, 1B) and pT staging (Fig 1C, 1D) separately, and also performed univariate Cox regression analysis between all pairs of adjacent subgroups in the
7th and 8th edition cT and pT subgrouping (Table 2). For
pT staging parameters, the 8th edition staging system has
better discriminatory ability compared to the 7th edition
staging system, and the survival time decreases as the pathological stage progresses to the next sub-groups for all sub-groups. For example, the median survival time (MST) for the newly defined pT1b vs. pT1a group was 99.1 months vs. 117.8 months (HR=1.16, p<0.001). For cT staging parameters, the improvement in discriminatory ability appears mainly for the advanced stages, but the survival curves overlap for early stages (for example,
cT1b vs. cT1a in the 8th edition in Figure 1B), and the
median survival time is longer for T1b (14.7 vs. 12.3
months). For the overall performance between the 8th
and 7th editions of T staging, the C-index for the 8th pT
subgrouping (0.610±0.001) was higher than that of the 7th
edition (0.608±0.001), and a similar result was found in
the 8th edition cT subgrouping (0.556±0.001) compared to
that of the 7th edition cT (0.551±0.001).
Evaluation of the N component
A total of 567,844 patients with pN parameters and 208,752 patients with cN parameters were included in the
OS for the 7th and 8th editions as well. No changes have
been made for N component in the 8th edition compared
to the 7th edition. Significant difference between N0,
N1, N2, N3 were found both in cN and pN subgroups (Supplementary Table 1). The C-index was 0.634±0.001
for the 7th/8th edition pN, and 0.607±0.001 for the 7th/8th
edition cN.
Evaluation of the M component
A total of 493,829 cases with cM and 24,721 cases with pM parameters were included in the comparison of
the 7th and 8th edition M categories. Patient numbers in
different subgroups according to the 7th and 8th subdivision
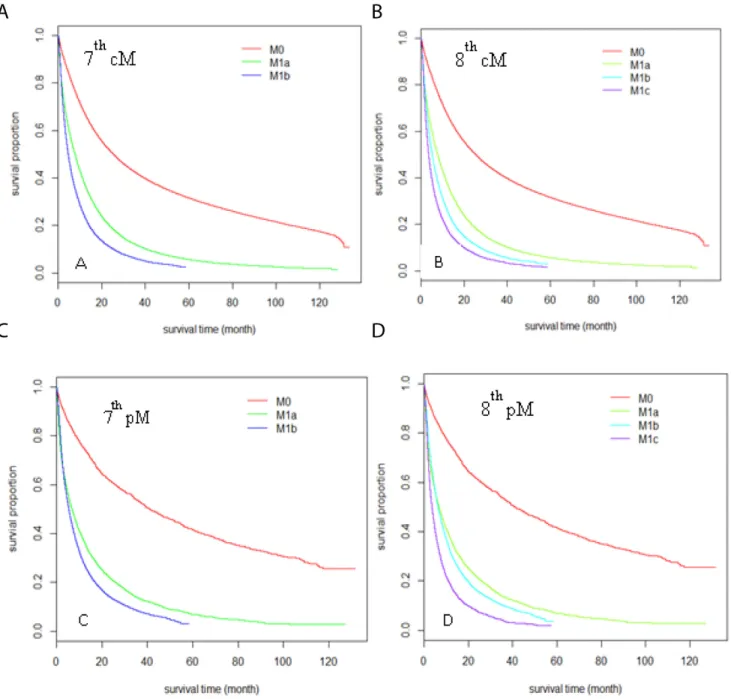
guidelines were cross-tabulated in Table 3. The difference between the two editions is that the M1b stage was further refined into the M1b and M1c subgroups. Results showed the Kaplan-Meier curves for overall survival (OS) for
subgroups of the M category of the 7th and 8th editions
univariate Cox regression analysis between all pairs of
adjacent subgroups in the 7th and 8th edition cM and pM
subgrouping (Table 4). The MST for pM1c vs. pM1b is 3.5 vs. 6.3 months (HR=1.49), and the MST for cM1c vs. cM1b is 3.5 vs. 5.2 months. These show that the
newly defined M subgroups in the 8th edition have good
discriminative ability for survival outcome. Furthermore,
the C-index for the 8th edition pM subgrouping
(0.564±0.002) was higher than that of the 7th edition
(0.547±0.002), and a similar result was found in the 8th
edition cM subgrouping (0.581±0.001) compared to that
of the 7th edition cM (0.580±0.000).
Evaluation of the TNM stage grouping and prognostic accuracy
A total of 84,076 cases with cTNM and 1,812 cases with pTNM parameters were included in the comparison
of the 7th and 8th edition TNM categories. Patient numbers
in different subgroups according to the 7th and 8th edition
subdivision guidelines were cross-tabulated in Table 5. Of note, the NCDB requires that reporting of any cell size<11 be suppressed, and the associated total number also be suppressed, thus we used “*” or “#” to indicate those cells in both Tables 5 and 6. The main differences
between the two editions were that the 7th edition stage
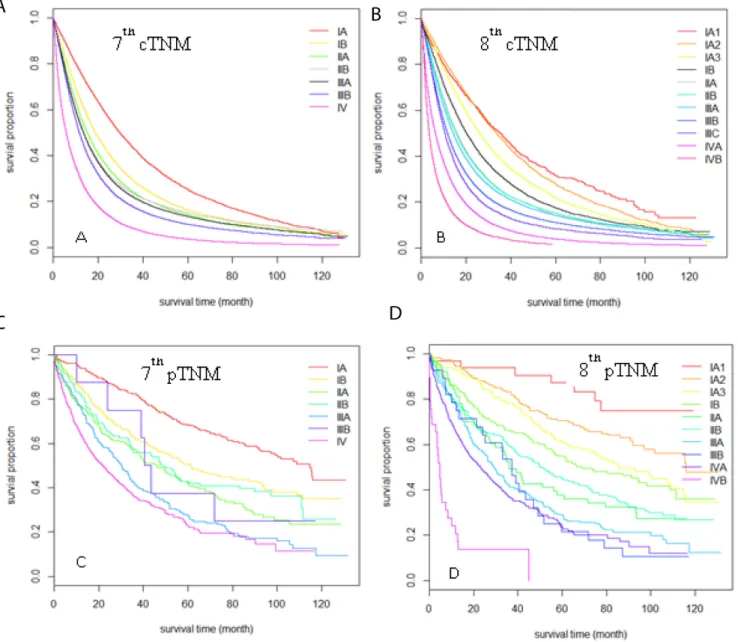
IA was refined to IA1, IA2 and IA3, and stage IV was refined to IVA and IVB. For both pTNM and cTNM, the
Figure 1: Kaplan-Meier Survival curves comparison among different T stages sub-groups. Sub-groups were defined by clinical T stage according to the 7th edition A., and the 8th edition B.; sub-groups were defined by pathological T stage according to the 7th
new stage IVB subgroup had significantly worse survival compared to stage IVA (MST: 3.6 vs. 6.3m for cIVB vs. cIVA, HR=1.5; MST: 4.7 vs. 23.0m for pIVB vs. pIVA, HR=3.18). For pathological stage IA, there was clear separation among stages pIA1, pIA2 and pIA3 (Figure 3). For clinical stage IA, the survival outcomes between cIA1 and cIA2 were similar but cIA3 had significantly worse survival outcome. This was consistent with clinical T staging results. For both clinical and pathological stages,
the refined stage II and III subgroups in the 8th edition had
better survival discrimination than the 7th edition. Due to
the relatively small sample size, the variation for pTNM
stage was large and the discrimination within stage II and III subgroups was still not very good.
Multivariate Cox regression analysis was performed
for validating the prognostic significance of the 7th and 8th
edition TNM staging system, adjusted by age, gender, race, comorbidity, and histology. Our results were similar to the univariate analysis. Furthermore, the C-index for the
8th edition pTNM subgrouping (0.644±0.009) was higher
than that of the 7th edition (0.636±0.009), and a similar
result was found in the 8th edition cTNM subgrouping
(0.624±0.001) compared to that of the 7th edition cTNM
(0.617±0.001). Also, time-dependent ROC was calculated
Figure 2: Kaplan-Meier survival curves comparison among different M stages sub-groups. Sub-groups were defined by clinical M stage according to the 7th edition A., and the 8th edition B. sub-groups were defined by pathological M stage according to the 7th
at 12-month intervals from the 12th to the 108th month (Fig
4). The average AUC of the 8th edition pTNM (0.760) was
higher than that of the 7th edition pTNM (0.752), and the
average AUC of the 8th edition cTNM (0.678) was also
higher than that of the 7th edition cTNM (0.671), which
indicates a better prognostic performance of the 8th edition
AJCC TNM staging system compared to that of the 7th
edition.
DISCUSSION
We used the NCDB data as an external validation
source for the 8th edition TNM lung cancer staging system
and did a comparative analysis with the pre-existing 7th
edition. We chose the NCDB because it is a nationally
recognized clinical oncology database sourced from hospital registry data that are collected in more than 1,500 Commission on Cancer (CoC)-accredited facilities all over the United States, which represent more than 70 percent of newly diagnosed cancer cases nationwide and more than 34 million historical records [8]. It is powerfully representative of real clinical practice settings. The results of the current study showed good external validation of
the 8th edition staging system through comparison with
the 7th edition, focusing on the discriminative ability of
each adjacent subgroup of the newly revised T and M components and overall stage grouping.
The newly revised 8th edition TNM staging
system introduced changes in the classification of the T descriptor and M descriptor, but introduced no changes
Figure 3: Kaplan-Meier survival curves comparison among different TNM stages sub-groups. Sub-groups were defined by clinical TNM stage according to the 7th edition A., and the 8th edition B. sub-groups were defined by pathological TNM stage according
in N classification similar to that of the 7th edition. The
revision for the 8th edition compared to the 7th edition of
AJCC TNM staging system consisted of changes in the T descriptors that reclassifies tumor size into more redefined T subgroups, reclassifies tumor involvement in the main bronchus regardless of distance from carina, reclassifies atelectasis/pneumonitis, reclassifies diaphragm invasion and deletes mediastinal pleural effusion as a T descriptor [9]. Benefitting from the detailed coding system of NCDB, all of the above T descriptor related factors were included in definitions and analysis for this comparison
and analysis study. It was found that the 8th edition T
categorization schema performs better than that of the 7th
edition in discriminating different T subgroups, especially
in the pT1 stage. The subdivision of T1 in the 8th edition
will offer greater prognostic precision in critical points of making surgical decisions. For example, lobectomy, as compared to sublobar resection, was traditionally considered the procedure of choice for early stage lung cancer due to lower rates of local recurrence [10, 11]. More recent studies indicate that segmentectomy may be sufficient in certain populations [5]. As Phase III trials are initiated to better define the role of sublobar resection for high-risk operable patients with NSCLC ≤
3cm, the greater degree of subgrouping in the 8th edition
may prove to be valuable in categorizing small,
early-Table 1: Cross tables for patients included for analysis of T stages ( the 7th edition vs. the 8th edition). Clinical T stage T1a T1b T2a 7th editionT2b T3 T4
8th edition T1a 6,261 - - - - -T1b 36,380 - - - - -T1c - 47,705 - - - -T2a - - 63,136 - - -T2b - - 38,735 - 2,013 -T3 - - - 44,645 36,843 -T4 - - - - 33,527 55,478
Pathological T stage T1a T1b T2a7th editionT2b T3 T4
8th edition T1a 9,599 - - - - -T1b 41,999 - - - - -T1c - 32,123 - - - -T2a - - 44,387 - 758 -T2b - - 13,654 - 289 -T3 - - - 12,650 11,096 -T4 - - - - 7,088 3,856
Figure 4: Time-dependent area-under-curves (AUC) from the 12th month to 108th month, calculated by the 7th and 8th clinical
stage tumors in a way that mirrors the decision between sublobar resection and lobectomy [11]. The survival
curves overlap for clinical T1b vs. T1a using the 8th edition
clinical TNM IA1 and IA2. The reason clinical staging may not be as discriminative as pathological staging is the lower precision of tumor size measurement for very small tumors. In particular, lung adenocarcinomas (≤3 cm) with lepidic histology typically have the appearance of ground glass opacity (GGO), which is generally not
recorded within the tumor size, according to the 8th edition
T descriptor classification of small lung adenocarcinomas
with a GGO and lepidic component by CT and pathologic assessment [12]. This needs to be further studied for the
refinement of T1a and T1b stage in the 8th edition.
The present study has several limitations. First, because this is a retrospective analysis we have no access to information for subdividing Tis and T1a (mi) according
to the 8th edition proposal, which needs to be confirmed
by pathological observation. Prospective collection of appropriate cases is desirable for addressing the discrepancy between stage IA and IB. Second, the sample size was relatively small for evaluating the pathological
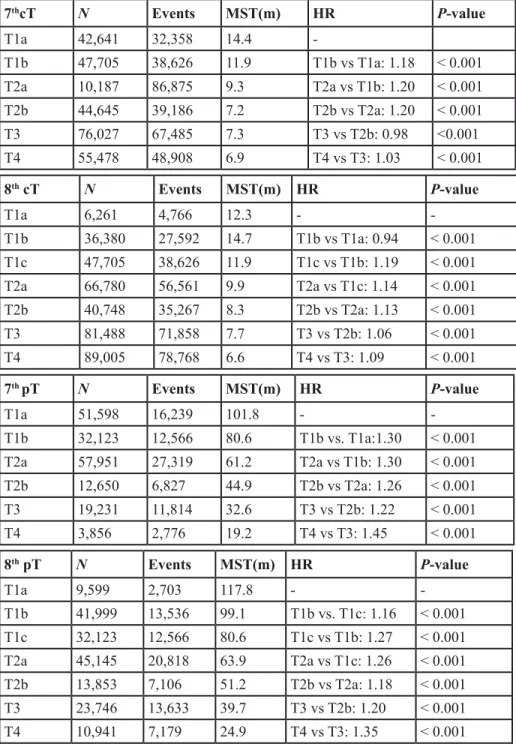
Table 2: Univariate Cox regression analysis result for T stage in the 7th & 8th editions, both for clincial T(cT)and
pathological T(pT)( MST, median survival time).
7thcT N Events MST(m) HR P-value T1a 42,641 32,358 14.4 -T1b 47,705 38,626 11.9 T1b vs T1a: 1.18 < 0.001 T2a 10,187 86,875 9.3 T2a vs T1b: 1.20 < 0.001 T2b 44,645 39,186 7.2 T2b vs T2a: 1.20 < 0.001 T3 76,027 67,485 7.3 T3 vs T2b: 0.98 <0.001 T4 55,478 48,908 6.9 T4 vs T3: 1.03 < 0.001 8th cT N Events MST(m) HR P-value T1a 6,261 4,766 12.3 - -T1b 36,380 27,592 14.7 T1b vs T1a: 0.94 < 0.001 T1c 47,705 38,626 11.9 T1c vs T1b: 1.19 < 0.001 T2a 66,780 56,561 9.9 T2a vs T1c: 1.14 < 0.001 T2b 40,748 35,267 8.3 T2b vs T2a: 1.13 < 0.001 T3 81,488 71,858 7.7 T3 vs T2b: 1.06 < 0.001 T4 89,005 78,768 6.6 T4 vs T3: 1.09 < 0.001 7th pT N Events MST(m) HR P-value T1a 51,598 16,239 101.8 - -T1b 32,123 12,566 80.6 T1b vs. T1a:1.30 < 0.001 T2a 57,951 27,319 61.2 T2a vs T1b: 1.30 < 0.001 T2b 12,650 6,827 44.9 T2b vs T2a: 1.26 < 0.001 T3 19,231 11,814 32.6 T3 vs T2b: 1.22 < 0.001 T4 3,856 2,776 19.2 T4 vs T3: 1.45 < 0.001 8th pT N Events MST(m) HR P-value T1a 9,599 2,703 117.8 - - T1b 41,999 13,536 99.1 T1b vs. T1c: 1.16 < 0.001 T1c 32,123 12,566 80.6 T1c vs T1b: 1.27 < 0.001 T2a 45,145 20,818 63.9 T2a vs T1c: 1.26 < 0.001 T2b 13,853 7,106 51.2 T2b vs T2a: 1.18 < 0.001 T3 23,746 13,633 39.7 T3 vs T2b: 1.20 < 0.001 T4 10,941 7,179 24.9 T4 vs T3: 1.35 < 0.001
TNM staging system, which leads to large variation in the survival estimations. Third, the comparison of “M1b” to “M1c” in our analysis was between single-organ and multi-single-organ metastatic involvement, rather than between oligometastatic and multi-lesion metastases as intended by the IASLC, because there was no record of metastatic sites in one or more organs. Still, a significant difference was found between “M1b” and “M1c”, despite the confounding presence of multi-lesion single organ disease in “M1b” narrowing the differences between the categories. For the same reasons as stated above for evaluation of the M descriptor, analysis was limited for
the 8th edition stage IV disease, as the M1b descriptor is
categorized under stage IVA while the M1c descriptor is categorized under stage IVB.
In summary, this is the first external validation of
the newly revised 8th edition TNM staging system, based
on a large North American cohort from the NCDB. Since North American patients are relatively underrepresented
in the 7th and 8th editions, external validation in a large
North American cohort is especially important. Our
study validated both the 7th and 8th editions of staging for
NSCLC using both clinical and pathological measures
and concluded that the 8th edition has overall better
Table 3: Cross tables for patients included for analysis of M stages(the 7th edition vs. the 8th edition), both for clinical
and pathological M stages.
Clinical M stage 7M0th edition M1a M1b 8th edition
M0 1,409,366 -
-M1a - 41,577
-M1b - - 31,283
M1c - - 11,603
Pathological M stage 7M0th edition M1a M1b 8th edition
M0 1,682 -
-M1a - 7,775
-M1b - - 10,941
M1c - - 4,323
Table 4: Univariate Cox regression analysis result for M stage in the 7th & 8th editions, both for clincial M(cM)and
pathological M(pM)( MST, median survival time).
7th cM N Events MST(m) HR P-value M0 409,366 261,531 25.3 - -M1a 41,577 36,040 7.6 M1a vs M0: 2.53 < 0.001 M1b 42,886 37,649 4.6 M1b vs M1a: 1.38 < 0.001 8th cM N Events MST(m) HR P-value M0 409,366 261,531 25.3 - - M1a 41,577 36,040 7.7 M1a vs. M0: 2.53 < 0.001 M1b 31,283 27,123 5.2 M1b vs M1a: 1.30 < 0.001 M1c 11,603 10,526 3.5 M1c vs M1b: 1.28 < 0.001 7th pM N Events MST(m) HR P-value M0 1,682 1,106 41.2 - -M1a 7,775 6,404 6.7 M1a vs M0: 3.13 < 0.001 M1b 15,264 13,107 5.3 M1b vs M1a: 1.21 < 0.001 8th pM N Events MST(m) HR P-value M0 1,682 1,106 41.2 - - M1a 7,775 6,404 6.7 M1a vs M0:3.13 < 0.001 M1b 10,941 9,175 6.3 M1b vs M1a: 1.10 < 0.001 M1c 4,323 3,932 3.5 M1c vs M1b: 1.49 < 0.001
discriminative ability for overall survival outcomes.
CONCLUSIONS
Both the 7th and 8th editions of staging for NSCLC,
using both clinical and pathological measures, were validated in a large North American focused cohort. The updated T and M categories and overall stages of the
8th staging system were better than in the 7th edition in
discriminatory ability for the adjacent subgroups, and were also independent predictive factors for prognosis.
MATERIALS AND METHODS
Patient population and inclusion criteriaThe University of Texas Southwestern Medical Center Institutional Review Board approved this retrospective analysis of the National Cancer Database (NCDB) dataset. The NCDB is a jointly administered effort by the American Cancer Society and the American College of Surgeons Commission on Cancer (CoC),
collecting data from more than 1,500 cancer facilities around the United States. The database currently contains more than 30 million patient records and is estimated to capture approximately 70% of all new cancer diagnoses in the United States. 1,163,465 de-identified NSCLC cases from the NCDB were collected, all of which were diagnosed from 2004 to 2013. Patients with more than one malignant primary tumor and with a tumor size larger than 10cm were excluded from the analysis, leaving 858,909 cases. Based on the primary coding dictionary of NCDB, we collected variables associated with the definition of T categories from Collaborative Stage (CS) Data Collection System, including tumor size, pleural invasion, and invasion of adjacent tissue or organs. We also collected CS Mets at Dx for bone, brain, and liver to classify M1b and M1c subgroups. For M1a and M0, there were no
changes between the 7th and 8th editions, so we kept the
primary data for analysis. Of note, these variables are only available for cases after 2010, thus M1a, M1b and M1c subgroups analysis were applied to patients diagnosed since 2010 instead of 2004.
Table 5: Cross tables for patients included for analysis of TNM stages (the 7th edition vs. the 8th edition) in clinical
TNM(cTNM) and pathological TNM(pTNM) (* indicating numbers<11 are suppressed according to the NCDB requriement).
cTNM stage 7th edition
IA IB IIA IIB IIIA IIIB IV
8th edition IA1 161 - - - -IA2 819 - - - -IA3 919 - - - -IB - 1,234 - 76 - - -IIA - 608 - 42 - - -IIB - - 1,625 968 50 - -IIIA - - - 887 4,955 - -IIIB - - - - 1,655 1,820 -IIIC - - - 661 -IVA - - - 57,776 IVB - - - 9,820 pTNM stage 7th edition
IA IB IIA IIB IIIA IIIB IV
8th edition IA1 34 - - - -IA2 165 - - - -IA3 140 - - - -IB - 161 - * - - -IIA - 63 - * - - -IIB - - 171 57 * - -IIIA - - - 47 135 - -IIIB - - - - 20 * -IIIC - - - -IVA - - - 768 IVB - - - 29
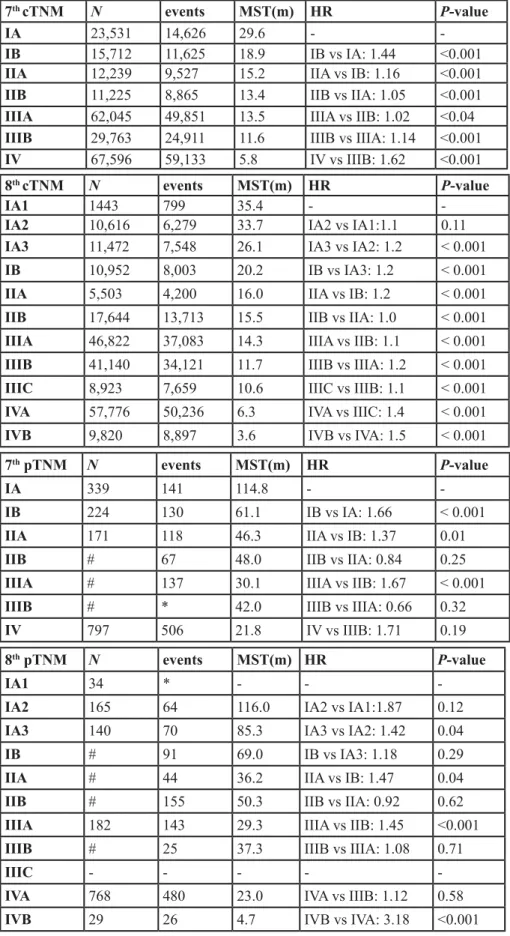
Table 6: Univariate Cox regression analysis result for TNM stage in the 7th & 8th editions, both for clinical & pathological
TNM stages separately.
7th cTNM N events MST(m) HR P-value
IA 23,531 14,626 29.6 - -
IB 15,712 11,625 18.9 IB vs IA: 1.44 <0.001
IIA 12,239 9,527 15.2 IIA vs IB: 1.16 <0.001
IIB 11,225 8,865 13.4 IIB vs IIA: 1.05 <0.001
IIIA 62,045 49,851 13.5 IIIA vs IIB: 1.02 <0.04
IIIB 29,763 24,911 11.6 IIIB vs IIIA: 1.14 <0.001
IV 67,596 59,133 5.8 IV vs IIIB: 1.62 <0.001
8th cTNM N events MST(m) HR P-value
IA1 1443 799 35.4 - -
IA2 10,616 6,279 33.7 IA2 vs IA1:1.1 0.11
IA3 11,472 7,548 26.1 IA3 vs IA2: 1.2 < 0.001
IB 10,952 8,003 20.2 IB vs IA3: 1.2 < 0.001
IIA 5,503 4,200 16.0 IIA vs IB: 1.2 < 0.001
IIB 17,644 13,713 15.5 IIB vs IIA: 1.0 < 0.001
IIIA 46,822 37,083 14.3 IIIA vs IIB: 1.1 < 0.001
IIIB 41,140 34,121 11.7 IIIB vs IIIA: 1.2 < 0.001
IIIC 8,923 7,659 10.6 IIIC vs IIIB: 1.1 < 0.001
IVA 57,776 50,236 6.3 IVA vs IIIC: 1.4 < 0.001
IVB 9,820 8,897 3.6 IVB vs IVA: 1.5 < 0.001
7th pTNM N events MST(m) HR P-value
IA 339 141 114.8 -
-IB 224 130 61.1 IB vs IA: 1.66 < 0.001
IIA 171 118 46.3 IIA vs IB: 1.37 0.01
IIB # 67 48.0 IIB vs IIA: 0.84 0.25
IIIA # 137 30.1 IIIA vs IIB: 1.67 < 0.001
IIIB # * 42.0 IIIB vs IIIA: 0.66 0.32
IV 797 506 21.8 IV vs IIIB: 1.71 0.19
8th pTNM N events MST(m) HR P-value
IA1 34 * - - -
IA2 165 64 116.0 IA2 vs IA1:1.87 0.12
IA3 140 70 85.3 IA3 vs IA2: 1.42 0.04
IB # 91 69.0 IB vs IA3: 1.18 0.29
IIA # 44 36.2 IIA vs IB: 1.47 0.04
IIB # 155 50.3 IIB vs IIA: 0.92 0.62
IIIA 182 143 29.3 IIIA vs IIB: 1.45 <0.001
IIIB # 25 37.3 IIIB vs IIIA: 1.08 0.71
IIIC - - - -
-IVA 768 480 23.0 IVA vs IIIB: 1.12 0.58
IVB 29 26 4.7 IVB vs IVA: 3.18 <0.001
(* indicating suppressed numbers for cell size<11 or # indicating the total number from suppressed cell size in Table 5, according to the requirment of the NCDB)( MST,median survival time).
Staging
Using the CS tumor size, pleural invasion, and invasion of adjacent tissue or organs, and Mets at Dx
variables in the NCDB database, we defined 7th and 8th
edition clinical and pathological T/M categories according
to the guidelines [5, 9, 13, 14]. Specifically, the new 8th T
categorization schema was grouped by 1-cm increments in tumor size up to more than 7-cm. The T1 category was subdivided into T1a (≤1cm), T1b (>1 to ≤ 2cm), and T1c (>2 to ≤ 3cm); T2 was subdivided into T2a (>3 to ≤4cm) and T2b (>4 to ≤5cm); tumors within the sizes of 5-7cm were reclassified as T3; and tumors greater than 7cm were redefined as T4[9]. The NCDB dataset contained information on sites of organ metastases, but not on the number of metastatic lesions at a particular organ. Thus in the current retrospective dataset of NCDB, patients with metastases to a single organ were assigned as the M1b descriptor. Patients who had metastases to multiple different organs were assigned the M1c descriptor. For the N descriptor, there are existing N0, N1, N2, and N3 subgroups in NCDB; we kept the primary data as a subgrouping of N category. Stage grouping was
then assigned according to the 7th and 8th edition TNM
classification proposed by the IASLC.
For the comparison of T staging criteria in the
7th and 8th editions, only cases with information on both
the 7th and 8th edition T stage and survival outcome were
included, and 368,267 cases with pathological T (pT) stage and 177,409 cases with clinical T (cT) stage were analyzed separately. For comparison of the M staging criteria,
similarly, only cases with information on both the 7th and
8th edition M stage and survival outcome were included,
and 24,721 cases with pathological M (pM) stage and 493,829 cases with clinical M (cM) stage were analyzed separately. The N staging criteria remained unchanged
between the 7th and 8th edition, and 567,844 cases were
included in the pathological N (pN) group and 208,752 cases in clinical N (cN) group for the analysis. For overall
TNM staging criteria for both the 7th and 8th editions, only
those cases with all information on separate T, N, and M parameters were included in the analysis. 1,812 cases with pathological TNM (pTNM) parameters and 84,076 cases with clinical TNM (cTNM) parameters were collected.
Statistical analysis
Overall survival data was measured from the date of diagnosis to the date of death or last contact. Kaplan-Meier survival curves, univariate and multivariate Cox regression models, and Wald tests were used to compare
the discriminatory ability of the 7th and the revised 8th
edition T category, M category and overall stages. All statistical results were considered significant if p-value ≤ 0.05. The concordance index (C-index) and
time-dependent receiver operating characteristics (ROC) were
used to compare the prognostic accuracy of the 7th and 8th
edition staging schemas. The area under the curve (AUC)
of ROC was calculated at 12-month intervals from the 12th
to the 108th month for both the 7th and 8th edition staging
systems. The time-dependent AUC curve was calculated by Inverse Probability of Censoring Weighting (IPCW) estimation. All analyses were performed in R software, V3.3.2. The R packages “survival” and “timeROC” were used.
Author contributions
Study design: Lin Yang, Yunyun Zhou, Yang Xie, Adi Gazdar
Statistical analyses: Shidan Wang, Yunyun Zhou, Guanghua Xiao
Manuscript preparation: Lin Yang, Shidan Wang, Sunny Lai, Yang Xie, Adi Gazdar
Manuscript review: all authors
ACKNOWLEDGMENTS
We thank NCDB dataset project. The NCDB is a joint project of the Commission on Cancer of the American College of Surgeons and the American Cancer Society. The data used in the study are derived from a de-identified NCDB file. The American College of Surgeons and the Commission on Cancer have not verified and are not responsible for the analytic or statistical methodology employed, or the conclusions drawn from these data by the investigator. This work was supported by the National Institutes of Health [5R01CA152301, P50CA70907, 5P30CA142543, 1R01GM115473 and 1R01CA172211]; the Cancer Prevention and Research Institute of Texas [RP120732]; and the Fundamental Research Funds for the Central Universities (3332015060, 2015- 2017).
CONFLICTS OF INTEREST
None declared, by all authors.
Editorial note
This paper has been accepted based in part on peer-review conducted by another journal and the authors’ response and revisions as well as expedited peer-review in Oncotarget.
REFERENCES
1. Didkowska J, Wojciechowska U, Manczuk M, Lobaszewski J. Lung cancer epidemiology: contemporary and future challenges worldwide. Ann Transl Med. 2016; 4: 150. doi: 10.21037/atm.2016.03.11.
2. Mitsudomi T. Molecular epidemiology of lung cancer and geographic variations with special reference to EGFR mutations. Transl Lung Cancer Res. 2014; 3: 205-11. doi: 10.3978/j.issn.2218-6751.2014.08.04.
3. Lv Y, Jin Y, Xu D, Yan Q, Liu G, Zhang H, Yuan D, Bao J. Assessment of 64-slice spiral computed tomography with perfusion weighted imaging in the early diagnosis of ground-glass opacity lung cancer. J BUON. 2016; 21: 954-7.
4. Detterbeck FC, Chansky K, Groome P, Bolejack V, Crowley J, Shemanski L, Kennedy C, Krasnik M, Peake M, Rami-Porta R, Staging I, Prognostic Factors Committee AB, Participating I. The IASLC Lung Cancer Staging Project: Methodology and Validation Used in the Development of Proposals for Revision of the Stage Classification of NSCLC in the Forthcoming (Eighth) Edition of the TNM Classification of Lung Cancer. J Thorac Oncol. 2016; 11: 1433-46. doi: 10.1016/j.jtho.2016.06.028.
5. Eberhardt WE, Mitchell A, Crowley J, Kondo H, Kim YT, Turrisi A 3rd, Goldstraw P, Rami-Porta R, International Association for Study of Lung Cancer S, Prognostic Factors Committee ABM, Participating I. The IASLC Lung Cancer Staging Project: Proposals for the Revision of the M Descriptors in the Forthcoming Eighth Edition of the TNM Classification of Lung Cancer. J Thorac Oncol. 2015; 10: 1515-22. doi: 10.1097/JTO.0000000000000673.
6. Nicholson AG, Chansky K, Crowley J, Beyruti R, Kubota K, Turrisi A, Eberhardt WE, van Meerbeeck J, Rami-Porta R, Staging and Prognostic Factors Committee; Advisory Boards, and Participating Institutions; Staging and Prognostic Factors Committee Advisory Boards and Participating Institutions. The International Association for the Study of Lung Cancer Lung Cancer Staging Project: Proposals for the Revision of the Clinical and Pathologic Staging of Small Cell Lung Cancer in the Forthcoming Eighth Edition of the TNM Classification for Lung Cancer. J Thorac Oncol. 2016; 11: 300-11. doi: 10.1016/j. jtho.2015.10.008.
7. Rami-Porta R, Bolejack V, Giroux DJ, Chansky K, Crowley J, Asamura H, Goldstraw P, International Association for the Study of Lung Cancer S, Prognostic Factors Committee ABM, Participating I. The IASLC lung cancer staging project: the new database to inform the eighth edition of the TNM classification of lung cancer. J Thorac Oncol. 2014; 9: 1618-24. doi: 10.1097/JTO.0000000000000334. 8. Nakaya N, Goto K, Saito-Nakaya K, Inagaki M, Otani
T, Akechi T, Nagai K, Hojo F, Uchitomi Y, Tsugane S, Nishiwaki Y. The lung cancer database project at the National Cancer Center, Japan: study design, corresponding rate and profiles of cohort. Jpn J Clin Oncol. 2006; 36: 280-4. doi: 10.1093/jjco/hyl015.
9. Rami-Porta R, Bolejack V, Crowley J, Ball D, Kim J, Lyons G, Rice T, Suzuki K, Thomas CF Jr, Travis WD,
Wu YL, Staging I, Prognostic Factors Committee AB, et al. The IASLC Lung Cancer Staging Project: Proposals for the Revisions of the T Descriptors in the Forthcoming Eighth Edition of the TNM Classification for Lung Cancer. J Thorac Oncol. 2015; 10: 990-1003. doi: 10.1097/ JTO.0000000000000559.
10. Kodama K, Higashiyama M, Okami J, Tokunaga T, Imamura F, Nakayama T, Inoue A, Kuriyama K. Oncologic Outcomes of Segmentectomy Versus Lobectomy for Clinical T1a N0 M0 Non-Small Cell Lung Cancer. Ann Thorac Surg. 2016; 101: 504-11. doi: 10.1016/j. athoracsur.2015.08.063.
11. Fernando HC, Landreneau RJ, Mandrekar SJ, Nichols FC, Hillman SL, Heron DE, Meyers BF, DiPetrillo TA, Jones DR, Starnes SL, Tan AD, Daly BD, Putnam JB Jr. Impact of brachytherapy on local recurrence rates after sublobar resection: results from ACOSOG Z4032 (Alliance), a phase III randomized trial for high-risk operable non-small-cell lung cancer. J Clin Oncol. 2014; 32: 2456-62. doi: 10.1200/ JCO.2013.53.4115.
12. Travis WD, Asamura H, Bankier AA, Beasley MB, Detterbeck F, Flieder DB, Goo JM, MacMahon H, Naidich D, Nicholson AG, Powell CA, Prokop M, Rami-Porta R, et al. The IASLC Lung Cancer Staging Project: Proposals for Coding T Categories for Subsolid Nodules and Assessment of Tumor Size in Part-Solid Tumors in the Forthcoming Eighth Edition of the TNM Classification of Lung Cancer. J Thorac Oncol. 2016; 11: 1204-23. doi: 10.1016/j. jtho.2016.03.025.
13. Postmus PE, Brambilla E, Chansky K, Crowley J, Goldstraw P, Patz EF Jr, Yokomise H, International Association for the Study of Lung Cancer International Staging C, Cancer R, Biostatistics, Observers to the C, Participating I. The IASLC Lung Cancer Staging Project: proposals for revision of the M descriptors in the forthcoming (seventh) edition of the TNM classification of lung cancer. J Thorac Oncol. 2007; 2: 686-93. doi: 10.1097/JTO.0b013e31811f4703. 14. Goldstraw P, Crowley J, Chansky K, Giroux DJ,
Groome PA, Rami-Porta R, Postmus PE, Rusch V, Sobin L, International Association for the Study of Lung Cancer International Staging C, Participating I. The IASLC Lung Cancer Staging Project: proposals for the revision of the TNM stage groupings in the forthcoming (seventh) edition of the TNM Classification of malignant tumours. J Thorac Oncol. 2007; 2: 706-14. doi: 10.1097/ JTO.0b013e31812f3c1a.


![Dimethyl (2Z) 2 [4 ((1Z) 1 {2 [(2Z,5Z) 5 (2 methoxy 2 oxoethylidene) 4 oxo 3 phenyl 1,3 thiazolidin 2 ylidene]hydrazin 1 ylidene}ethyl)anilino]but 2 enedioate](data:image/gif;base64,R0lGODlhAQABAIAAAP///wAAACH5BAEAAAAALAAAAAABAAEAAAICRAEAOw==)