Simplifying Data Access: The Energy Data Collection (EDC) Project
José Luis Ambite*, Yigal Arens*, Luis Gravano†, Vasileios Hatzivassiloglou†,Eduard Hovy*, Judith Klavans†, Andrew Philpot*, Usha Ramachandran*, Jay Sandhaus†, Anurag Singla†, and Brian Whitman†
* Digital Government Research Center † Digital Government Research Center Information Sciences Institute Department of Computer Science University of Southern California Columbia University
4676 Admiralty Way 535 West 114th Street, MC 1103 Marina del Rey, CA 90292-6695 New York, NY 10027
[email protected] [email protected]
Abstract
The massive amount of statistical and text data available from government agencies has created a set of daunting challenges to both research and analysis communities. These problems include heterogeneity, size, distribution, and control of terminology. At the Digital Government Research Center we are investigating solutions to these key problems. In this paper we focus on (1) ontological mappings for terminology standardization, (2) data integration across data bases with high speed query processing, and (3) interfaces for query input and presentation of results. This collaboration between researchers from Columbia University and the Information Sciences Institute of the University of Southern California employs technology developed at both locations, in particular the SENSUS ontology, the SIMS multi-database access planner, the LKB automated dictionary and terminology analysis system, and others. The pilot application targets gasoline data from the Bureau of Labor Statistics, the Energy Information Administration of the Department of Energy, the Census Bureau, and other government agencies.
1
Introduction: The Digital Government Research Center
As access to the web becomes a household commodity, the Government (and in particular Federal Agencies such as the Census Bureau, the Bureau of Labor Statistics, the Energy Information Administration, and others) has a mandate to make its information available to the public. But the massive amount of statistical and text data available from such agencies has created a set of daunting challenges to the research and analysis communities. These challenges stem from the heterogeneity, size, distribution, and disparity of terminology of the data. Equally, they stem from the need to provide broad and easy access to (and support proper understanding of) complex data.
The Digital Government Research Center (DGRC; www.dgrc.org) was established to address these problems. The DGRC consists of faculty, staff, and students at the Information Science Institute (ISI) of the University of Southern California and Columbia University’s Computer Science Department and its Center for Research on Information Access. The mandate of the DGRC is to conduct and support research in key areas of information systems, to develop standards/interfaces and infrastructure, build pilot systems, and collaborate closely with Government service/information providers and users.
2
The Energy Data Collection Project
2.1 BackgroundThe DGRC Energy Data Collection (EDC) Project was started in the National Science Foundation’s Digital Government program in 1999. We are working with representatives of Federal and State statistics agencies and other organizations to build a system for disseminating statistical data from the Census Bureau, the Bureau of Labor Statistics (BLS), the Energy Information Administration (EIA) of the Department of Energy (DoE), and the California Energy Commission (CEC). Example information appears at the EIA’s http://www.eia.doe.gov that provides extensive monthly energy data to the public. This site receives hundreds of thousands of hits a month, even though most of its information is available only as downloads of standard web (HTML) pages or as prepared PDF documents, and only for the last few years. The current facility thus supports only limited access to this very rich data source: it does not make visible the many definitions and footnotes that explain the complex nature of the data (whose changing definitions sometimes make incomparable figures appear to be comparable), and its query definition facility is too difficult for anyone but experts.
The EDC Project is addressing both problems. In the first year of research and development, we have demonstrated initial results in three areas:
Information Integration. We have addressed effective methods to identify and describe the contents of databases so that useful information can be accurately and efficiently located even when precise answers are unavailable. We have wrapped over a hundred sources for testing the first stage of information integration, performed research on computational properties of aggregation, and investigated the extraction of information from footnotes embedded in text. See Section 3.
Ontology Construction. We have extended USC/ISI’s 70,000-node terminology taxonomy SENSUS to incorporate new energy-related domain models, and have developed automated concept-to-ontology alignment algorithms. Term extraction from glossaries involves the automatic analysis of 7000 terms across agencies (EIA, Census SICS and NAICS codes, EPA) and the automatic handling of acronyms towards the creation of a cross-agency ontology. See Section 4.
User Interface Development. We have designed and implemented a completely new user interface with the capability of handling integrated querying and presentation of results. See Section 5.
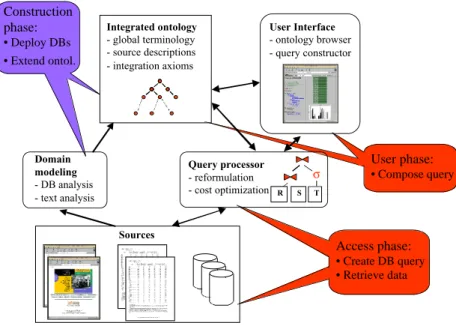
Figure 1. Architecture of EDC System
Access phase: • Create DB query • Retrieve data Domain modeling - DB analysis - text analysis Construction phase: • Deploy DBs • Extend ontol. Sources User phase: • Compose query Query processor - reformulation - cost optimization R S T σ Integrated ontology - global terminology - source descriptions - integration axioms User Interface - ontology browser - query constructor
2.2 EDC System Architecture.
In order to support homogeneous access to multiple databases, the EDC system involves three principal components: the database manager and access planner, the overarching ontology in which terms are defined and standardized, and the interface. The system architecture and the phases of the lifecycle of the system are shown in Figure 1. The ontology construction phase includes the work on semi-automated term alignment, term extraction from glossaries, and acronym handling (see Section 4). During the user phase, the interface facilitates the construction of queries by the user, which may involve ontology browsing and other interaction methods. The user interface dispatches a high-level query to the query processor, which, in turn, returns the results to the interface for appropriate display. If a query cannot be answered exactly from the available sources, the interface may engage the user in a query relaxation dialogue (see Section 3.3 for a kind of query relaxation). Finally, in the access phase the query planner consults the source descriptions in the ontology and transforms the high-level user query in an optimized query plan that accesses the relevant sources, retrieves and composes the requested information (see Section 3).
3
Information Capture and Integration
In this section we discuss the issues of source wrapping, domain modeling, the SIMS query access planner, aggregation queries, and the extraction of information from footnotes. We do not address the very important question of data uncertainly and error in this paper.
3.1 The SIMS Planner and Domain Models
The retrieval of information dispersed among multiple sources requires familiarity with their contents and structure, query languages and location. A person (or system) with need for distributed information must ultimately break down a retrieval task into a collection of specific queries to databases and other sources of information (e.g., analysis programs). With a large number of sources, individuals typically do not possess the knowledge or time required to determine how to find and process the information they need. Even if they did, performing the necessary tasks would be time consuming and prone to error.
Figure 2. Fragment of the Domain Model Point of Sale Time Series Week Month Year Period Quality CPI Price Volume Footnote Area USA CA NY Unit Measurement Value
Date Tag Text
G. Premium G. Premium Unleaded Gasoline G. Unleaded G. Leaded Product Subclass Part-of General Relation Source Mapping G. Regular PPI
Our approach to integrating statistical databases builds on research performed by the SIMS group at ISI (Arens et al., 1996). SIMS assumes that the system designer specifies a global model of the application domain and describes the contents of each source (database, web server, etc.) in terms of this global model. A SIMS mediator provides a single point of access for all the information: the user expresses queries without needing to know anything about the individual sources.
SIMS translates the user’s high-level request, expressed in a subset of SQL, into a query plan (Ambite and Knoblock, 2000), a series of operations including queries to sources of relevant data and manipulations of the data. Queries are expressed internally in the Loom knowledge representation language (MacGregor, 1990). The SQL subset is limited in its treatment of aggregation operators (such as sum, average, etc.). The problem is that distributing such operators over multiple databases is difficult and potentially inefficient. For example, finding the average of a distributed dataset is done fastest by retrieving only the average value and number of instances for each database and then calculating the global result—thereby minimizing transfer of data. However, if one of the DBMSs does not support averaging, all instances will have to be obtained from it and the averaging done at the integration site. Obviously, it is better not to obtain so much data unnecessarily. We discuss our approach for queries involving aggregation operators in Section 3.3.
3.2 Incorporating and Modeling New Data Sources
Since starting in 1999, we1 have incorporated over 100 tables, from sources in various formats, (including Oracle and Microsoft Access databases, HTML web forms and pages, and PDF files), collected from the Energy Information Administration, the Census Bureau, the Bureau of Labor Statistics, and the California Energy Commission.
A large amount of the information is in the form of semi-structured web pages. These web sources were ‘wrapped’ automatically using technology from the Ariadne system (Muslea et al., 1998). Ariadne allows a developer to mark up example web pages using a demonstration-based GUI. Then the system inductively learns a landmark grammar that is used to extract the marked-up fields from similar pages and generates all the necessary wrapper code. The resulting wrapper acts as a simple relational database that accepts parametrically-defined SQL and dynamically retrieves data from the associated web pages and forms.
In SIMS, each of these data sources, whether natively relational or wrapped by Ariadne, is modeled by associating it to an appropriate domain-level concept description. A set of approximately 500 domain terms, organized in 10 subhierarchies, constitutes the domain model so far required for the EDC domain. A fragment of the EDC domain model is shown in Figure 2. This model describes time series data about different gasoline products. A time series is defined by a set of dimensions such as product type (e.g., unleaded gasoline, premium gasoline), property measured (e.g., price, volume), area of the measure (e.g., USA, California), unit of measure, etc. Each of the time series in the sources is described by using specific values for each of the hierarchical dimensions. For example, a particular source may be described as providing the monthly prices (based on the consumer price index) of premium unleaded gasoline for the state of California. The dimensions can be seen as metadata that describes the series. The actual data is modeled as a set of measurements (i.e., date and value pairs). The domain model also describes whether a source has footnotes for some of the data. The answer to a query will also return the footnote data associated with the corresponding tuples if so requested.
These models have been linked into the overarching SENSUS ontology. Each of the retrievable time series, along with each of the ten dimensional values, has been added to SENSUS as an ontological concept in its own right; the relationships between series and dimensional values have been reified as SENSUS relations as well (e.g., has-product-type, area-of, etc.). In Section 4.1 we discuss how this linking was performed automatically. Using tools that facilitate the construction of wrappers and the
1
This work was performed by Andrew Philpot and José Luis Ambite, of USC/ISI, with the help of domain experts at EIA and BLS.
automatic description of sources is critical to scale mediator systems to the very large number of information sources that are available from government agencies in a cost-effective fashion.
3.3 Aggregation Queries
We2 have been investigating how to integrate data sets/sources with information aggregated at different ‘granularities’ and with different ‘coverage’. For example, a data source might have gasoline-price information for the whole United States reported by month for the last ten years; another source might have the same type of information for the whole United States reported by year up to 1990; finally, yet another source might have yearly gasoline-price information discriminated by state. The goal of our work is to conceptually present users with a reasonably uniform view of the available data without necessarily exposing all this heterogeneity in aggregation granularity and coverage.
The main challenge of our integration is dealing with data sets exhibiting varying granularity and coverage. In effect, data sets might have information at different granularities of time (e.g., month vs. year), of geography (e.g., cities vs. states vs. countries), of product (e.g., unleaded regular gasoline vs. ‘general’ gasoline), and so on. For example, data sets might have information with different coverage in terms of time (e.g., January 1978 through December 1986 vs. January 1978 through January 1989), geography (e.g., San Diego, CA vs. Boston, MA), product (e.g., leaded premium gasoline vs. leaded regular gasoline), and so on.
Numerous statistical techniques, ranging from imputation to sophisticated forms of averaging, have been developed to deal with data on mismatched scales. We develop a new approach as follows. We present users with a simple, unified view of the data. This view is sufficiently fine-grained to allow users to exploit most of the information that is available, but also sufficiently coarse-grained to hide most of the granularity and coverage differences of the data sets. Users pose queries against this view. Most of the time we will be able to correctly answer queries with the available data sets. But sometimes have to reformulate a query if the data needed to answer it is not available3. In such a case, we relax and reformulate the query to find the closest query for which we have all required data, and provide exact answers for that. Our key observation for such reformulation is that data attributes (e.g., time, geography, product) often follow natural granularity hierarchies (e.g., day->month->year for time, city->state->country for geography). Combining each of these granularity hierarchies results in a granularity lattice (Harinarayan et al., 1996) where a node might correspond to leaded gasoline data by month and state, and another node might correspond to leaded gasoline data by year and country, etc. We have developed algorithms to identify, for each of these nodes, the queries that we can answer exactly at the node’s level of granularity. For example, given a set of data sources, we might conclude that we can answer any query on leaded gasoline by month and state as long as the query is about the 1990–1999 time period, and about the states of California and New York. At run time, we can then decide whether we can answer a user query exactly as is, or whether we need to reformulate it and find the ‘closest’ query in the lattice for which we can provide exact answers, using some distance function over the granularity lattice. Initial results and algorithms are illustrated on four BLS data sets, all on average price of unleaded regular gasoline, at http://db-pc01.cs.columbia.edu/digigov/Main.html.
3.4 Automatic Footnote Extraction
Footnotes are an important piece of metadata that often accompanies statistical tables. Footnotes may qualify the data of the whole table, a particular column, or specific cells in a table. Defining general procedures for the extraction of footnotes and determining the scope of applicability of the footnotes is a very challenging problem when the statistical tables come from text or HTML documents, as is the case in much of the available government data. We4 have investigated automatically extracting footnotes and links
2
This work is led by Luis Gravano, an assistant professor at Columbia University, in collaboration with Vasilis Vassalos, an assistant professor at New York University, and Anurag Singla, a first-year Ph.D. student.
3 For example, this situation is possible if the unified view is not at the coarsest level of granularity of all data sets. Defining such a coarse view is undesirable because it might result in valuable data not being available for users to exploit.
4
This work was performed by Vasileios Hatzivassiloglou, from Columbia University, with the assistance of a graduate student, Jay Sandhaus. The footnote wrappers used in the pilot system were built by Andrew Philpot from USC/ISI.
between footnotes and text from web pages and tables, using finite-state analyzers that track the extent of each footnote and associate footnote symbols with footnote text.
4
Ontology Construction
In this section we discuss cross-agency terminology standardization using the SENSUS ontology. 4.1 The SENSUS Ontology
Practical experience has shown that integrating different termsets and data definitions is fraught with difficulty. The U.S. Government has funded several metadata initiatives with rather disappointing results. The focus has been on collecting structural information (formats, encodings, links), instead of content, resulting in large data collections (up to 500,000 terms) that are admirably neutral, but unsuitable as ‘terminology brokers’.
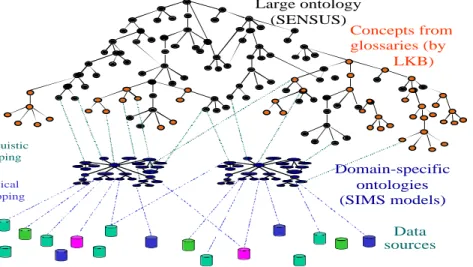
Figure 3. Ontology and Domain Models
We are following a different approach, one that has been tested, on a relatively small scale, in various applications in the past two years. Rather than mapping between domains or collecting metadata, we create mappings between the domain and an existing reference ontology. This choice allows us in the future to make available to statistics agencies (and eventually to the general public) any other domains that have also been mapped into the reference ontology. Furthermore, by making publicly available the reference ontology with our merging tools, we hope to encourage others to align (or even to merge) their termbanks, data dictionaries, etc., as well.
We are collecting, aligning, and merging the contents of several large termbanks, placing them under the high-level structure of an existing large (70,000-node) and fairly general ontology called SENSUS, built at USC/ISI (Knight and Luk, 1994). Its terms are linked together into a subsumption (is-a) network, with additional links for part-of, pertains-to, and so on. SENSUS is a rearrangement and extension of WordNet (Fellbaum, 1998) (built at Princeton University on general cognitive principles), retaxonomized under the Penman Upper Model (Bateman et al., 1989) (built at ISI to support natural language processing). For most of its content, SENSUS is identical to WordNet 1.5. SENSUS can be accessed using Ontosaurus, the ontology browser at http://mozart.isi.edu:8003/sensus/sensus_frame.html (Swartout et al., 1996).
The ontology for the EDC project has the structure shown in Figure 3. To deploy the version of SENSUS used for the EDC project, we5 (1) defined a domain model of approximately 500 nodes to represent the concepts present in the EDC gasoline domain (see Section 3.2), (2) linked these domain concepts into SENSUS using semi-automated alignment tools (see Section 4.2), and (5) defined a new type of ontology link called generally-associated-with to hold between concepts in the ontology and domain model concepts, allowing the user while browsing to rapidly proceed from high-level concepts to the concepts associated with real data in the databases.
5
This work was performed by José Luis Ambite, Eduard Hovy, and Andrew Philpot, of USC/ISI. Large ontology (SENSUS) Data sources Domain-specific ontologies (SIMS models) Logical mapping Linguistic mapping Concepts from glossaries (by LKB)
4.2 Semi-Automated Term-to-Ontology Alignment
In linking agency-specific domain models (as required by SIMS) to SENSUS (and hence to one another), the central problem is term alignment. Determining where a given term belongs in a 90,000-node ontology is a challenging problem. At first glance, it might seem impossible to align two ontologies (or taxonomized termsets) automatically. Almost all ontologies depend to a large degree on non-machine-interpretable information such as concept/term names and English term definitions. However, recent research has uncovered a variety of heuristics that help with the identification and alignment process. We6 are using a 5-step procedure that is partially automated:
1 heuristics that make initial cross-ontology alignment suggestions 2 a function for integrating their suggestions
3 a set of alignment validation criteria and heuristics 4 a repeated integration cycle
5 an evaluation metric
The full power of these techniques is still being explored, either linking words from foreign lexicons (Knight and Luk, 1994; Okumura and Hovy, 1994) or concepts from other ontologies (Ageno et al., 1994; Rigau and Agirre, 1995; Hovy, 1998). In the EDC project we have re-implemented two existing matching heuristics (NAME and DEFINITIONMATCH) and developed a new one (DISPERSAL MATCH). NAME MATCH performs an exhaustive (sub)string match of the concept name to be linked against every concept name in SENSUS, with special rewards for beginning and ending overlaps of substrings. Since this match is very slow, we have implemented an algorithm used to match gene sequences to obtain a two order of magnitude speedup. DEFINITION MATCH compares the overlap of words in the definition of the concept to be linked against the definitions of all SENSUS concepts, after appropriate demorphing and closed-class word removal. We have implemented a standard IR-based vector space matching algorithm for an efficient implementation.
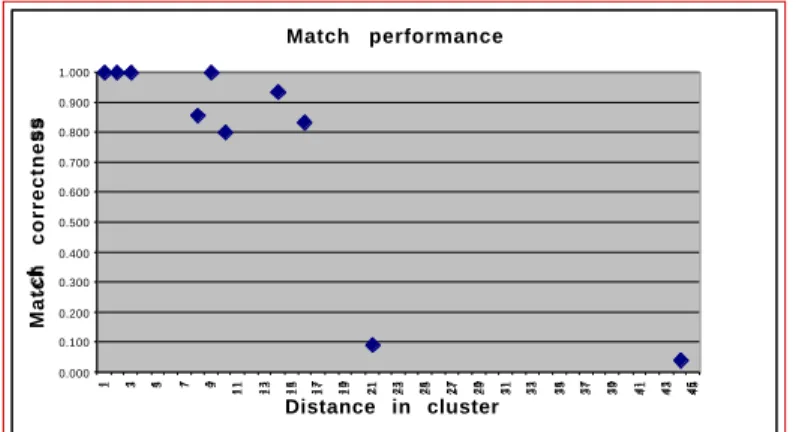
DISPERSAL MATCH, developed for this project (Hovy et al., 2000), is based on the expectation that a set of concepts to be linked, if they are semantically related, will tend to cluster together inside SENSUS, given that SENSUS concepts are also organized by semantic closeness. It turns out that this heuristic performs rather well. We have applied it to link the approximately 100 domain model concepts used for SIMS into SENSUS, organized into 10 subgroups, and are at the time of writing linking the approximately 7000 glossary items acquired from the EIA (see Section 4.3) as well. As is to be expected, the accuracy of linkage is correlated to the degree of dispersal of the target concepts within SENSUS. Figure 4 illustrates the accuracy for each of ten subgroups of domain concepts, measured against human alignment of the same concepts. The almost-perfect accuracy of 8 of the 10 subgroups provides cause for optimism.
Figure 4. Accuracy of alignment of 98 domain model concepts (organized in 10 groups) against SENSUS (90,000 concepts), using automated alignment heuristics.
6
This work was performed by Eduard Hovy of USC/ISI, with a graduate student, Usha Ramachandran. Refinements and recoding of the algorithms are being performed by Andrew Philpot of USC/ISI.
Match performance 0.000 0.100 0.200 0.300 0.400 0.500 0.600 0.700 0.800 0.900 1.000 1 3 5 7 9 11 13 15 17 19 21 23 25 27 29 31 33 35 37 39 41 43 45 Distance in cluster Match correctness
4.3 Definition Analysis: Extracting Glossary Entries with LKB
Several problems with terminology require that special attention be devoted to terms in a cross-agency endeavor. In particular, and especially confusing to non-specialist users, is the proliferation of terms, and the fact that agencies define ostensibly identical terms differently. What is called wages in one database may be what another calls salary (even though it may have a wages too, as well as an income). Reading the glossaries’ definitions may or may not be a help; lengthy term definitions often contain important information buried away.
The goal of the first year’s research7 on definition analysis was to identify a set of resources across agencies relevant to the domain of energy data, to develop tools to automatically parse these definition sets, regardless of their internal complexity, and to map them into a lexical knowledge base of uniform structure. From this representation, a mapping into SENSUS can be performed, at first semi-automatically with increasing levels of automation as each component is improved. The Columbia Automatic Lexical Knowledge Base (ALKB) system takes a definition source (web page or document) and creates a Lexical Knowledge Base automatically. An LKB is a structured form of a set of definitions, and can be used for ontology generation and definition analysis. This work is based on prior experience on dictionary analysis to create a knowledge base (Klavans, 1988), automatic phrase variation rules for mapping related terms (Klavans et al., 1997), the use of lexical resources to determine the range of ambiguity, verification in corpora to confirm ambiguity measures, and the use of linked phrases to eliminate potential ambiguity of single word terms.
ALKB uses a combination of rule-based and statistical methods. A part of speech tagger is applied to the definition, after which LinkIT, a noun-phrase chunker from Columbia University, is applied to determine linked noun phrases. At the same time, a bigram analysis is performed to find multi-word collocations. Next, various semantic attributes are tagged comprising two types: (1) predefined semantic attributes which are determined after an analysis of definition literature and a definition set. These include such attributes as “contains,” “used for,” “excludes,” “includes,” etc., and are arranged into three categories: properties, excludes/includes, and quantifiers. (2) automatically determined potential attributes: determined after running the bigram probability model across the entire document to find other attributes that might be useful in classifying the document. The assembled attributes are located in the definition currently being analyzed, and are shown to the user with the phrases surrounding them. (This helps the user note which attributes may need to be added.) Output from this analysis is used to build a fame-like representation of each glossary entry, for input into SENSUS.
In the first year, ALKB was used to analyze a total of nearly 8000 definitions from several sources, including the official EIA Gasoline Glossary, EIA’s larger glossary set, EPA’s Glossary of Selected Terms and Abbreviations; and about 35 relevant SIC and NAICS code metadata definitions and explanations from the Census Bureau. In addition, ALKB was run over the output of an automatic extraction of medical definitions from lay articles in the Digital Library II project at Columbia (Klavans and Muresan, 2000).
The ALKB web page shows the system: http://www.cs.columbia.edu/nlp/flkb/. We are currently working to ensure that ALKB output can be (more) automatically used as input to SENSUS, since there are still mapping issues due to the complexity of the data.
5
Acronym Analysis with Acrocat
The ALKB system uses the Acrocat acronym cataloguing system to try to determine the meaning of acronyms used in the document. A list of possibilities for each acronym in the current definition is listed with confidence markers. Acrocat was developed8 as a sub-routine of ALKB since agency-specific abbreviations and acronyms are frequent in definitions and thus often make these definitions uninterpretable outside a given agency or domain. We have built code for initial acronym resolution and are linking Acrocat with existing acronym and abbreviation glossaries in order to add guesses from these external resources.
7
This work was led by Judith Klavans at Columbia University, with a graduate student, Brian Whitman. 8
One of the most challenging problems in dealing with acronyms is to resolve ambiguity, since the determination of the expansion of an acronym is often domain-dependent (e.g., NFS could be Not For Sale in the art or auction worlds, but refers to Network File System in computer science). Currently, Acrocat’s demo page permits a user to enter source data directly, at http://www.cs.columbia.edu/nlp/acrocat/.
6
EDC Interface
It is currently extremely difficult for users to make productive use of the statistical data available on the web. Because of the sheer wealth of information, current systems typically offer two fundamentally different user interfaces to access it. One method attempts to trade off generality for ease of use by relying on a collection of ready-made presentations, consisting of tables and charts that have been designed in advance to answer typical questions. However, there may be hundreds of these presentations, making it difficult for users to find the one that provides the closest answer. At best, these systems provide a keyword searching mechanism to help users discover relevant presentations; in many cases, none of them may address the user’s specific query.
The other method for finding information achieves generality by allowing users to construct their own queries. However, these user interfaces are for experts only, requiring intimate knowledge of the domain and structure of the database, the meaning of the attributes, the query language, and the ways in which resulting information is presented.
To address the user interface issues, we9 are developing a unified web-based user interface for querying and presenting statistical information. Our focus in the first year of the project has been on the development of a robust, portable, and efficient user interface that facilitates user access to data from multiple sources/agencies. The interface addresses the following main tasks: support for adaptive, context-sensitive queries via a system of guided menus; display of tables created by the integration back-end from one or multiple individual databases, along with footnotes and links to original data sources; and browsing of the ontology that supports the entire integration model, with the capability to display concept attributes, relationships, and definitions in graphics and text. This method allows users to construct complete queries by choosing from a dynamically changing set of menu options, composed dynamically with reference to the domain models in SENSUS. The design is obviously extensible: as new databases are added to the system, their domain models are linked into SENSUS, and their parameters are immediately available to the user for querying. The taxonomization in SENSUS ensures appropriate grouping for menu display by the interface.
7
References
Ageno, A., I. Castellon, F. Ribas, G. Rigau, H. Rodriguez, A. Samiotou. 1994. TGE: Tlink Generation Environment.
Proceedings of the 15th COLING Conference. Kyoto, Japan.
Arens, Y., C.A. Knoblock and C.-N. Hsu. 1996. Query Processing in the SIMS Information Mediator. In A. Tate (ed),
Advanced Planning Technology. Menlo Park: AAAI Press.
Ambite J.L. and C.A. Knoblock. 2000. Flexible and Scalable Cost-Based Query Planning in Mediators: A Transformational Approach.. Artificial Intelligence Journal, 118 (1-2).
Bateman, J.A., Kasper, R.T., Moore, J.D., and Whitney, R.A. 1989. A General Organization of Knowledge for Natural Language Processing: The Penman Upper Model. Unpublished research report, USC/Information Sciences Institute, Marina del Rey, CA.
Fellbaum, C. 1998. (ed.) WordNet: An On-Line Lexical Database and Some of its Applications. Cambridge: MIT Press.
Harinarayan, V., A. Rajaraman, and J. D. Ullman, 1996. Implementing Data Cubes Efficiently, Proceedings of the1996
ACM SIGMOD Conference.
9
This work was performed by Vasileios Hatzivassiloglou of Columbia University, with a graduate student, Jay Sandhaus.
Hovy, E.H. 1998. Combining and Standardizing Large-Scale, Practical Ontologies for Machine Translation and Other Uses. Proceedings of the 1st International Conference on Language Resources and Evaluation (LREC). Granada, Spain.
Hovy, E.H., A. Philpot, J.-L. Ambite, and U. Ramachandran. 2000. Automating the Placement of Database Concepts into a Large Ontology. In preparation.
Klavans, J. L. 1988. COMPLEX: A Computational Lexicon for Natural Language Processing. Proceedings of Twelfth
International Conference on Computational Linguistics (COLING). Budapest, Hungary.
Klavans, J. L., C. Jacquemin and E. Tzoukermann. 1997. "A Natural language approach to multi-word term conflation". Proceedings of the DELOS conference from the European Research Consortium on Information Management (ERCIM). Zurich, Switzerland.
Klavans, J. L. and Muresan S. 2000 (in press). "DEFINDER: Rule-Based Methods for the Extraction of Medical Terminology and their Assocciated Definitions from On-line Text". Proceedings of 2000 American Medical
Informatics Association (AMIA) Annual Symposium, Los Angeles, California.
Knight, K. and S.K. Luk. 1994. Building a Large-Scale Knowledge Base for Machine Translation. Proceedings of the
AAAI Conference.
MacGregor, R. 1990. The Evolving Technology of Classification-Based Knowledge Representation Systems. In John Sowa (ed.), Principles of Semantic Networks: Explorations in the Representation of Knowledge. Morgan Kaufmann. Muslea, I. and S. Minton and C. A. Knoblock. 1998. Wrapper Induction for Semistructured Web-based Information
Sources. Proceedings of the Conference on Automated Learning and Discovery. Pittsburgh, PA.
Okumura, A. and E.H. Hovy. 1994. Ontology Concept Association using a Bilingual Dictionary. Proceedings of the
1st AMTA Conference. Columbia, MD.
Rigau, G. and E. Agirre. 1995. Disambiguating Bilingual Nominal Entries against WordNet. Proceedings of the 7th
ESSLI Symposium. Barcelona, Spain.
Swartout, W.R., R. Patil, K. Knight, and T. Russ. 1996. Toward Distributed Use of Large-Scale Ontologies.