Faulty Foundations:
State Structural Budget Problems and How to Fix Them
Iris J. Lav
Elizabeth McNichol
Robert Zahradnik
The Center on Budget and Policy Priorities, located in Washington, D.C., is a non-profit research and policy
institute that conducts research and analysis of government policies and the programs and public policy issues that affect low- and middle-income households. The Center is supported by foundations, individual contributions, and publications sales.
Board of Directors
May 2005
Center on Budget & Policy Priorities 820 First Street, N.E., Suite 510
Washington, DC 20002 (202) 408-1080 E-mail: [email protected]
Web: www.cbpp.org David de Ferranti, Chair
The World Bank John R. Kramer, Vice Chair Tulane Law School
Henry Aaron Brookings Institution
Kenneth Apfel University of Texas at Austin
Barbara B. Blum National Center for Children in Poverty Columbia University Marian Wright Edelman Children’s Defense Fund
James O. Gibson Center for the Study of
Social Policy Robert D. Reischauer Urban Institute Audrey Rowe AR Consulting Susan Sechler German Marshall Fund
Juan Sepulveda, Jr. The Common Enterprise/
San Antonio William Julius Wilson
Harvard University Beatrix A. Hamburg, M.D.
Cornell Medical College Frank Mankiewicz Hill and Knowlton Richard P. Nathan Nelson A. Rockefeller Institute of Government
Marion Pines Johns Hopkins University
Sol Price
The Price Company (Retired)
Robert Greenstein
ACKNOWLEDGEMENTS
This report draws on the work of all the staff of the State Fiscal Project of the Center on Budget and Policy Priorities. The authors wish to thank Center on Budget and Policy Priorities staff Joseph Llobrera for his work assembling much of the data in the tables that are the core of this report, Michael Mazerov for his work on the taxation of services under the sales tax, the corporate income tax and the taxation of interstate sales, David Bradley and Karen Lyons for their work on procedural barriers, and Nick Johnson for his work on state tax actions. The fact sheets that accompany the report are the result of excellent work by State Fiscal Project research assistant, Karen Lyons, and intern Jared Tank. This report would not have been possible without the careful work of Tina Marshall, who prepared this document for publication.
Our thanks also go to the Center’s communications team directed by Henry Griggs. We are especially grateful to John Springer for his excellent editing, to Michelle Bazie and Shannon Spillane for disseminating the report, and to Joshua Kaufman for formatting and posting the report on the Center’s website.
This report was made possible in part through the dedicated support of the Annie E. Casey Foundation, the Charles H. Revson Foundation, the Charles Stewart Mott Foundation, The Ford Foundation, The Joyce Foundation, the Open Society Institute, The Stoneman Family Foundation, and The Deercreek Foundation. We thank them for their support.
Table of Contents
Executive Summary ...1
The Service Economy ...9
State Corporate Tax Erosion ...16
The Growth of Interstate Sales ...24
The Impact of an Aging Population on State Revenues ...27
Revitalizing State Income Taxes ...34
The Growing Mismatch Between Tax Policy Choices and Spending Needs...37
Procedural Barriers to Structural Balance...46
Federal Tax Policies that Reduce State Revenues ...54
Putting it all Together: A Structural Deficit Scale...58
Conclusion ...64
Appendix 1. Literature Review...65
Appendix 2. Results of Selected State Structural Deficit Studies ...75
I. Executive
Summary
Many critical government services in this country rely on the ability of states and localities to raise sufficient revenues to provide them. Highways and public transportation, schools and universities, health care for children and elderly individuals, environmental protection, recreational facilities, and many more services depend on state and local funds, largely raised from taxes and fees.
Yet state revenues have an imperfect track record as a stable and reliable source of funding for services. Part of the problem is cyclical. State revenues decline when the economy experiences a downturn, and because most states are required to balance their budgets even during recessions, the decline in revenues often leads to cuts in public services. Also, while states sometimes raise taxes during downturns to reduce the severity of public service cuts, often they overcompensate for these tax increases after the economy recovers by cutting taxes below the level required to maintain services.
In addition to these cyclical issues, state revenues face a more enduring problem often called a structural deficit, or the chronic inability of state revenues to grow in tandem with
economic growth and the cost of government. States have structural deficits largely because they have failed to modernize their revenue systems to reflect far-reaching changes in the economy. Several states have changed their revenue systems little since the 1930s or 1940s; others have revenue systems that are twenty or thirty years out of date. While tax reform can be a difficult undertaking, failure to modernize state revenue systems can cause substantial
problems.
Structural deficits received significant attention from researchers and public finance practitioners in the early 1990s, and a number of states seemed poised to begin addressing the problem. But when the unusual economic boom of the mid-1990s began to swell state revenues, the need to fix structural deficits was soon forgotten.
The following are some of the main contributors to state structural deficits; the chapters of this report discuss each factor in greater detail. (See the appendix for a full review of the literature on the issue.)
• The U.S. economy’s shift from goods to services. The increasing importance
of the production and consumption of services has reduced the growth of state and local sales tax revenues, because in most states, sales taxes are levied largely on tangible goods and not on services. It also has constrained property tax revenue growth, because a service industry may have little property to tax compared to a comparably sized manufacturing industry.
• The erosion of state corporate taxes. Advances in transportation and
communication have allowed corporations to operate anywhere in the country or even the world. This has largely rendered obsolete the manner in which many states tax corporations, and has made it extremely difficult for states to identify profits that should be taxable. Moreover, corporations have exploited their increasing mobility by demanding special tax breaks from states and localities as a condition of maintaining or establishing a location in a particular community.
• The growth of interstate sales. The rapid growth of the Internet and of online
sales is beginning to reduce sales tax revenues significantly. Commerce over the Internet may also open up opportunities for avoiding state income taxes.
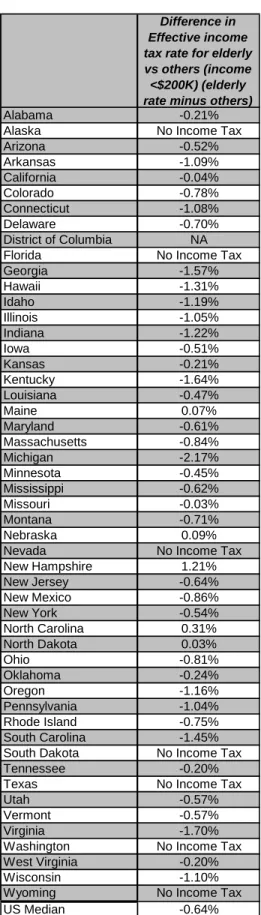
• The aging of the population. The baby boom generation will begin to turn 65 in
2011. Many states provide special income or property tax reductions based on age, often without regard to need; these tax breaks are likely to become
prohibitively expensive over the next two decades. In addition, elderly people spend less than younger people — especially on taxable goods such as furniture, clothes, cars, and gasoline — so state sales tax collections will erode as the population ages.
• The erosion of state income taxes. State income tax structures are much flatter
(that is, less progressive) than the federal income tax. They also have become flatter over time, as many states have failed to change their most basic tax laws in a half century or more. In addition, a number of states have reduced their top income tax rates, further reducing the growth of income tax collections relative to economic growth.
• States’ failure to maintain a mix of taxes that can grow with the cost of government. States face a number of spending pressures. Medicaid — which
makes up one-sixth of state budgets — and other health-related programs
continue to grow much faster than the general rate of inflation. As the baby-boom generation ages, states will face escalating costs for prescription drugs (even after the new Medicare drug benefit takes effect) and long-term care. Also, many states are facing public demands for improved education. Yet a number of states have jeopardized their ability to handle these spending pressures by making
themselves more dependent on revenues from slower-growing tax sources such as sales and excise taxes, while weakening the faster-growing taxes such as the income tax and failing to maintain the estate tax.
• States’ adoption of tax and expenditure limitations and supermajority requirements. A number of states have rigid requirements in their state and
local fiscal systems, such as constitutional restrictions on taxation and expenditures or supermajority requirements for increases in taxes. These restrictions make it difficult for policymakers to modernize tax codes and adjust to changing budgetary needs.
• Federal policies that harm state revenues. A number of federal laws prohibit
states from taxing certain activities. The Internet Tax Freedom Act, for example, prohibits states from taxing the fees consumers pay for Internet access. As the ways in which the Internet is used for communications grow, this prohibition will increasingly undermine states’ ability to modernize their tax systems. Moreover, the federal government has so far refused to address the problem of state sales taxation of electronic commerce, which it easily could do.
Structural Deficits
When a state has a structural deficit, its normal growth of revenues is insufficient to finance the normal growth of expenditures year after year. As a result the state faces gaps between estimated revenues and expenditures.1
The term “normal growth of expenditures” generally refers to the amount it would cost the state to continue providing the existing level of programs and services. (This is often called a continuation budget or a current services budget.) Even if no programs or services are improved, costs generally rise from year to year because inflation pushes up the costs of purchased goods and services, because states must provide their employees with reasonable increases in wages and benefits in order compete with the private sector, and because the populations that require services may be growing. In addition to normal growth in spending, states sometimes face increased costs over which they have little control, such as natural disasters and new federal mandates.
Certainly states need not continue every program and service they currently provide, and it is healthy for a state to review its budget and determine what programs or services no longer are needed. On the other hand, new circumstances frequently arise that require an increase in expenditures, such as the popular pressure throughout the country for smaller public school classes. On balance, then, the concept of “normal growth of expenditures” remains a useful gauge of how well a state can meet its obligations.
1 When a state faces a gap between estimated revenues and expenditures in any given budget year, the problem may
be the result of both a structural deficit and a revenue adequacy problem. This paper focuses on structural deficits. For a discussion of the differences between a structural deficit and a revenue adequacy problem see box on page 42.
The term “normal growth of revenues” means the revenue level that would occur in the absence of any changes in tax rates or in what is taxable. For taxes such as income taxes and sales taxes, this means the normal change in such revenues that occurs as a result of economic growth. For other taxes and revenue sources, such as cigarette taxes or lottery revenues, it may reflect changes in population or per-capita consumption.
No research has definitively determined how many states have structural deficits, but it generally is thought that most states do have this problem to some degree. Over the last ten years, three studies have examined the structural balance of each of the 50 states. These studies were prepared by Hal Hovey, a state policy expert consulting with the National Education Association; Don Boyd of the Rockefeller Institute of SUNY, Albany; and economists at Boston University and the Department of Commerce. Though these studies differed in their
assumptions, techniques, and results, all three found that more than two-thirds of the states face structural deficits.
Throughout this report, we identify ten factors that contribute to a state’s propensity to face structural budget problems. These factors are:
• The extent to which services are taxed under the sales tax • The strength of corporate income tax
• The amount of untaxed electronic commerce • The extent of tax preferences for the elderly
• The degree of progressivity of personal income tax • The growth of expenditure needs for residents • Tax policy choices that worsen structural gaps
• The presence of process barriers such as tax and spending limits
• The failure to delink from federal tax changes that reduce state revenues • The presence of structural gaps found by other studies
These factors are discussed in detail in the chapters of this report, along with discussions of policy responses.
The more of these issues that a state faces, the more likely it is that the state is currently experiencing — or is likely to experience — serious structural gaps in its budget. In order to assess the risk of structural problems faced by each state we developed a scale based on the measures discussed in this report.
Each state received points for the factors on this list that significantly affects its budget or tax system. (See Chapter 10 for a detailed description of the construction of this scale.) The overall results are summarized in Figure 1 below. Data for the District of Columbia are included in the tables throughout the report where it was available, but, the District does not appear in Figure 1 because information was not available on many of the measures used to compute the risk scores. No state received lower than a 3 on the scale, as all states have some structural problems in their fiscal systems. Over half the states (27 states) scored 7 or higher —
reflecting the many structural problems facing most states. The states most at risk for structural deficits are Alaska, Arkansas, Colorado, Florida, Nevada, New Mexico, Pennsylvania, South Carolina, Tennessee, Texas and Wyoming.
The scores assigned to states are intended to summarize the degree of risk a state faces for structural problems that result in a gap between the rate of growth of revenues and
expenditures. States also face gaps between revenues and expenditures that result from other factors such as the use of one-time measures to balance budgets or the use of temporary surpluses for permanent tax cuts or spending increases. As discussed in more detail in the box on page 42 the solutions to these problems differ from the solutions to the structural growth problems that are the focus of this paper.
A number of studies in specific states have also documented structural deficits. The results of several of these studies are summarized in Appendix 2. For example:
• A long-term projection of Kentucky’s spending and revenues by Professor
William Fox of the University of Tennessee found that the state faces a gap equal to 12.5 percent of its budget by 2007.
• The New Mexico Legislative Finance Committee projects a gap equal to 3.5
percent of the states’ budget by 2007.
State studies have found sizeable structural gaps even in states with a moderate number of risk factors.
10 or 9 8 7 6 5 4 or 3
Alaska Alabama Arizona Connecticut Kansas Minnesota
Arkansas Georgia California Delaware Louisiana Nebraska
Colorado Kentucky Hawaii Illinois Maine New Jersey
Florida Missouri Idaho Iowa Maryland North Dakota
Nevada Rhode Island Indiana Massachusetts New York Vermont
New Mexico South Dakota Michigan Montana Wisconsin
Pennsylvania Washington Mississippi New Hampshire
South Carolina Oklahoma North Carolina
Tennessee Virginia Ohio
Texas Oregon
Wyoming Utah
West Virginia
Most at Risk Least at Risk
Number of Factors Contributing to Structural Gap Figure 1
• As of February, 2005, New York State’s Division of the Budget projected that the
state’s budget would be out of balance by $5.8 billion (13 percent) by 2007 unless taxes are raised or spending is cut.
• A study of New Hampshire’s budget by the New Hampshire Center for Public
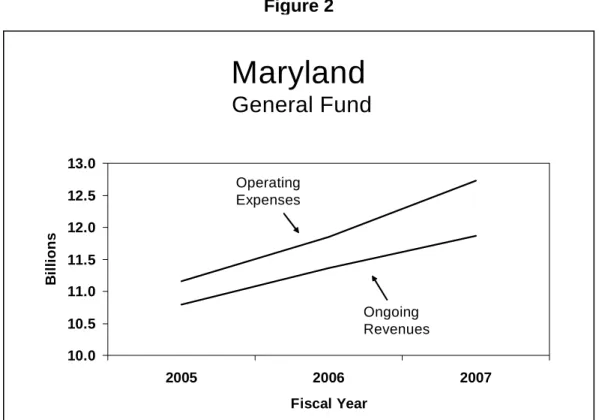
Policy Studies projects a gap equal to 8.0 percent of the state’s budget by 2007. Figure 2 which shows the results of a structural deficit study in Maryland demonstrates how structural problems result in a gap between revenues and spending that widens over time.
In many states, structural deficits generally remain hidden from public attention. States manage to cover them up in a variety of ways. Some states use periodic tax increases: the substantial erosion of the sales tax base over the past few decades, for example, has been offset by increases in the sales tax rate. Between 1970 and 2003, states raised sales tax rates 72 times and lowered them only a few times. In other states, structural deficits are masked by a gradual decline of programs and services, as program benefit levels and/or payments to service providers (such as day care centers or hospitals) erode over time.
Maryland
General Fund
10.0 10.5 11.0 11.5 12.0 12.5 13.0 2005 2006 2007 Fiscal Year B ill io ns Operating Expenses Ongoing RevenuesSource: Maryland Department of Legislative Services, Jan. 2005 Figure 2
Many of the ways that states cope with structural deficits tend to reduce public
confidence in government. When taxes must be increased simply to maintain current services rather than provide new ones, or when taxes remain constant but services deteriorate, the public may conclude that government is being wasteful. Thus, rather than take ad hoc measures to hide structural deficits, states would be much better off modernizing their tax systems so they
appropriately reflect economic and population growth.
There are a number of changes to state tax systems that can reduce structural gaps and improve fiscal stability. These options are summarized below and discussed in more detail in the report:
• Expanding the sales tax base to include more services. State sales tax bases
could be expanded to include more services in order to account for the shift in the U.S. economy from manufacturing to services.
• Closing corporate tax loopholes. States can adopt “combined reporting” under
which all related corporations that are operated as a single business enterprise are treated as one taxpayer for apportionment purposes thereby preventing the shifting of profits to low- or no-tax jurisdictions. In the absence of combined reporting, states could close a specific loophole that is common to most states that allows certain types of profit-shifting. States also could enact a rule to ensure that profits earned in a state in which a corporation may not be subject to an income tax are taxed instead by its home state. Finally, they could amend the definition of apportionable “business income” to include some types of income that now go untaxed.
• Streamlining sales tax provisions among states. Forty of the 45 states with a
sales tax have embarked on a project to simplify the design, administration, and compliance requirements of their sales tax. That would make it easier for companies to collect sales taxes on online purchases by out-of-state residents which should encourage Congress to pass legislation allowing states to require remote sellers to collect sales and use taxes. As of early 2005, twenty states had adopted legislation to implement the sales tax streamlining arrangement.
Additional states could adopt the arrangement and could work to persuade Congress to pass the legislation.
• Reducing or eliminating tax breaks based on age. States and local
governments cannot change some of the impacts that the aging of the population has on tax collections, but they can scale back or eliminate the age-related tax exemptions they enacted over the years in their property taxes and personal income taxes. One way these exemptions could be reduced is by replacing them with exemptions targeted by income as well as age.
• Updating state income taxes. States can periodically revisit and update their
income tax rates and brackets to avoid a flattening of the tax structure over time.
• Adopting a state value-added tax. A value-added tax with a low rate can be
used as a backstop to the corporate income tax; it would tax the business activity of companies that are not subject to the corporate income tax, as well as service companies whose products are not subject to the traditional sales tax. Such a tax could be designed in such a way that no company would have to pay both the corporate income tax and a value-added tax.
• Strengthening property taxes. States could improve the administration of the
property tax — that is, the process of identifying, locating, and valuing taxable property as well as levying the tax. Also, states could carefully examine the types of property that are exempted from the tax with an eye to eliminating some exemptions.
• Resisting new tax and spending limits or modifying existing ones. States that
do not have tax and spending limits, super-majority requirements, or property tax limits in place should avoid these measures, which act as barriers to addressing structural deficits. States already subject to such limits could consider modifying them to allow policymakers more flexibility to adapt to changing conditions.
• Adopting state laws to increase sales tax collections on remote sales. Without
waiting for Congressional action, states can proceed on their own to address the problem of taxation of sales through the Internet and catalogs. States can expand their definition of when a company has presence in their state, require that the state do business only with companies that collect sales tax on purchases from state residents, and collect the tax on these purchases directly from consumers through the income tax.
• Improving budget transparency. State policymakers need longer-term
projections of current services spending and revenues to help them understand the implications of their decisions for the state’s structural balance. This information is also critical to building support for policies that will improve the state’s fiscal stability over the long term.
• Other ideas. Additional ways to bolster state revenue growth include greater
interstate cooperation in business taxation and other areas, preventing federal preemption of state and local taxes, and pursuing federal restrictions on the use of state and local tax preferences for interstate competition.
No single policy will work in every state, of course, and many of the options considered here will not be easy to implement. Yet states’ future growth and the well-being of their
residents depend on the ability of state policymakers to ensure that their tax and budget decisions enhance the state’s long-term fiscal stability.
II.
The Service Economy
There is little question that production and consumption in the U.S. economy have been shifting from goods to services. Consumption of services has risen from 44 percent of total consumption in 1969 to 59 percent in 2004. Over the same period, consumption of nondurable goods (like clothing and light bulbs) has declined from 42 percent to 29 percent of consumption, and consumption of durable goods (like cars and computers) has declined slightly.2
This shift has major implications for state and local taxes. The most striking effect is on sales tax revenues, but property tax collections are also affected.
Despite this shift, only a few states impose sales taxes on a broad array of services; sales of goods generate the vast majority of state sales tax receipts. According to the Federation of Tax Administrators, an association of state revenue department officials, most states apply their sales tax to less than one-third of the potentially taxable service categories, and eight states apply their sales tax to less than one-eighth of those categories.
States’ failure to tax services, as well as their propensity to create other types of sales tax exemptions, is likely the biggest reason why sales tax revenues have not kept pace with
economic growth. The sale tax base — that is, the amount of goods and services that are subject to tax each year — has fallen from about 51.4 percent of personal income (a standard measure of the economy) in the average state in 1979 to 41.5 percent in 2001.3 This reduction has occurred even though total personal consumption expenditures have risen as a share of personal income from 77 percent in 1979 to 81 percent in 2001.
As sales tax bases have declined, states have raised sales tax rates in order to continue
generating adequate revenue from a declining base. In 1970, the average sales tax rate was 3.5
2 U.S. Department of Commerce, Bureau of Economic Analysis. http://www.bea.gov/bea/dn/nipaweb/TableView.asp#Mid
3 William F. Fox, “Three Characteristics of Tax Structures Have Contributed to the Current State Fiscal Crisis,”
percent; in 2003, it was 5.2 percent, an increase of 49 percent. Yet because of the shrinking sales tax base, this 49 percent increase in sales tax rates produced only a 20 percent gain in sales tax revenues as a share of personal income.
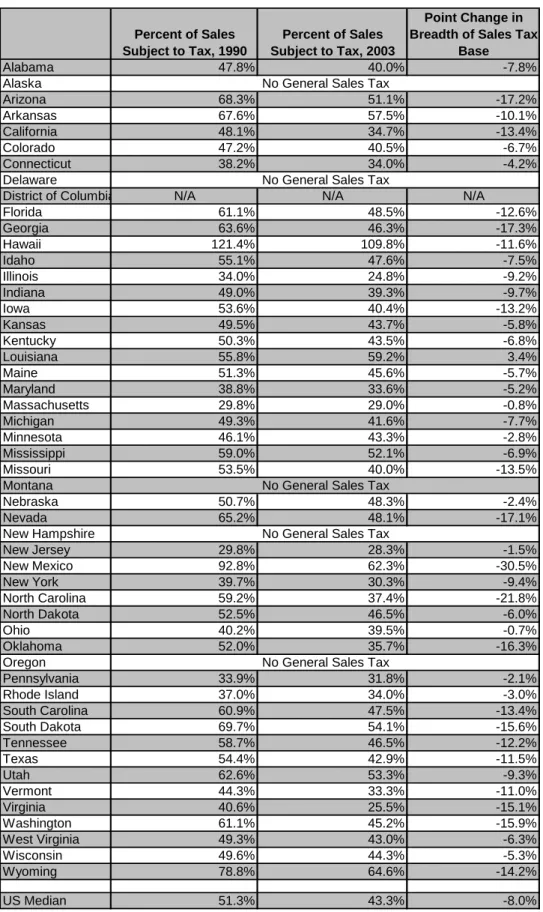
The research of John Mikesell of Indiana University, shown in Table 1 illustrates the
erosion of the sales tax base over time. In 1990, just over half of all sales were subject to the sales tax in the median state. By 2003, 43.3 percent were. In nine states — Arizona, Georgia, Nevada, New Mexico, North Carolina, Oklahoma, South Dakota, Virginia and Washington — the sales tax base declined by more than 15 percentage points. It should be noted, however, that the breadth of the sales tax base remained well above average in two of these states — New Mexico and South Dakota — despite this decline.
Why Tax Services?
For decades, public finance economists and other tax experts have been urging states to include more services in the sales tax base. Such a step meets all of the criteria by which state tax policy options are normally evaluated.
• It can generate substantial new revenue.Table 2 indicates that a 5 percent tax
on all services purchased by households except health care, education, housing, and a few others would yield roughly $57 billion each year. The new revenue from taxing household services would be less than this, since most states do tax services to some extent. The estimates shown in Table 2 do suggest, however, that states that do not tax services to any significant degree at present — such as California, Illinois, Michigan, and Virginia — probably could increase their sales tax revenue by 25 to 30 percent if they taxed a wide range of services.
• It may reduce the year-to-year volatility of sales tax collections. Sales tax
bases are dominated by purchases of “big-ticket” durable goods such as cars, appliances, and furniture; such purchases often decline sharply during economic downturns. Expanding the base to include more services could moderate slightly the volatility of sales tax revenues over the course of the business cycle.
• It would make the sales tax fairer. Since the sales tax is intended to be a
general tax on consumption, there is little reason to tax the consumption of goods and not tax the consumption of services, which in fact can be substitutes for one another. For example, it is not equitable — it violates the principle of “horizontal equity” — to tax the person who buys a lawnmower but not the person who hires a lawn care service.
Sales taxes are regressive; that is, they absorb a larger proportion of the income of lower-income taxpayers than of higher-income taxpayers. Therefore, expanding the sales tax to services could make a state’s overall tax system somewhat less equitable if it lowers the proportion of state revenue that is derived from more progressive revenue sources, such as personal and corporate income taxes. States
Table 1: Sales Tax Base is Declining Percent of Sales Subject to Tax, 1990 Percent of Sales Subject to Tax, 2003 Point Change in Breadth of Sales Tax
Base Alabama 47.8% 40.0% -7.8% Alaska Arizona 68.3% 51.1% -17.2% Arkansas 67.6% 57.5% -10.1% California 48.1% 34.7% -13.4% Colorado 47.2% 40.5% -6.7% Connecticut 38.2% 34.0% -4.2% Delaware
District of Columbia N/A N/A N/A
Florida 61.1% 48.5% -12.6% Georgia 63.6% 46.3% -17.3% Hawaii 121.4% 109.8% -11.6% Idaho 55.1% 47.6% -7.5% Illinois 34.0% 24.8% -9.2% Indiana 49.0% 39.3% -9.7% Iowa 53.6% 40.4% -13.2% Kansas 49.5% 43.7% -5.8% Kentucky 50.3% 43.5% -6.8% Louisiana 55.8% 59.2% 3.4% Maine 51.3% 45.6% -5.7% Maryland 38.8% 33.6% -5.2% Massachusetts 29.8% 29.0% -0.8% Michigan 49.3% 41.6% -7.7% Minnesota 46.1% 43.3% -2.8% Mississippi 59.0% 52.1% -6.9% Missouri 53.5% 40.0% -13.5% Montana Nebraska 50.7% 48.3% -2.4% Nevada 65.2% 48.1% -17.1% New Hampshire New Jersey 29.8% 28.3% -1.5% New Mexico 92.8% 62.3% -30.5% New York 39.7% 30.3% -9.4% North Carolina 59.2% 37.4% -21.8% North Dakota 52.5% 46.5% -6.0% Ohio 40.2% 39.5% -0.7% Oklahoma 52.0% 35.7% -16.3% Oregon Pennsylvania 33.9% 31.8% -2.1% Rhode Island 37.0% 34.0% -3.0% South Carolina 60.9% 47.5% -13.4% South Dakota 69.7% 54.1% -15.6% Tennessee 58.7% 46.5% -12.2% Texas 54.4% 42.9% -11.5% Utah 62.6% 53.3% -9.3% Vermont 44.3% 33.3% -11.0% Virginia 40.6% 25.5% -15.1% Washington 61.1% 45.2% -15.9% West Virginia 49.3% 43.0% -6.3% Wisconsin 49.6% 44.3% -5.3% Wyoming 78.8% 64.6% -14.2% US Median 51.3% 43.3% -8.0% Data Source:
John L. Mikesell, "State Retail Sales Taxes, 1999-2001: The Recession Hits," State Tax Notes, February 10, 2003; John L. Mikesell, "State Retail Sales Tax Burdens, Reliance, and Breadth," State Tax Notes, July 12, 2004.
No General Sales Tax No General Sales Tax
No General Sales Tax
No General Sales Tax
Table 2: Estimated Sales Tax Revenue Yield from Taxing All “Readily-Taxable” Services ($millions)
Note: Readily taxable services refer to all services purchased by households except health care, education, housing and a few others.
Share of 2001 National Personal Income Estimated Purchases of "Readily-taxable" Services July 1 2001 Sales Tax Rate Revenue from Taxing Services FY 01 State General Sales Tax Revenue Revenue from Services as Percent of Current Revenue United States 100.00% 1,148,000 5.000% 57,400 184,315 31.1% Alabama 1.26% 14,521 4.000% 581 1,823 31.9% Alaska 0.23% 2,598 0.000% 0 0 0.0% Arizona 1.58% 18,164 5.600% 1,017 3,757 27.1% Arkansas 0.71% 8,150 5.125% 418 1,772 23.6% California 13.00% 149,251 5.750% 8,582 24,298 35.3% Colorado 1.70% 19,560 2.900% 567 1,970 28.8% Connecticut 1.67% 19,226 6.000% 1,154 3,475 33.2% Delaware 0.30% 3,420 0.000% 0 0 0.0% Dist. of Columbia 0.26% 3,037 5.750% 175 682 25.6% Florida 5.47% 62,786 6.000% 3,767 14,862 25.3% Georgia 2.78% 31,867 4.000% 1,275 4,874 26.2% Hawaii 0.41% 4,697 4.000% 188 1,560 12.0% Idaho 0.37% 4,303 5.000% 215 782 27.5% Illinois 4.75% 54,528 6.250% 3,408 6,565 51.9% Indiana 1.96% 22,473 5.000% 1,124 3,606 31.2% Iowa 0.92% 10,569 5.000% 528 1,756 30.1% Kansas 0.89% 10,182 4.900% 499 1,745 28.6% Kentucky 1.17% 13,404 6.000% 804 2,656 30.3% Louisiana 1.26% 14,493 4.000% 580 2,665 21.8% Maine 0.40% 4,548 5.000% 227 818 27.8% Maryland 2.18% 25,021 5.000% 1,251 3,326 37.6% Massachusetts 2.86% 32,833 5.000% 1,642 3,756 43.7% Michigan 3.43% 39,369 6.000% 2,362 7,686 30.7% Minnesota 1.90% 21,773 6.500% 1,415 4,768 29.7% Mississippi 0.72% 8,223 7.000% 576 2,330 24.7% Missouri 1.83% 21,021 4.225% 888 2,805 31.7% Montana 0.25% 2,867 0.000% 0 0 0.0% Nebraska 0.57% 6,547 5.000% 327 1,017 32.2% Nevada 0.73% 8,329 6.500% 541 2,049 26.4% New Hampshire 0.50% 5,686 0.000% 0 0 0.0% New Jersey 3.76% 43,220 6.000% 2,593 5,759 45.0% New Mexico 0.49% 5,603 5.000% 280 1,731 16.2% New York 7.89% 90,585 4.000% 3,623 8,449 42.9% North Carolina 2.60% 29,795 4.000% 1,192 3,430 34.7% North Dakota 0.19% 2,174 5.000% 109 403 27.0% Ohio 3.78% 43,356 5.000% 2,168 6,288 34.5% Oklahoma 1.00% 11,476 4.500% 516 1,550 33.3% Oregon 1.13% 12,939 0.000% 0 0 0.0% Pennsylvania 4.35% 49,932 6.000% 2,996 7,238 41.4% Rhode Island 0.37% 4,233 7.000% 296 699 42.4% South Carolina 1.17% 13,375 5.000% 669 2,507 26.7% South Dakota 0.23% 2,669 4.000% 107 464 23.0% Tennessee 1.79% 20,492 6.000% 1,230 4,483 27.4% Texas 7.02% 80,626 6.250% 5,039 17,903 28.1% Utah 0.63% 7,260 4.750% 345 1,480 23.3% Vermont 0.20% 2,319 5.000% 116 356 32.6% Virginia 2.69% 30,836 3.500% 1,079 2,992 36.1% Washington 2.21% 25,367 6.500% 1,649 6,078 27.1% West Virginia 0.48% 5,454 6.000% 327 1,086 30.1% Wisconsin 1.82% 20,916 5.000% 1,046 3,613 28.9% Wyoming 0.17% 1,924 4.000% 77 406 19.0%
Data Source: Center on Budget and Policy Priorities
Table 2: Estimated Sales Tax Revenue Yield from Taxing All “Readily-Taxable” Services ($millions)
Note: Readily taxable services refer to all services purchased by households except health care, education, housing and a few others.
Share of 2001 National Personal Income Estimated Purchases of "Readily-taxable" Services July 1 2001 Sales Tax Rate Revenue from Taxing Services FY 01 State General Sales Tax Revenue Revenue from Services as Percent of Current Revenue United States 100.00% 1,148,000 5.000% 57,400 184,315 31.1% Alabama 1.26% 14,521 4.000% 581 1,823 31.9% Alaska 0.23% 2,598 0.000% 0 0 0.0% Arizona 1.58% 18,164 5.600% 1,017 3,757 27.1% Arkansas 0.71% 8,150 5.125% 418 1,772 23.6% California 13.00% 149,251 5.750% 8,582 24,298 35.3% Colorado 1.70% 19,560 2.900% 567 1,970 28.8% Connecticut 1.67% 19,226 6.000% 1,154 3,475 33.2% Delaware 0.30% 3,420 0.000% 0 0 0.0% Dist. of Columbia 0.26% 3,037 5.750% 175 682 25.6% Florida 5.47% 62,786 6.000% 3,767 14,862 25.3% Georgia 2.78% 31,867 4.000% 1,275 4,874 26.2% Hawaii 0.41% 4,697 4.000% 188 1,560 12.0% Idaho 0.37% 4,303 5.000% 215 782 27.5% Illinois 4.75% 54,528 6.250% 3,408 6,565 51.9% Indiana 1.96% 22,473 5.000% 1,124 3,606 31.2% Iowa 0.92% 10,569 5.000% 528 1,756 30.1% Kansas 0.89% 10,182 4.900% 499 1,745 28.6% Kentucky 1.17% 13,404 6.000% 804 2,656 30.3% Louisiana 1.26% 14,493 4.000% 580 2,665 21.8% Maine 0.40% 4,548 5.000% 227 818 27.8% Maryland 2.18% 25,021 5.000% 1,251 3,326 37.6% Massachusetts 2.86% 32,833 5.000% 1,642 3,756 43.7% Michigan 3.43% 39,369 6.000% 2,362 7,686 30.7% Minnesota 1.90% 21,773 6.500% 1,415 4,768 29.7% Mississippi 0.72% 8,223 7.000% 576 2,330 24.7% Missouri 1.83% 21,021 4.225% 888 2,805 31.7% Montana 0.25% 2,867 0.000% 0 0 0.0% Nebraska 0.57% 6,547 5.000% 327 1,017 32.2% Nevada 0.73% 8,329 6.500% 541 2,049 26.4% New Hampshire 0.50% 5,686 0.000% 0 0 0.0% New Jersey 3.76% 43,220 6.000% 2,593 5,759 45.0% New Mexico 0.49% 5,603 5.000% 280 1,731 16.2% New York 7.89% 90,585 4.000% 3,623 8,449 42.9% North Carolina 2.60% 29,795 4.000% 1,192 3,430 34.7% North Dakota 0.19% 2,174 5.000% 109 403 27.0% Ohio 3.78% 43,356 5.000% 2,168 6,288 34.5% Oklahoma 1.00% 11,476 4.500% 516 1,550 33.3% Oregon 1.13% 12,939 0.000% 0 0 0.0% Pennsylvania 4.35% 49,932 6.000% 2,996 7,238 41.4% Rhode Island 0.37% 4,233 7.000% 296 699 42.4% South Carolina 1.17% 13,375 5.000% 669 2,507 26.7% South Dakota 0.23% 2,669 4.000% 107 464 23.0% Tennessee 1.79% 20,492 6.000% 1,230 4,483 27.4% Texas 7.02% 80,626 6.250% 5,039 17,903 28.1% Utah 0.63% 7,260 4.750% 345 1,480 23.3% Vermont 0.20% 2,319 5.000% 116 356 32.6% Virginia 2.69% 30,836 3.500% 1,079 2,992 36.1% Washington 2.21% 25,367 6.500% 1,649 6,078 27.1% West Virginia 0.48% 5,454 6.000% 327 1,086 30.1% Wisconsin 1.82% 20,916 5.000% 1,046 3,613 28.9% Wyoming 0.17% 1,924 4.000% 77 406 19.0%
could avert this outcome by balancing the sales tax expansion with other changes, such as lowering the sales tax rate, cutting the personal income tax, or
establishing low-income tax credits.
• It can improve the allocation of economic resources. Taxing most goods but
not most services subtly distorts resource allocation throughout the economy by creating an artificial incentive to purchase services rather than goods.
Policy Responses – Sales Tax
If policymakers do decide to expand the services subject to taxation, when they contemplate which services to tax, it could be useful to think of services as falling into three categories: those primarily purchased by businesses (such as payroll processing and television advertising), those primarily purchased by households (such as diaper service and cable TV), and those purchased by both groups (such as landscaping and pest control).
Economists generally counsel states to avoid taxing the first category, so-called
“business-to-business” sales. They point out that taxing the goods and services that businesses buy in order to produce other goods and services often leads to “tax pyramiding,” where an input is taxed when purchased and then effectively taxed again when the good or service it was used to make is sold.
Taxation of business inputs also tends to complicate sales tax administration. For example, rules need to be developed for taxing services that businesses purchase for company-wide use in multiple states, such as accounting.
But economists’ greatest concern about taxing these services is that it can distort the allocation of economic resources by favoring businesses that have their own, in-house sources of services (such as legal services or accounting) over businesses that purchase these services from other firms.
These arguments against taxing business purchases of services have merit. However, there are at least two countervailing considerations.
First, state sales taxes already apply to numerous goods that businesses purchase. If the concern that taxing business inputs can distort resource allocation is valid, economic theory suggests that the distortion grows as the tax rate increases. Thus, if the choice is between increasing the tax rate at which business-to-business sales of goods are taxed and taxing some business-to-business sales of services in order to hold down the tax rate, the latter could be preferable.
Second, since a growing number of people run their own businesses, exempting all business purchases of services would open the door to substantial tax evasion by providing an incentive for business owners to claim that the services they purchase are for business purposes when they are actually intended for personal use.
States that have broadened their taxation of services generally have struck what arguably is a reasonable balance among these various considerations by largely avoiding taxing services purchased almost exclusively by businesses (like advertising and accounting) and instead targeting household services (like haircuts) or mixed household/business services (like landscaping).
The average state with a sales tax exempts a little more than half of the possible household services from the sales tax. (See Table 3.) Nine states — California, Colorado,
Illinois, Maine, Massachusetts, Michigan, Nevada, Rhode Island, and Virginia — tax fewer than an eighth of possible household services.
Property Tax Collections in a Service Economy
Producing services takes less real property and less personal property than producing goods does. Local governments are finding it difficult to value the intangible assets that have become increasingly important to businesses, such as patents, databases, software, trademarks, and formulas. Therefore, the shift to a service economy keeps property taxes from businesses from growing as fast as they would otherwise.
Policy Responses – Property Tax
To help them assess businesses and their assets more accurately and comprehensively, some states have increased training for assessors or centralized assessment at the county or state level. Beyond improving assessments, there is little that states can do to mitigate the loss of property tax revenues that accompanies the shift to a service economy. States should, however, be aware of the issue and monitor whether there are particular communities in the state in which the property tax base has shrunk for this reason. States can help such communities through school funding formulas or other equalization aid.
Table 3: Taxation of Selected Household Services
Number of Household Services Taxed (out of 40)
Alabama 9
Alaska No General Sales Tax
Arizona 18
Arkansas 22
California 2
Colorado 2
Connecticut 25
Delaware No General Sales Tax District of Columbia 18 Florida 22 Georgia 11 Hawaii 39 Idaho 10 Illinois 3 Indiana 6 Iowa 34 Kansas 27 Kentucky 6 Louisiana 20 Maine 2 Maryland 8 Massachusetts 0 Michigan 4 Minnesota 24 Mississippi 21 Missouri 11
Montana No General Sales Tax
Nebraska 20
Nevada 2
New Hampshire No General Sales Tax
New Jersey 17 New Mexico 39 New York 23 North Carolina 10 North Dakota 9 Ohio 17 Oklahoma 10
Oregon No General Sales Tax
Pennsylvania 15 Rhode Island 1 South Carolina 12 South Dakota 40 Tennessee 27 Texas 24 Utah 22 Vermont 10 Virginia 4 Washington 21 West Virginia 37 Wisconsin 29 Wyoming 21 US Average 16 Less than 5 9 Less than 10 14 Data Source:
Federation of Tax Administration. Sales Taxation of Services: 1996 Update,
Research Report No. 147 (Washington, DC: Federation of Tax Administrators), April 1997. Partially updated for known changes. See report for extensive footnotes that affect classification as taxable or exempt. Available at www.taxadmin.org/fta/pub/sevices/services.html.
III.
State Corporate Tax Erosion
In this day and age, interstate business transactions are commonplace. Credit card payments are often sent to a bank in another state. Catalog and Internet purchases from out-of-state businesses have grown substantially over time. Businesses often have locations in more than one state, the local department store is likely to be a part of a national conglomerate, and locally owned restaurants are being replaced by national chains.
The volume of international business is growing as well. In 1970, imports equaled 5.5 percent of gross domestic product and exports made up just 5.6 percent. By 2000, those figures had grown to 14.0 percent for imports and 9.5 percent for exports.4 United States corporations with more than 50 percent foreign ownership comprised just 1.3 percent of U.S. corporate assets in 1971; in 2000, their share was ten times larger (12.9 percent).5
The expansion of interstate and international business presents enormous challenges to state tax systems. A number of these challenges were discussed in Financing State Government in the 1990s.
• Many states have failed to update their laws regarding which share of a
multi-state corporation’s income should be taxable in any given multi-state to take account of the increasingly complex nature of corporate structures. As a result, corporations have been able to legally shift income from one state to another to avoid taxation. States’ failure to coordinate their tax systems and tax administration with one another has made it easier for corporations to shift income and thereby avoid taxation as well.
• State tax collections also suffer when multi-national corporations shift operations
or income out of the United States to other countries in order to reduce federal taxes.
4 U.S. National Income and Product Accounts, U.S. Department of Commerce, Bureau of Economic Analysis. 5 James R. Hobbs, “Foreign-Controlled Domestic Corporations - 2000”, SOI Bulletin, Summer 2003. October 2003.
• The federal government has often worsened states’ problems in this area through
actions it has (or has not) taken. Federal rules that tell states what businesses and sales they may tax have been extended to the point where they seriously constrain states’ ability to tax interstate businesses and transactions.
For example, the Supreme Court has restricted states’ ability to apply sales taxes to mail-order sales made to state residents. In addition, a federal law and
subsequent legal decisions have restricted states’ ability to impose corporate income taxes on many out-of-state corporations doing business in the state. Corporations’ growing
sophistication in exploiting the flaws in state corporate income tax laws has undoubtedly contributed to the tax’s declining significance over the past two decades. According to the U.S. Census Bureau, corporate income taxes supplied 10.2 percent of state tax revenue in the states levying them in 1979, but just 6.3 percent in 2000.6 The erosion of state corporate income taxes can also be seen in the decline in the effective state corporate income tax rate, or the percentage of corporate profits that is actually paid in taxes (as opposed to the tax rate that is nominally imposed). The effective
corporate tax rate is measured by dividing actual corporate tax collections by an estimate of corporate profits. The top nominal state corporate tax rates are generally in the range of 6-10
percent; only five of the 45 states imposing corporate taxes (including the District of Columbia) have top nominal rates of less than 6 percent. A recent report by the Congressional Research Service estimated, however, that the average effective state corporate income tax rate declined
from an average of 6.9 percent in the 1980s to 4.6 percent in 1998. The rate then rose as corporate profits soared in the late 1990s but has been declining again and equaled 4.99 percent in 2002, the most recent year available.7 A report by Professor William Fox of the University of Tennessee, which found that the decline in effective corporation tax rates occurred despite an increase in the average nominal rate of .1 percent, demonstrates that it was the result of a narrowing of the base rather than the result of rate reduction. (See Figure 3.)
6 These are averages for the states levying corporate income taxes in both years. These two years were selected to
illustrate the long-term trend because they both represent the same point in the business cycle, specifically, the year before the U.S. economy slipped into a recession.
7 Steve Maguire,
Average Effective Corporate Tax Rates, Congressional Research Service, September 2003. This
study examines the effective corporate income tax rate of state and local governments combined. The only local corporate income taxes of economic significance are those imposed by New York City and the District of Columbia.
3.0% 4.0% 5.0% 6.0% 7.0% 8.0% 9.0% 1979 198 1 198 3 198 5 1987 1989 1991 1993 1995 1997 199 9 200 1 Year E ffect ive C o rp o ra te T ax Rat e (P er cen t)
Source: Steven Maguire, Average Effective Corporate Tax Rates,
1958 to 2002, Congressional Research Service, Sept 5, 2003
Finally, it is noteworthy that during the strong economic expansion of 1995-2000, state corporate income tax revenue grew at just half the rate of federal corporate tax revenue — an average of three percent annually versus six percent for the federal tax. (See Figure 4.) Since corporate income tax rates at both the federal
and state levels were fairly stable throughout this five-year period, the relatively slow growth of state corporate tax receipts
suggests that a significant share of corporate profits is being taxed at the federal level but is falling through the cracks at the state level.8
Since 1979, the share of total state taxes contributed by the corporate income tax has declined in all but three states. (See
Table 4.) Between 1989 and 2002, this
share declined by more than five percentage points in nine states: Alaska, California, Connecticut, Kansas, Louisiana,
Massachusetts, New Jersey, North Carolina, and Rhode Island.
Policy Responses
States have a number of options for addressing the decline in state corporate tax revenue.
• Close corporate tax loopholes. Numerous changes are needed in most states’
corporate income tax laws to reestablish this tax as a robust source of state revenue. Three such changes seem particularly worthy of early consideration by policymakers because they would likely gain substantial revenue, they would not require fundamental changes in the structure of the corporate tax, additional
8 During the past decade, there has been a growing trend toward organizing new businesses as (and converting some
existing businesses to) limited liability companies, Subchapter S corporations, limited partnerships, and other so-called “pass-through entities.” A pass-through entity is a business that is exempt from direct income taxation, with any profits of the business instead passed-through pro-rata to the personal income tax returns of the owners. It is often suggested that the growing use of pass-through entities is a major contributor to the declining contribution of corporate income taxes to state coffers revealed in Table 4. Proponents of this theory assert that corporations are still paying their fair share of state taxes, it is just that the profits are now being reported on the state personal income tax returns of the owners of these businesses rather than on state corporate tax returns. While this is undoubtedly true to some degree, the use of pass-throughs reduces state and federal corporate tax receipts. The fact
that federal corporate income tax collections grew twice as fast as state corporate income taxes in the late 1990s (as revealed in Figure 5) demonstrates that whatever the contribution of pass-throughs to the decline shown in Figure 4, Figure 5 suggests that loopholes that uniquely plague state corporate taxes and state corporate tax policy changes contribute significantly to the declining contribution of corporate income taxes to state treasuries.
Annual Growth in Corporate Income Taxes 1995-2000 6.1% 3.0% 0.0% 1.0% 2.0% 3.0% 4.0% 5.0% 6.0% 7.0% Federal State Figure 4
Table 4: Share of State Taxes Contributed by Corporate Income Tax 1979 1989 2002 89-02 79-02 Alabama 5.8% 5.9% 5.0% (0.9) (0.8) Alaska 31.5% 32.6% 24.7% (7.9) (6.8) Arizona 5.9% 4.9% 4.1% (0.8) (1.8) Arkansas 8.4% 5.1% 3.4% (1.8) (5.0) California 14.5% 12.3% 6.9% (5.4) (7.7) Colorado 7.8% 5.9% 3.0% (2.9) (4.8) Connecticut 13.5% 16.6% 1.7% (15.0) (11.8) Delaware 10.2% 13.7% 11.6% (2.2) 1.4 District of Columbia NA NA NA NA NA Florida 7.3% 5.8% 4.8% (1.0) (2.5) Georgia 9.2% 8.3% 4.1% (4.1) (5.1) Hawaii 4.6% 4.0% 1.5% (2.4) (3.0) Idaho 8.4% 6.9% 3.4% (3.5) (5.0) Illinois 7.7% 9.1% 6.2% (3.0) (1.6) Indiana 4.8% 4.8% 7.0% 2.2 2.2 Iowa 8.3% 6.4% 1.8% (4.6) (6.5) Kansas 11.9% 7.9% 2.5% (5.4) (9.3) Kentucky 7.9% 7.6% 3.8% (3.8) (4.1) Louisiana 9.7% 8.7% 3.6% (5.1) (6.1) Maine 7.4% 6.1% 2.9% (3.1) (4.5) Maryland 5.5% 5.3% 3.3% (2.0) (2.2) Massachusetts 13.4% 13.0% 5.5% (7.6) (7.9) Michigan NA NA Minnesota 11.4% 7.6% 4.0% (3.6) (7.3) Mississippi 4.9% 6.3% 4.1% (2.1) (0.7) Missouri 6.5% 5.2% 3.4% (1.7) (3.0) Montana 9.0% 7.7% 4.7% (3.0) (4.3) Nebraska 6.7% 5.6% 3.6% (2.0) (3.1) Nevada NA NA New Hampshire 24.2% 24.8% 19.9% (4.9) (4.3) New Jersey 11.5% 12.5% 6.0% (6.5) (5.5) New Mexico 4.8% 4.0% 3.4% (0.6) (1.4) New York 10.5% 7.6% 5.2% (2.3) (5.3) North Carolina 8.7% 10.7% 4.3% (6.4) (4.4) North Dakota 8.9% 6.4% 4.5% (1.9) (4.4) Ohio 10.9% 6.8% 3.8% (3.0) (7.2) Oklahoma 6.2% 3.4% 2.9% (0.5) (3.4) Oregon 12.0% 6.1% 3.8% (2.3) (8.2) Pennsylvania 12.6% 9.2% 5.4% (3.8) (7.2) Rhode Island 10.4% 6.7% 1.3% (5.4) (9.1) South Carolina 9.2% 5.9% 2.6% (3.3) (6.6) South Dakota NA NA Tennessee 10.1% 9.1% 6.5% (2.7) (3.6) Texas NA NA Utah 4.7% 5.7% 2.8% (2.9) (1.9) Vermont 8.9% 6.0% 2.5% (3.6) (6.5) Virginia 7.7% 5.2% 2.4% (2.8) (5.2) Washington NA NA West Virginia 2.2% 10.8% 6.2% (4.6) 4.0 Wisconsin 10.0% 7.0% 3.8% (3.2) (6.3) Wyoming NA NA Total US 10.2% 8.8% 4.7% (4.083) (5.5) No Corporate Income Tax
No Corporate Income Tax
No Corporate Income Tax
No Corporate Income Tax
Share of Total State Taxes Contributed by Corporate Income Tax, States with Corporate Income Taxes
Point Change in Corporate Income Taxes as % of total tax
revenue
No Corporate Income Tax
No Corporate Income Tax
Source: Mazerov, Michael. Closing Three Common Corporate Income Tax Loopholes Could Raise Additional Revenue for Many States. Washington, D.C.: Center on Budget and Policy Priorities, May 20, 2003.
Note: Texas data omitted because its "earned surplus tax" — the functional equivalent of a corporate income tax — was not enacted until 1991.
revenue could begin flowing relatively quickly, and a substantial share of the additional revenue would arise from the taxation of corporate profits that currently are escaping taxation completely. The three options are:
√ Enacting the so-called “throwback rule” to ensure that profits earned in a
state in which a corporation may not be subject to an income tax are taxed instead by the corporation’s home state.
√ Enacting laws to nullify a corporate tax-avoidance strategy based on the
use of “passive investment company” (PIC) subsidiaries, such as the well-known Geoffrey, Inc. subsidiary of Toys R Us. Such laws prevent corporations from using payments of royalties and interest to PIC subsidiaries as a means of siphoning taxable income out of the states in which the income is actually earned and into tax-haven states like Delaware and Nevada.
√ Amending the definition of apportionable “business income” to strengthen
states’ ability to tax capital gains from the sale of corporate subsidiaries and other major assets, reversions from over-funded pension plans, damage awards in lawsuits, and other irregular sources of income. These three changes could make a meaningful contribution to closing the gap between revenues and expenditures in a large number of states and help stem the long-term erosion of the corporate tax base.
Each of these policies has been implemented in approximately half the states levying corporate income taxes. (Since the policies do not overlap, states can adopt one, two, or all three of them.) Table 5 summarizes which states have not
yet implemented each of the three options. Almost forty percent of the states with corporate income taxes have failed to close two of these loopholes; three states — Kentucky, Louisiana, and Tennessee — have not closed any of them.9
• Adopt “combined reporting.” Under this method of assigning income for tax
purposes, all related corporations that are run as a single business enterprise, any part of which is operating in the state, are essentially treated as one taxpayer for apportionment purposes.10 Combined reporting would eliminate the passive investment company loophole described above, as well as other tax-avoidance schemes that are based on shifting income or profits from one state to another.
9 Kentucky recently enacted a corporate tax reform law that attempted to close the PIC loophole but failed to do so
in an effective manner.
10 Corporate income is apportioned to each state based on a measure of the share of the corporation’s activity that
takes place in the state. The classic formula is based on the share of the corporation’s property, employees, and sales that take place in the state, although some states now give greater (or even sole) weight to sales. At issue, however, is the amount of corporate income to which the formula is applied. Combined reporting ensures that all of the corporation’s income is accounted for and apportioned.
How many of the 3 loopholes could the state
close? Enact Throwback Rule Nullify PICs Broaden Business Income Definition Alabama 1 ● Alaska 1 ● Arizona 2 ● ● Arkansas 2 ● ● California 1 ● Colorado 1 ●
Connecticut 1 ● See Note
Delaware 2 ● ● See Note
District of Columbia 1 ●
Florida 2 ● ●
Georgia 1 ● See Note
Hawaii 1 ● Idaho 1 ● Illinois 1 ● Indiana 2 ● ● Iowa 2 ● ● Kansas 1 ● Kentucky 3 ● ● ● Louisiana 3 ● ● ●
Maine 0 See Note
Maryland 1 ● See Note
Massachusetts 1 ● See Note
Michigan NA
Minnesota 1 ●
Mississippi 1 ●
Missouri 2 ● ●
Montana 1 ●
Nebraska 1 ● See Note
Nevada NA See Note
New Hampshire 0 New Jersey 1 ● New Mexico 2 ● ● New York 2 ● ● North Carolina 1 North Dakota 1 ● Ohio 2 ● ●
Oklahoma 1 ● See Note
Oregon 1 ●
Pennsylvania 2 ● ●
Rhode Island 2 ● ● See Note
South Carolina 2 ● ● See Note
South Dakota NA
Tennessee 3 ● ● ●
Texas NA
Utah 1 ●
Vermont 0 See Note
Virginia 2 ● ● See Note
Washington NA
West Virginia 2 ● ●
Wisconsin 2 ● ●
Wyoming NA
Number with 0 3
Total US Number with 1 24
Number with 2 16
Number with 3 3
Table 5: Corporate Tax Loopholes
Source: Mazerov, Michael. Closing Three Common Corporate Income Tax Loopholes Could Raise Additional Revenue for Many States. Washington, D.C.: Center on Budget and Policy Priorities, May 20, 2003.
• Adopt a corporate alternative minimum tax. To guarantee that all businesses
that benefit from state services pay at least something into the state treasury, some states have instituted a corporate alternative minimum tax. Such a tax requires that all corporations pay some minimum amount in income taxes even if their exemptions and deductions reduce the tax owed under the standard tax laws to zero. States that do not have an alternative minimum tax could adopt one; states that already have one could consider raising the level if it has not been updated in a number of years.
• Adopt a state-level value-added tax. Like the sales tax, a value-added tax
(VAT) is based on the value of goods and services. It is collected from businesses based on the value that is added at each step in the production and distribution processes.
For example, in the case of a car plant, the tax would be levied not on the value of the cars produced by the plant, but just on that portion of the value contributed at the plant. The amount subject to the VAT would be the total revenue received by the plant when it sells the cars it has produced minus the cost of the parts,
materials, and services the plant purchased to make the cars.11
A low-rate VAT can be used as a kind of backstop to the corporate income tax. Under this approach, the VAT would capture the business activity of companies that are not subject to the corporate income tax, as well as of service companies whose products are not subject to the traditional sales tax. It could be designed to avoid having companies pay both the VAT and the other tax. For example, New Hampshire — whose main state business tax consists of a VAT and a corporate income tax — gives companies a credit against their corporate income tax liability for the VAT payments they make.
Only one state, Michigan, uses a VAT in place of a corporate income tax. As the law stands in early 2005, the Michigan VAT is being phased out. The governor has however, proposed reforming and retaining the VAT. As noted above, New Hampshire uses a VAT in conjunction with a corporate income tax, an approach other states should consider.
11 The base of the VAT — that is, the amount of value that a processor or supplier adds — can be calculated in one
of two ways. An “operational VAT” is applied to the value added by operations within a particular state regardless of where the resulting product is sold. By contrast, a “transaction-based VAT” is a type of consumption tax that is levied in the state where the final product is bought. At the state, as opposed to national level, an operational VAT is the only practical form of VAT for a number of legal and technical reasons. The base of an operational VAT for an individual company is the taxpayer’s gross receipts minus the cost of purchases from other firms. The base can be determined on a subtractive basis by subtracting purchases from gross receipts or on an additive basis by adding up payrolls, rent, interest and profits. Either approach should lead to the same base for individual corporations.
• Shore up enforcement measures. States could, for example, hire more auditors,
provide them with additional training, and expand information-sharing with the IRS and other state revenue departments. These measures, accompanied by stiffer penalties, could increase state business tax collections.
IV.
The Growth of Interstate Sales
In addition to the growth of the service economy, another factor that is shrinking the sales tax base is the growth of remote sales such as those made by phone, through catalogs, and
through electronic commerce (the Internet). The rise of “e-commerce” is having a significant impact on state and local revenues.
When a person makes an in-store purchase of a product to which sales tax applies, he or she pays the sales tax to the store; the store periodically sends its sales tax collections to the state or local government levying the tax.
If the purchase is made from an out-of-state company over the phone, through a catalog, or through electronic commerce, the purchaser still owes the sales tax (which is then called a use tax). However, the state cannot require the company that sells the product to collect the tax
because two Supreme Court decisions have barred states from requiring sales taxes to be remitted when the vendor does not have a physical presence in the state. Instead, it is the customer’s responsibility to pay the tax directly to the state or local government.
In practice, few customers actually pay sales taxes directly, and most states do not enforce this requirement except when a very expensive item such as a car is purchased. This hurts small businesses and in-state retailers, which become less competitive with Internet and catalog sellers. It also prevents states and localities from collecting significant amounts of revenue that is due to them. Donald Bruce and William Fox of the University of Tennessee estimate that the inability to collect tax on Internet purchases cost states and localities about $15 to $16 billion in lost revenue in 2003.12 The revenue loss is projected to grow rapidly in future years, undermining state sales taxes and contributing to structural deficits.
12 States would likely not collect all of this potential revenue under a politically feasible solution to this problem
because at a minimum, states would have to provide some compensation to vendors for collecting the tax, and there would have to be some exemptions from the requirement of collecting the tax to protect small vendors. However, they could collect a substantial share.
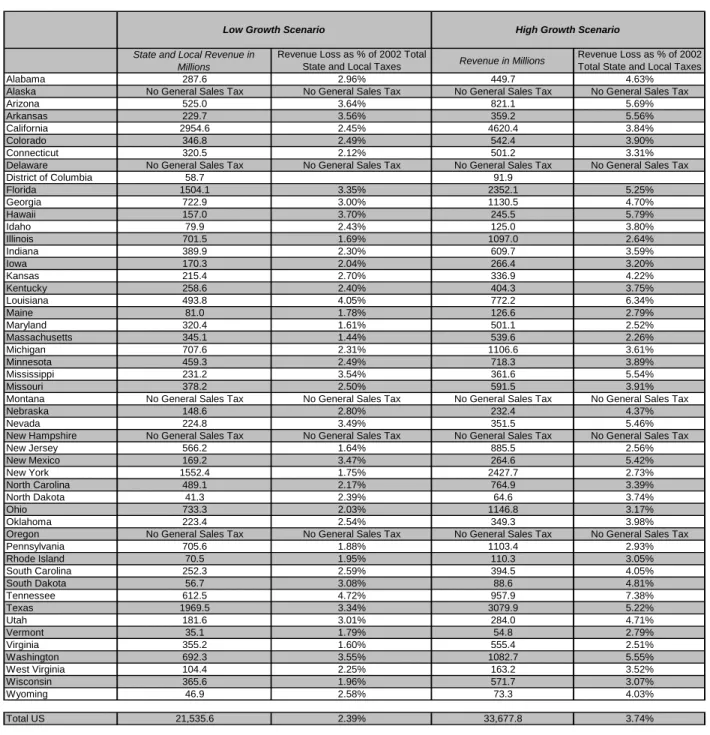
According to Bruce and Fox’s most recent estimates, electronic commerce is projected to cost every state with a sales tax an amount equal to at least one percent of its state and local taxes by 2008. (See Table 6.) Seven states — Arizona, Arkansas, Hawaii, Louisiana, Mississippi,
Tennessee, and Washington — are projected to lose more than 3.5 percent of their state and local taxes by 2008 under the lower of two estimates provided by Bruce and Fox.
Policy Responses
One of the above-mentioned Supreme Court decisions, the 1992 Quill decision, made
clear that Congress can pass legislation to empower states to tax sales made to state residents by
vendors not physically present in the state. Such legislation has been introduced in almost every session of Congress but has consistently been blocked by a coalition of legislators, whether out of general anti-tax ideology or in response to strong pressure from the politically potent direct marketing and electronic commerce industries.
In the past, an argument against federal action in this area has been that the many differences among state sales tax systems would make collecting and remitting sales taxes too difficult for out-of-state vendors. In the last few years, however, states have made substantial progress under their “Streamlined Sales Tax Project” in harmonizing state sales tax systems in ways that will substantially reduce the burden of collecting these sales taxes. Thus, the time is ripe for Congress to enact a solution to this problem and stem the hemorrhage of state and local revenues. So far, however, Congress shows no sign of doing so.
In the meantime, many states are addressing this problem on their own. Some are
attempting to encourage compliance with use taxes owed by consumers. For example, a number of states provide a line on their income tax forms (or include a separate form) where individuals can record the use tax owed the state from Internet or phone purchases and then pay the amount owed along with their income tax payment.
In addition, a number of states — Indiana, Kansas, Louisiana, and Minnesota, for example — have enacted laws to broaden the definition of when a company has a presence (or “nexus”) in a state. A more expansive definition could allow states to require Internet-based businesses that are closely linked to “brick-and-mortar” businesses in the state to collect and remit sales taxes from their in-state customers. For example, Barnes and Noble’s Internet sales operation is a legally separate entity from the operation that runs the company’s stores, yet the website benefits from advertising for the stores and the two operations are linked in many ways including offering the same items for sale. States can explicitly define nexus to recognize these connections and then enforce these nexus laws through enhanced collection activities.
Some states — such as North Carolina and South Dakota — have also modified their state procurement laws to require that the state only do business with companies that collect and remit sales taxes collected from state residents.
Table 6: Estimated Revenue Loss Due to E-commerce, 2008
State and Local Revenue in Millions
Revenue Loss as % of 2002 Total
State and Local Taxes Revenue in Millions
Revenue Loss as % of 2002 Total State and Local Taxes
Alabama 287.6 2.96% 449.7 4.63%
Alaska No General Sales Tax No General Sales Tax No General Sales Tax No General Sales Tax
Arizona 525.0 3.64% 821.1 5.69%
Arkansas 229.7 3.56% 359.2 5.56%
California 2954.6 2.45% 4620.4 3.84%
Colorado 346.8 2.49% 542.4 3.90%
Connecticut 320.5 2.12% 501.2 3.31%
Delaware No General Sales Tax No General Sales Tax No General Sales Tax No General Sales Tax
District of Columbia 58.7 91.9 Florida 1504.1 3.35% 2352.1 5.25% Georgia 722.9 3.00% 1130.5 4.70% Hawaii 157.0 3.70% 245.5 5.79% Idaho 79.9 2.43% 125.0 3.80% Illinois 701.5 1.69% 1097.0 2.64% Indiana 389.9 2.30% 609.7 3.59% Iowa 170.3 2.04% 266.4 3.20% Kansas 215.4 2.70% 336.9 4.22% Kentucky 258.6 2.40% 404.3 3.75% Louisiana 493.8 4.05% 772.2 6.34% Maine 81.0 1.78% 126.6 2.79% Maryland 320.4 1.61% 501.1 2.52% Massachusetts 345.1 1.44% 539.6 2.26% Michigan 707.6 2.31% 1106.6 3.61% Minnesota 459.3 2.49% 718.3 3.89% Mississippi 231.2 3.54% 361.6 5.54% Missouri 378.2 2.50% 591.5 3.91%
Montana No General Sales Tax No General Sales Tax No General Sales Tax No General Sales Tax
Nebraska 148.6 2.80% 232.4 4.37%
Nevada 224.8 3.49% 351.5 5.46%
New Hampshire No General Sales Tax No General Sales Tax No General Sales Tax No General Sales Tax
New Jersey 566.2 1.64% 885.5 2.56% New Mexico 169.2 3.47% 264.6 5.42% New York 1552.4 1.75% 2427.7 2.73% North Carolina 489.1 2.17% 764.9 3.39% North Dakota 41.3 2.39% 64.6 3.74% Ohio 733.3 2.03% 1146.8 3.17% Oklahoma 223.4 2.54% 349.3 3.98%
Oregon No General Sales Tax No General Sales Tax No General Sales Tax No General Sales Tax
Pennsylvania 705.6 1.88% 1103.4 2.93% Rhode Island 70.5 1.95% 110.3 3.05% South Carolina 252.3 2.59% 394.5 4.05% South Dakota 56.7 3.08% 88.6 4.81% Tennessee 612.5 4.72% 957.9 7.38% Texas 1969.5 3.34% 3079.9 5.22% Utah 181.6 3.01% 284.0 4.71% Vermont 35.1 1.79% 54.8 2.79% Virginia 355.2 1.60% 555.4 2.51% Washington 692.3 3.55% 1082.7 5.55% West Virginia 104.4 2.25% 163.2 3.52% Wisconsin 365.6 1.96% 571.7 3.07% Wyoming 46.9 2.58% 73.3 4.03% Total US 21,535.6 2.39% 33,677.8 3.74% Data Source:
Bruce, Donald and William F. Fox. "State and Local Sales Tax Revenue Losses from E-Commerce: Estimates as of July 2004," State Tax Notes, August 2004.