Erasure Codes-based Storage-aware Protocol for Preserving
Cloud Data under Correlation Failures
Zhiqiang Ruan and Zhi Li
Department of Computer, Science Minjiang University, Fuzhou, China
Institute of Information Engineering, Chinese Academy of Science, Beijing, China
[email protected], [email protected]
Abstract
Distributed storage of cloud data imposes a great challenge for assuring data availability and reliability in the face of stochastic failures and attacks. Although redundancy scheme such as erasure codes or network coding schemes can be used to improve storage efficiency, they do not consider the scenario that the network may be split up into several regions due to correlated failures of storage components, which may not successfully reconstruct the original data. Furthermore, the stored data on the failed node need to be recovered to keep the same redundancy of network data while introducing low overhead. In view of this, we first devise an efficient algorithm that guarantees residual network has enough data segments to recreate the original data under correlated failures. Second, an efficient data recovery scheme is presented to repair the data stored on the failed nodes in case of Byzantine failures or pollution attacks. The proposed protocol benefits from several key features such as less storage cost, competitive communication cost, and much better data robustness comparing to the state of the art distributed storage systems.
Keywords: Cloud computing, distributed storage, correlated failures, fault-tolerant,
reliability
1.
Introduction
Cloud computing has enabled individuals and enterprises to preserve their data from local to remote data centers in a distributed manner [1]. One key issue to consider in such distributed storage system is maintaining availability of data and ensuring reliability in the presence of random failures of storage node (SN). Many works have been proposed in the literature with the assumption that failures occur independently at any SNs of the system. This assumption greatly simplifies the analysis; however, it is not realistic for the type of failures occurring in distributed storage systems such as grid computing, peer-to-peer (P2P) networks, large-scale distributed computing systems. Because the communication network and the fact that such failures can change the topology of the system in a random fashion.
Since erasure coded based storage systems have high fault tolerance without requiring a large number of replicas that increase the storage cost [2, 3], they have been extensively used for ensuring dependable and fault tolerant design of distributed data storage, where a set of data symbols/segments is generated and distributed across the network so that one may recover the original data even if a few of these symbols are lost or erased. Formally, in (N, K) erasure code storage system, N coded symbols of size |M|/K are generated from the original data M and assigned to n storage nodes in the network. The original data M
can be reconstructed when accessing and decoding any K out of N symbols (N≥K) [3]. However, this requirement alone is not sufficient for successfully recreate the original data when the network do exhibit some type of spatial and / or temporal correlation of anomalies. Joshi et al., analyzed statistics of failures in large-scale systems and concluded that such systems are affected by frequent, correlated machine crashes and network failures
that reduce the reliability of the entire system [4]. A similar conclusion was obtained independently by Gallet, et al., [5]. For simplicity, we assume that the defective SNs are confined to a certain range. Such failures are generally happened in disaster scenarios, either manmade or natural, whereas only the SNs located at the disaster zone are affected. As a consequence, the network is probably getting disconnected because of these powerful but localized failures. In spite of more than K symbols residual, none of them exist in the same region. In order to restore the original data, one has to make sure that at least one of the connected regions has more than K symbols. Therefore, it is extremely important to design a robust data distribution scheme to overcome such failures.
The following problem is accurate repair the data preserved in the disabled SNs so that the same redundancy and functionality of the network can be achieved. The conventional countermeasure has to first reconstruct the initial data and then regenerate the data that conserved in the failed one [6-8]. Unfortunately, this approach would introduce tremendous of overhead by retrieving the whole N symbols of the initial data, only to regenerate a small fraction of symbols stored in that disabled SN. Moreover, previous works mainly encompass sudden collapse behaviors of SNs, whereas lack of considering with Byzantine failures [9] or pollution attacks, in which the preserved data can be tampered and eventually lead to incorrect data reconstruction and / or recovery. Thus, it is imperative that efficient data regeneration scheme is presented for minimizing the number of data symbols retrieve from the network while ensuring the integrity of stored data.
Therefore, this work seeks to devise a redundant data storage scheme such that the data can be recovered after correlated failures. Since storage of the data symbols involves cost, the data symbol distribution scheme should minimize the total storage requirement over the storage system. In addition, a simple yet efficient data recovery scheme with integrity check of data has to be considered. In particular, the major contributions of the work in this paper can be summarized as follows:
A robust data dissemination approach exploiting (N, K) erasure coding for guaranteeing that even though the network is break up into different sections because of correlated failures of some SNs, there are at least one remaining parts will have more than K symbols to recreate the initial data.
The exploring of data recovery scheme that allows exact reproduce of original data with low computation and communication cost.
The remaining sections are structured as follows: Section 2 discusses related work on geographical correlation failures; Section 3 presents the system model and gives problem formulation; Section 4 describes the performed approaches and solutions; Section 5 shows the experimental results; Section 6 gives the analysis; Section 7 presents the conclusions.
2.
Related Work
Issue of reliability and correlated failures have been well studied in cloud storage systems, wide-area storage, distributed file systems and computer networks. Some of the previous works interested in correlated failures mainly concentrate on (i) identifying the vulnerability of the system to such disasters [10, 11] (e.g., estimating damage locations that have the maximum impact on network operation [10]), or the effect of such disasters [11], (ii) analyzing network capacity or evaluating its robustness [12], and measuring its reliability [8, 13]. They are a few studies [14-16] stress how to distribute coded symbols of source SN to a subset of nodes in the network in order to ensure that each of them has one piece of data. The primary goal of this line of research is explicit establishment of a stable topology so that the original data can be recreated by visiting at least K SNs.
Our work is partly inspired by that of literatures [14, 15], which consider stochastic failures and utilize error-correcting codes to replace the data on the disabled SN. However, there exists a considerably different between our research and that of [14, 15]. Despite [14, 15] solve the regeneration problem and seek to get a trade off between communication
and storage overhead, they do not considering correlated failures in the network, whereas our work directly towards the objective of developing a robust data distribution scheme that allow a few SNs dysfunction due to such failure and perform accurate repairing of data on arbitrary network topology.
3.
Models and Problem Formulation
3.1. The System Model
We assume a cloud data storage service that provides user data outsourcing service, data retrieval, and repair service. The network includes the cloud server, a trust third party (TP) and individual customers. The customers outsource their data to the connected storage server (source SN), which then encodes the data M into N fragments and assigns to n SNs. After the data outsourcing service, a customer can retrieve the data anytime and anywhere. However, in order to release the customer from the burden of being online, we suppose that TP responsible the outsourced data reconstruction and repair works for the customers. This is reasonable as sometimes the customer has privacy concerns, and requires a neutral third party to manage data. Table 1 summarizes the notions to be used throughout the paper.
Table 1. List of Notations Notation Description
λ The number of symbols saved in each SN
β The number of symbols retrieve from each SN, where β≤λ
n The total number of SNs in the network
d The number of surviving SNs in the network
μ The maximum symbols stored in each SN
l The number of largest regions remaining in the network
φj The set of SNs in a largest remaining region
Ф The set of l largest remaining components of network G r Radius of fault region
(N,K) Erasure codes encode K information symbols to a coded vector <a0,...,aN-1>
Ψ A set of N distinct colors
Ci The list of colors assigned to SNi
kj The number of different colors required by set φj, 1≤j≤l
3.2. Problem Formulation
The network is described as a connected graph G=(V, E) where V is the set of n SNs and
E represents the set of links between them. Let the two dimensional layout of G on a plane be LG=(P, L) where P={p1,...,pn} represents the set of points and L={l1,...,lw} are straight lines. We focus on a region in a two dimensional plane R with radius r, because of the correlated failure model most of the SNs or links confined to the failure event are destroyed. As a result, the surviving network may compose of several disconnected parts. The aggregate number of such different regions that has to be considered is l=O(n2)[17]. Let ¡ = {R1, ...Rl} denotes the set of different regions, for the data M, a SN SNiÎV enabled
to store up to μ data symbols. We intend to distribute N encoded symbols of data M from source SN to n storage locations of the network so that the largest section of the remaining network has more than K different symbols to recreate the initial data.
Let ji represents the set of SNs in the maximum remaining section in G after region Ri
fails, where iÎ [1, ]l , and let F = {j1, ...,jl} denotes the set of l largest remaining area of
network G. Assume each SN received λ symbols after distribution of the coded symbols, where 0≤λ≤μ. Since storing every single symbol involves cost, the goal is to minimize the
total storage requirement in the network. Suppose Y = { , ...,c1 cN} are a set of N different
colors, we can formulate the data distribution problem as color distribution problem where each color indicates a symbols and assigning a colorcj,jÎ [1,N] , to a SN SNi, iÎ [1,n]. On
the other hand, the data recovery problem can be formulated as choosing distinct color
j
c ,jÎ [1,N] from the surviving SNs in ¡ .
4.
The Proposed Scheme
4.1. Data Encoding
First, a message authentication code (MAC) is appended to the original data by the source SN for data integrity. In this work, we take advantage of Cyclic Redundancy Check (CRC) because it is easy to implement and needs lower redundancy. Thereafter, we assume that CRC checksum has been attached to the initial data.
Second, the customer uploads the data to the source SN, which splits the data into
|M| /q
segments so that each of which represents an element in GF(2
q
). Then the |M| /q
symbols are further divides into |M| /q K information sequence 0 1 , ..., K m m m , we arrange the information sequence into an information matrix U with dimension of λ×d such that U=B1B2, where
0 1 2 1 1 1 2 2 1 1 2 2 3 4 ( 1 ) / 21 m m m m m m m m B m m m m L L M L l l l l l l l ll -+ -- - - + -殞 油 油 油 = 油 油 油 油 薏 , ( 1 ) / 2 ( 1 ) / 2 1 ( 1 ) / 2 1 ( 1 ) / 21 ( 1 ) / 2 ( 1 ) / 2 2 2 2 ( 1 ) / 2 1 ( 1 ) / 2 2 2 K1 m m m m m m B m m m L L M L ll l l l l l ll l l l ll l l l l ll l + + + + + -+ + + + + + -+ + - + + - -殞 油 油 油 = 油 油 油 油 薏
Let the elements of U be wij, we precisely construct B1 and B2 as a symmetric vector, in
particular, we have 1 2 ( ) f o r f o r 2 j i z i j j i z w m i j w w l m i j l l l -ì = # ï ïï = í ï = + # ïïî
where z1(i1) (1)i i( 1) / 2 j and z2(1) (i 1 / 2 )i i( 1) / 2(j) . After this
construction, B1 and B2 are symmetric matrices with size λ×λ. In the process of encoding,
each row of U has a codeword of length N. Besides, for the i-th row of U, the corresponding codeword is
0 1 1
[Wi( ),Wi( ),LWi(N)] (1)
where Wi(x) is a polynomial with all elements in the i-th row of U as coefficients, namely,
1 0 ( ) d j i j ij W x w x
, where α is the generator of GF(2q). We have T =U ?G , where
0 1 1 0 2 1 2 1 2 0 1 1 1 1 1 1 1 1 ( ) ( ) ( ) ( ) ( ) ( ) N N d d N d G L L L M L a a a a a a a a a -- - - -殞 油 油 油 油 = 油 油 油 油 油 薏
and T is the codeword vector with size of λ×N. Next, the i-th column of T is assigned to SNi by using the method below. Finally, the original data is securely erased.
4.2. Coded Symbol Distribution
Algorithm 1 Symbol Distribution Algorithm
Input: Ψ={c1,...,cN}, μ, r, K, and N. Output: Ci={c1,...,cλ} begin 1 Compute = l ¡ 1
{R, ...R } and derive residual graph set F ={j1,L ,jl}
3 repeat
4 Compute ρi, i[1,n]; 5 ifup=0 then
6 No feasible solution exist; return
7 else select SNp with highest ρi in Ф 8 p 9 foreach j:S Npj do 10 Dj and DjCi 11 kj←kj-1 12 ifkj =0 then Ф←Ф\φj 13 end 14 Cp Cpcj 15 up←up-1 16 until 17 for i | | to 1 do 18 forj=λ to 1 do
19 ifCi\cj still has a feasible solution then Ci←Ci\cj 20 end
We want to assign N encoded symbols (or colors) to total number of n SNs in such a way that the remaining network has more than K symbols to reproduce the data. For each SN (say SNi), the number of coded symbols it receives is λ, where 0≤λ≤μ. Note that μ is a system parameter, which is used to ensure that the encoded symbols stored in sparse rather than cumulating on a few storage nodes.
Step 1: each source SN produces all the different regions 좱 ={R1, Rl} of radius r on the
graph layout LG using the method in [12], and finds the largest component F ={j1,L ,jl} of
the residual graph for each faulty zone. Let Ci records the list of colors distributed to SNi. kj denotes the number of different colors demanded for set j j. Initially, Ci= ? , and kj=K (as
shown in Algorithm 1, line 1).
Step 2: for each j j? , line 3-16 arranges a new color to a SN. Let ρi, iÎ [1,n] represents
the number of times SNiappears in all sets in Ф. The bigger the value of ρi means SNis a better option for allocating a new color. In each iteration, line 4 chooses a SN, say SNp, for which ρi is largest and at least cache one color. The for-loop from line 9-13 scan all the sets
φj that contains SNp, among which line 10 selects the set of colors Dj that has not been assigned to any storage node in φj, and the values of kj is decreases in line 11 when a new different colors is found for φj, if any φj satisfied all color requirement in line 12, it is removed from Ф. Line 14 picks up the color cj which is lowest in all the colors j:p j j
D
I
j uÎj
within the for-loop and distributes cj to the storage node vp. It should be noted that selecting the minimum color j j:p j j
c Î Ij uÎj D ensures that all the sets φj get a new different color. Line
15 reduces up by 1 and the line 5 indicates that if up =0 for S NpV at any iteration, all the
SNs have been distributed colors meet its threshold. Otherwise, if some sets j j? can not
satisfy the coloring constraints of having K different colors, the algorithm terminates without having a feasible solution.
Step 3: line 17-20 delete redundant colors distributed to the SNs. The double for-loop
works by the list of the colors allocated to the SNs in reversed order and removes a color from a SN if deleting the color from that one still has a feasible solution.
4.3. Data Reconstruction
Without loss of generality, we assume that TP accesses k storage nodes S N0,S N1,L ,S Nk-1.
First, the information sequence m is recovered by solving the linear equations:
° ° ° 1 U T G -= ?
(2) where ° 0 1 1 0 2 1 2 12 0 1 1 1 1 1 1 1 1 ( ) ( ) ( ) ( ) ( ) ( ) k k k k k d G L L M °
G is the first d columns of G and °
1
G
is the inverse of G° . The procedure is described as
follows:
Step 1: TP initializes i=k, and randomly selects k storage nodes out of d survival storage nodes, where Li={a0,a1,L ,a(k-1 )} ; then it sets U= Ti.
Step 2: TP applies ° ° ° 1
U T G
-= ? to derive the information sequencem ; if m passed the
CRC test, the CRC checksum can be removed from m to recover the original data block T0.
The procedure returns T0 and the data reconstruction succeeded; otherwise, go to step 3.
Step 3: TP adds i=i+2, two more encoded symbols ax, ay from surviving SNs (SNx and
SNy) are required and attached to previously received symbols to generate a new codeword,
2 { , }
i i x y
L L a a , then, TP decodeS the new codeword to gain the K symbols. This decoding
procedure is repeated until i≤n-1or the decoding algorithm failed to reproduce decoded symbols.
Step 4: If i≥n-1, the data reconstruction fails due to too much errors occurs, in this circumstance, decoding failure is reported; otherwise, TP starts next round of data recovery and go to step 2.
Algorithm 2 Symbol Regeneration Algorithm
Input: i
Output: S
1 begin
2 TP randomly selects d storage nodes S N0,S N1,L ,S Nd-1
3 Each selected node takes its symbols as a (β×λ) vector and multiply it by gi in Eq. (3) 4 TP forms the resultant vector as a (b´ d) matrix Y
5 i←d
6 repeat
7 Perform error correcting code on each row of Y to derive °
T
8 Perform ° ° 1
M T G
-= ? and obtain information symbol S from M
9 if CRCTest(S)=true then 10 return S
11 else
12 i←i+2
13 Two additional storage nodes are retrieved
14 Each storage node perform the same operation as step 3 15 TP forms a new matrix Yb ´i
16 untili≥n-2 17 return false 18 end
4.4. Regenerating Lost Symbols
Suppose node i be the disabled node to be renewed. During restoring, TP retrieves
k(d#k n-1) SNs S N0,S N1,L ,S Nk -1. Each retrieved node operates the inner product of λ
symbols and 11 1 2 1 1 [1, ( i ) , ( i ) , , ( i ) ] i g L l a- a- a- -= (3)
where gi can be obtained by the generator α and index i, then the resultant symbol
0, 1, 1
a a L ak - is returned to the TP to generate the codeword Ti, where
( ) ( )
i i i
T = g 利U G = g 利U G. (4)
If (n-k)+2t<n-d+1, where t represents the number of incorrectly decoded data bits in
k resultant symbols, gi·U can be recovered by multiplying Ti and G° 1 -, which is equivalent to 1 2 1 2 [ ] [ ] i i i g ?B B g 利B g B (5)
Since transpose of giis the i-th column of G , B1 and B2 are symmetric matrices, we have
(g Bi j)T= B gj iT, for j=1,2. The λ symbols saved in SNi can be computed by 1 1 2 ( )T ( i ) ( )T i i g B a- l g B + (6)
The decoding procedure in data reconstruction can be applied to decode a0,a1,L ak -1. First,
TP retrieves d SNs and obtains λ and Ti by (3). Next, the CRC checksum is extracted and verified. If it is passed, the regeneration return true; otherwise, two extra SNs are randomly visited, TP decodes the retrieved a0, a1..., ad+1 again to obtain Ti and λ. The process is repeated until correctly received sufficient data fragments to restore the failed node. The symbol recovery algorithm is described in Algorithm 2.
5. Analysis
We analyze the fault-tolerant capability, security strength, storage cost, and communication overhead of the proposed scheme in the following subsection.
5.1. Fault-tolerant Capability
There are two types of failures, namely crash-stop failures and Byzantine failures, are considered in analyzing fault-tolerant ability. Crash-stop failures can be regarded as removing the code elements from codeword. As our symbol distribution scheme enable each set has at least K different symbols, the crash-stop failures that can be allowed in data reconstruction is at most N-K. During recovery a single symbol, d nodes have to be retrieved. Therefore, the fault-tolerance of regeneration is n-d. In respect of Byzantine failure, we assume that the erasure code is utilized to obtain the CRC checksum and the number of errors is confined to the maximum number of failures the RS code can manage. In the circumstance, the minimum erroneous node that the RS code can tolerant to restore the CRC checksum is(nd) / 2 . Therefore, the efficiency of data reconstruction can be
defined as the probability of successful decoding P r
r e c, we have ( ) / 2 0 0 ( 1) P r (1 ) ( 2 1) nd N K i Ni r e c i j N K N i j K e e i j K N j K (7) where e represents the error probability of data, and ( 1)
( 2 1) K N i j K j K N j K denotes the number of SN visits. 5.2. Security Strength
In analyzing the security strength, collusion among polluters is considered. In other words, the polluters can forge data cooperatively during the data reconstruction or regeneration process. This is useful when the polluters had compromised a small set of SNs but still tamper the data on other SNs and eventually leads to valid but incorrect data
reconstruction. The security strength is thus the minimum number of polluters to forge the data in data reconstruction.
Suppose j0, j1, ..., jp-1 be the polluters who collude to forge the information symbols, let y
represents the forged column in m , and y y m
:
= + , where m indicates the real information
symbols. Then, based on the RS encoding procedure, we have
( )
y G y m G y G mG
: :
g c
= + = + = + , (8)
where γ is the modified data symbol made by the polluters and χ is the initial data symbol stored in SNs. Let the minimum Hamming distance of the RS code in γ is θ, obviously, θ≥n-k+1, so we suppose that θ=n-k+1 for the worst case. The attacker has to compromise k
SNs and make them store the forged information symbols in yG so as to successfully fake information symbols. If TP happens to retrieve these polluted SNs, data can be forged successfully. Otherwise, suppose b<k SNs are polluted, that is, 1
2 n d b n d b q- = - + - ? 油 -油 油 薏 , where 2 n d 油 -油 油
薏 is the error correcting capability of the RS code, the decoding procedure is possible to recover the received vector to yG. Considering the minimum of 2
2
n d
b= 殞 -油 +
油
薏 ,
the security strength for data reconstruction is 2
m i n { , } 1 2 n d k 殞 -油 + -油 薏 .
In the case of forgery attack on data regeneration, the adversary prefer to make the fraudulent data with all zero redundant bits rather than break the CRC checksum of the failed node, because of linear operation introduced in computing the CRC checksum. Therefore, the security strength for data regeneration is 2
m i n { , } 1 2 n d d 殞 -油 + -油 薏 . 5.3. Redundancy Ratio
CRC checksum incurs extra storage and communication overhead, recall that each information vector is added with the extra r0 bits in data construction so that it can be
verified after reconstruction. Suppose that ' '
(N ,K ) RS code is applied to encode the CRC checksum into '
N fragments and assigned to n SNs, where K' r0/q' 油
= 油薏 and ' [ ] 2
lo g ( ) q = n .
Each SN has to keep the encoded CRC symbols for other n-1 nodes, which requires additional storage of '
n q bits.
During data regeneration, TP must gather the associated CRC checksum for the failed node to prove the validation of reproduced data. At least d SNs need to be retrieved, the accessed data and the associated CRC checksum of the failed node are provided to TP. Each piece of CRC has '
q bits, the extra communication overhead is d q', and the total
communication cost for repairing the βλ symbols kept in the failed node is βqd.
6. Performance Evaluation
In the simulations, we set up with the parameters as follows:mÎ [1, 2 /K] , β=1, N=41,
K=21, r=300. The previous erasure codes based scheme without considering region-based fault in the network used as a baseline scheme for comparison. Each simulation includes a data (symbol) distribution phase and a collection phase. In the previous phase, each source SN performs the considered storage protocol to distribute the data over the network. While in the collection phase, TP gathers data from these SNs and returns to the customer.
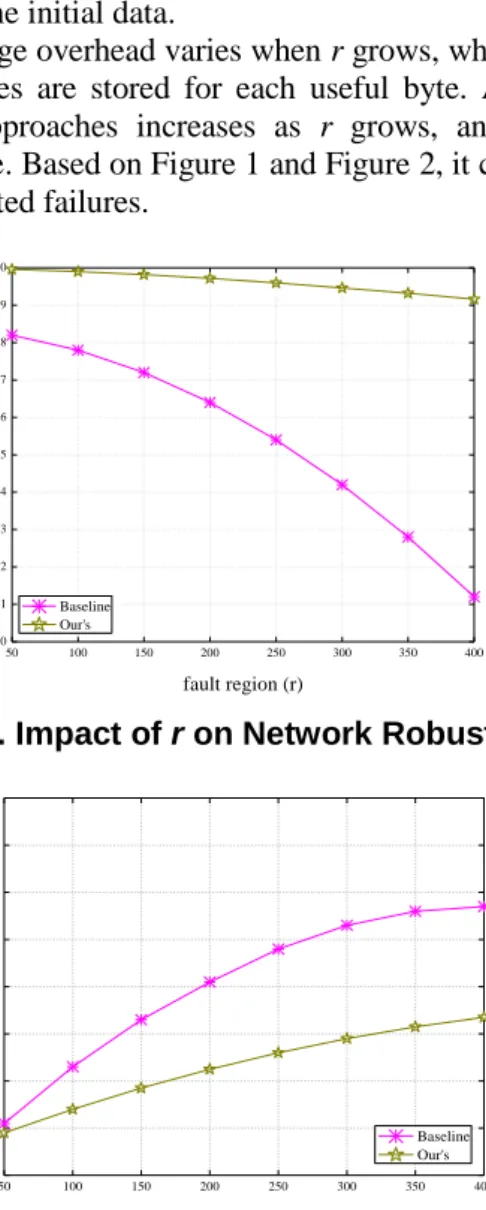
We first investigate the impact of fault region (radius r) on the network robustness without error data in the network. Here, robustness means that after data distribution, the probability of TP successfully retrieves the data.
Figure 1 shows the robustness is decreases with the increases of fault region r. As we can see, when r grows to 400, our scheme still has 90% robustness. The reason that we have better performance than existing schemes is we consider a more realistic case, where the network can get disconnected due to SN failures. In other words, such failures are
correlated and have greater impact on data survival compared to independent failure of SN. We devise a robust data distribution algorithm that guaranteeseach remaining zone has at least of K symbols to reconstruct the original data. Contrary, since Baseline scheme without considering correlated failures, there are probably have not enough symbol in the network for TP to recreate the initial data.
Figure 2 shows how storage overhead varies when r grows, where we define the storage overhead as how many bytes are stored for each useful byte. As can be observed, the normalized cost of two approaches increases as r grows, and the proposed scheme outperforms baseline scheme. Based on Figure 1 and Figure 2, it can be concluded that our scheme is resilient to correlated failures.
50 100 150 200 250 300 350 400 0.0 0.1 0.2 0.3 0.4 0.5 0.6 0.7 0.8 0.9 1.0 Ro b u stn es s fault region (r) Baseline Our's
Figure 1. Impact of r on Network Robustness
50 100 150 200 250 300 350 400 0.2 0.4 0.6 0.8 1.0 1.2 1.4 1.6 1.8 No rma lized cost o f sto rin g o n e b y te fault region (r) Baseline Our's
Figure 2. Impact of r on Storage Overhead
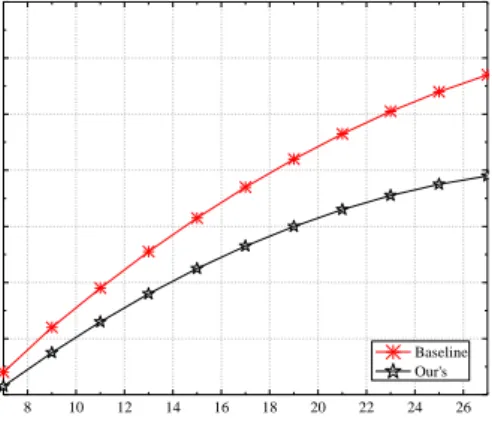
Next, we investigate the impact of parameter K on the total storage requirement, keeping N=41 and r=300 constant. Figure 3 shows the storage overhead incurred by the compared schemes. As we can see, the storage requirement of both schemes increases with
K. The reason is straight; the higher K indicates that TP needs more distinct symbols to reconstruct the data, which results in higher storage requirement for the data symbols. However, the storage overhead of Baseline scheme is much higher than us. Even for the low rate case, i.e., K=7, the Baseline scheme has at least 20% of storage overhead more than us. This is one of the major benefits of the proposed scheme.
In the second set of experiments, we study the repair efficiency of regenerating data on the failed node. We fail one node at random and start the data repair process. Note that correlated failures do exhibit when individual SN failed, however, the repair work has to be performed separately on each failed SNs. Therefore, there are no differences between independent failures and correlated failures during data regeneration.
8 10 12 14 16 18 20 22 24 26 0.2 0.4 0.6 0.8 1.0 1.2 1.4 1.6 No rma lized cost o f sto rin g o n e b y te K Baseline Our's
Figure 3. Impact of (N, K) on Storage Overhead
0.0 0.1 0.2 0.3 0.4 0.5 0.6 0.7 0.8 0.9 0 40 80 120 160 200 240 280 Av era g e c o m m u n ica tio n co st
error probability (e) Baseline
CESR
Figure 4. Average Communication Cost vs. Error Probability in Data Regeneration
Figure 4 measures the average communication cost incurred by data regeneration after the repair is finished. We can see that the average communication cost increases as the error probability increases. In our scheme, when the error probability e is small, the number of symbol retrieves is linear (close to K) then monotonically increases as e
increases. Furthermore, the Baseline scheme is on average 2-3 times more overhead than us. This is because, in the conventional RS coding countermeasure, the original data is first reconstructed and then regenerate the symbol in the failed node. Consequently, it has to access the entire N symbols of the initial data, only to reproduce a small fraction of symbols saved in the failed SN; this greatly increases the transmitted message. Since we conduct incremental RS decoding, it is not surprising that we can reduce such unnecessary transmissions.
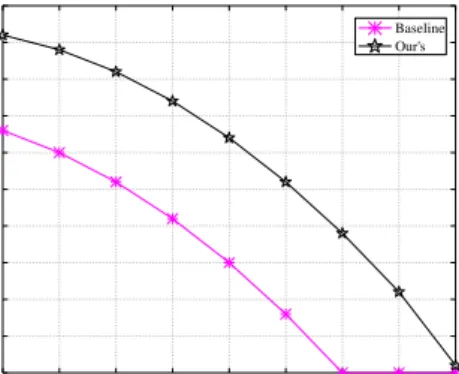
Figure 5 shows the impact of error probability e on the probability of successful decoding Prrec for the above mentioned schemes. As we can see Prrec decreases as e
increases for two schemes. The reason is quite intuitive: the higher error of data, the lower chance of successful decoding. However, the proposed scheme significantly outperforms baseline scheme, even for the high rate case (i.e., e=0.7), the proposed scheme is on average 1-2 times more reliable than Baseline scheme. This is because we ensure that each residual component has more symbols than those correlated failure unaware schemes under the same e, which means that we have more opportunities to reconstruct the original data. Another reason is that we utilize CRC for data integrity check, this can improve the accuracy of data meanwhile decrease the communication overhead, as verified in Figure 4.
0.1 0.2 0.3 0.4 0.5 0.6 0.7 0.8 0.9 0.0 0.1 0.2 0.3 0.4 0.5 0.6 0.7 0.8 0.9 1.0 Pro b abi lit y o f su cc es sfu l d ec o d in g (P rrec )
error probability (e)
Baseline Our's
Figure 5. Probability of Successful Decoding vs. Error Probability
7. Conclusions
This paper proposes an efficient data storage and recovery protocol for distributed storage of cloud computing, which ensures robustness in data distribution and recovery process by efficiently managing data among residual SNs in the network in case of geographically correlated failures. Analysis and performance results show that the proposed scheme has lower overhead when compared with existing works and can accomplish competitive data robustness. Additionally, under scenarios with Byzantine failures, it performs much better than state-of-the-art RS coding scheme. In the future, we will explore the implements of the proposed protocol in real storage systems.
Acknowledgments
The authors acknowledge support from the Natural Science Foundation of Fujian Province (Grant number: 2014J05079), the Scientific Research Foundation of Fujian Provincial Education Department (Grant numbers: JK2013043, JA13248), the Scientific Research Project of Minjiang university (Grant number: YKQ13003), and the Ministry of education of Internet application innovation open platform demonstration base (meteorological cloud platform and application) fund (Grant number: KJRP1301).
References
[1] R. Buyya, C. S. Yeo, S. Venugopal, J. Broberg and I. Brandic, “Cloud computing and emerging IT platforms: vision, hype, and reality for delivering computing as the 5th utility”, Future Generation Computer Systems, vol. 25, no. 6, (2009).
[2] A. Dimakis, V. Prabhakaran and K. Ramchandran, “Decentralized erasure codes for distributed networked storage”, IEEE Transactions on Infromation Theory, vol. 52, no. 6, (2006).
[3] Z. Ruan, X. Sun and W. Liang, Hsiao-Hwa Chen, “Securing sensor data storage and query based on k-out-of-n coding”, International Journal of Communication Systems, vol. 26, no. 5, (2013).
[4] P. Joshi, H. S. Gunawi and K. Sen, “Prefail: A programmable failure-injection framwork”, Techinical
Report No. UCB/EECS-2011-30, (2011) April 22,
http://www.eecs.berkeley.edu/Pubs/TechRps/2011/EECS-2011-30.html.
[5] M. Gallet, N. Yigitbasi, B. Javadi, D. Kondo, A. Iosup and D. Epema, “A model for space-correlated failures in large-scale distributed systems”, Proceedings of the 16th International Conference on Parallel Processing. (2010) August 31-September 3, Berlin, Germany.
[6] R. Rodrigues, B. Liskov, K. Chen, M. Liskov and D. Schultz, “Automatic reconfiguration for large-scale reliable storage systems”, IEEE Transactions on Dependable and Secure Computing, vol. 9, no. 2,
(2012).
[7] J. E. Pezoa and M. M. Hayat, “Reliability of heterogeneous distributed computing systems in the presence of correlated failures”, IEEE Transactions on Parallel and Distributed Computing, vol. 25, no. 4, (2014).
[8] N. Cao, S. Yu, Z. Yang, W. Luo and Y. T. Hou, “Lt codes-based secure and reliable cloud storage service”, Proceedings of 31st IEEE International Conference on Computer Communications (INFOCOM), (2012) March 25-30, Orlando, FL, USA.
[9] G. Liang, B. Sommer and N. Vaidya, “Experimental performance comparison of byzantine fault-tolerant protocols for data centers”, Proceedings of 31st IEEE International Conference on Computer Communications (INFOCOM), (2012) March 25-30, Orlando, FL, USA.
[10] S. Neumayer, G. Zussman, R. Chen and E. Modiano, “Assessing the impact of geographically correlated network failures”, Proceedings of IEEE Military Communications Conference (MILCOM), (2008)
November 16-19, San Diego, CA, USA.
[11] P. Agarwal, A. Efrat, S. Ganjgunte, D. Hay, S. Sankararaman and G. Zussman, “Network vulnerability to single, multiple, and probabilistic physical attacks”, Proceedings of IEEE Military Communications Conference (MILCOM), (2010) October 31-November 3, San Jose, CA, USA.
[12] S. Banerjee, S. Sshirazipourazad and A. Sen, “On-region-based fault fault tolerant design of distributed file storage in networks”, Proceedings of 31st IEEE International Conference on Computer Communications (INFOCOM), (2012) March 25-30, Orlando, FL, USA.
[13] S. Neumayer and E. Modian, “Network reliability with geographically correlated failures”, Proceedings of 29st IEEE International Conference on Computer Communications (INFOCOM), (2010) March 15-19, San Diego, CA, USA.
[14] D. Leong, A. G. Dimakis and T. Ho, “Distributed storage allocations”, IEEE Transactions on Information Theory, vol. 58, no. 7, (2012).
[15] A. Jiang and J. Bruck, “Network file storage with graceful performance degradation”, ACM Transactions on Storage, vol. 1, no. 2, (2005).
[16] M. Sardari, R. Restrepo, F. Fekri and E. Soljanin, “Memory allocation in distributed storage networks”, Proceedings of IEEE International Symposium on Information Theory (ISIT), (2010) June 13-18, Austin, TX, USA.
[17] T. K. Moon, “Error correction coding: mathematical methods and algorithms”, John Wiley & Sons Corporation, New Jersey, (2005).
Authors
Zhiqiang Ruan, is a lecturer at the university of Minjiang University, China. He received the B.S. degree in Computer Science from Fujian Normal University, China, in 2006, the M.S. and Ph.D in Computing Science from Hunan University of Information and Engineering, China, in 2009 and 2012, respectively. His research interests include network and information security, distributed algorithms, Byzantine fault tolerance, and ad hoc wireless networks.
Zhi Li, received the Ph.D. degree from the Graduate University of Chinese Academy of Science, Beijing, China, in 2013. He is currently an Assistant Researcher with the Institute of Information Engineering, China Academy of Science, Beijing, China. His research interests include mobile computing, delay tolerant networks, wireless sensor networks, wireless security, and cloud computing.