693
IJEM
International Journal of Economics and Management Journal homepage: http://www.ijem.upm.edu.my
Openness and Economic Growth in Developing and OECD Countries
JAMILAH IDRIS
a, ZULKORNAIN YUSOP
ab*, MUZAFAR SHAH HABIBULLAH
aAND
LEE CHIN
aaDepartment of Economics, Faculty of Economics and Management, Universiti Putra Malaysia, Malaysia bPutra Business School, Malaysia
ABSTRACT
This study explores the linkage between openness and economic growth in 86 developing and OECD countries from 1977 to 2011, using the Generalized Method of Moments (GMM) estimations. The empirical findings reveal that openness generally promotes economic growth in developing and OECD countries. This is consistent with the endogenous growth theory which states that growth increases with trade openness.
JEL Classification: F10, O40
Keywords: Economic growth, openness, panel data analysis, OECD, developing countries.
Article history:
Received: 30 December 2017 Accepted: 12 August 2018
INTRODUCTION
Trade openness is an important element for economic growth. Interaction with world economies has been proven to be an effective strategy for a nation to achieve impressive economic growth and development (Jamilah et al., 2016). Due to trade openness, many countries have experienced rapid growth in recent decades. Most developing countries are practically open economies, however the benefits of being open have been less obvious for many countries.
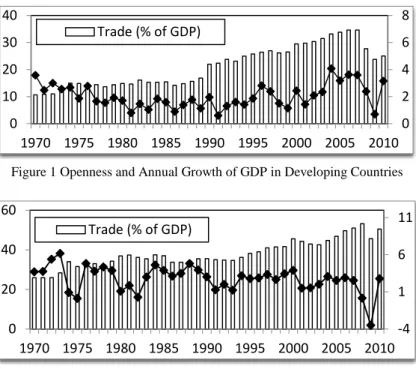
As shown in Figures 1 and 2, the trade shares of GDP in developing and OECD countries expanded from 1970 to 2010. However, the GDP growth rates fluctuated and were opposite from the trade shares of GDP. The growth rate of OECD countries fluctuated around 20%, meanwhile the growth rate for developing countries fluctuated around 10%. Clearly, a higher (or lower) trade level does not necessarily lead to a higher (or lower) economic growth.
Figure 1 Openness and Annual Growth of GDP in Developing Countries
Figure 2 Openness and Annual Growth of GDP in OECD Countries
Previous studies on openness and growth, such as Frankel and Romer (1999), Mukhopadhyay (2000), Kehoe et al. (2011), Das and Paul (2011), Zeren and Ari (2013), provided empirical evidence to support the claim that an open trade policy is associated with economic growth. However, Jin (2000), Vamvakidis (2002) and Almeida and Fernandes (2008), claimed that openness may be detrimental to economic growth. This motivated us to investigate whether the impact of trade openness on economic growth varies for developing and developed countries.
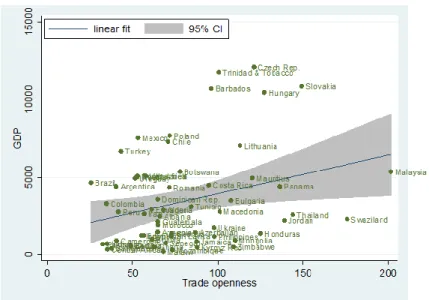
As a preliminary analysis, trade openness and the GDP growth rate for developing and developed countries plotted. As shown in Figures 3 and 4, the trade shares of GDP in developing and OECD countries expanded from 1970 to 2010. The scatter plots depicted in Figures 3 and 4 show the linkage between openness and economic growth for developing countries and OECD countries, respectively. The scatter plots suggest a positive relationship between openness and economic growth. The linear line is steeper in the case of OECD countries compared to the developing countries. This suggests that an expansion in openness prompts a higher growth rate in OECD countries as compared to developing countries. This scenarios imply that different level of economic development as shown by the developing countries as compared to the OECD countries responded differently with respect to trade openness.
0 2 4 6 8 0 10 20 30 40 1970 1975 1980 1985 1990 1995 2000 2005 2010 Trade (% of GDP) -4 1 6 11 0 20 40 60 1970 1975 1980 1985 1990 1995 2000 2005 2010 Trade (% of GDP)
695
Figure 3 The Correlation of Openness and Growth in Developing Countries (2010).
Figure 4The Correlation of Openness and Growth in OECD Countries (2010).
This studyis essential in providing further feedback to past studies, for example Alcala and Ciccone (2004), Sarkar (2007), Chang et al. (2009), Marelli and Signorelli (2011), Zarra-Nezhad et al. (2014) and Nowbutsing (2014) which confirmed the positive impact of trade on economic growth. In contrast, Ulaşan (2015) found no support for the trade led growth hypothesis. In the case of developing countries, Fenira (2015) concluded a weak relationship between trade openness and economic growth. Some studies have explored the nexus of trade growth, for example Rassekh (2007) and Dufrenot et al. (2010). Rassekh (2007) applied the trade growth nexus for 150 countries and reported that the low income countries benefitted more from international trade as compared to high income economies. Meanwhile, Dufrenot et al. (2010) offered proof that the impact of openness on growth in low growth countries was higher than in high growth countries. They used quantile regression approach for 75 developing countries. Moreover, Were (2015) found that trade applied a positive significant impact on the growth rate in developed and developing countries, yet its impact was not significant for developing countries which to a great extent incorporated African nations.
On the other hand, to see whether the linkages of trade income varied with the level of economic development, Kim et al. (2011) used instrumental variable approach in their study. In higher income countries, they offered proof that capital accumulation, financial and economic development had positive effects. However, the effect was significantly negative in lower income countries. In terms of real income, Kim (2011) reported that openness to trade in develop countries has positive impacts on economic growth meanwhile, in developing countries it had a negative impact. Besides, Kim et al. (2011) reported that trade promoted economic growth in which countries which had low inflation, high income and were non-agricultural but the impact had a negative effect in countries with the opposite attributes.
To investigate a causal connection between trade and economic growth, Sakyi et al. (2015) offered confirmation of a positive bi-directional connection for the sample of 115 developing countries. In an investigation of China, Hye et al. (2016) demonstrated that trade openness was positively related to growth in both the long and short run.
In the present study we examined the effect of trade openness on economic growth in developing and OECD countries using two-step system generalized method of moments (GMM) estimator. The sample period spanned from 1977 to 2011 where the sample was divided into developing and OECD (advanced) countries. This study contributes to existing literature by using the system GMM estimators to address the endogeneity and simultaneity problems. Previous studies have shown conflicting conclusions and mixed results across countries and methodologies. In addition, developing countries and OECD countries are treated separately in this study.
This paper is organized as follows: Section 1 presents the introduction and review the existing literatures. Section 2 lays out the empirical model, the estimation method and the sources of data. Section 3 contains a discussion of the empirical findings as well as the robustness checks. Section 4 provides a summary and conclusions.
EMPIRICAL MODEL AND ECONOMETRIC METHODOLOGY
The GMM estimator was employed to analyse panel data of developing and OECD countries between the years of 1977 to 2011. The theoretical growth approach was initially based on the basic Solow model (1956) which was later utilised by Mankiw et al. (1992). The openness to trade is one of the tools for innovation, as supported by Gundlach (2005), who consolidated this presumption in the expanded Solow model. For this study, the model closely follows Alcala and Ciccone (2004) and Dollar and Kraay (2003), with some modification as follow:
𝐺𝐷𝑃𝑖𝑡 = ∝0+ ∝1𝐼𝑛𝑖𝑡𝑖𝑎𝑙𝑖𝑡+ ∝2( 𝑇𝑂
𝑅𝑂) 𝑖𝑡+ ∝3𝐺𝑂𝑉𝑖𝑡+ ∝4𝐹𝐷𝐼𝑖𝑡 + ∝5𝑇𝐹𝑃𝑖𝑡 + ∝6𝐺𝐶𝐹𝑖𝑡 + ∝7𝐻𝐶𝑖𝑡+ ᶙ𝑖𝑡 (1)
where 𝐺𝐷𝑃𝑖𝑡 is the real per capita Gross Domestic Product, 𝐼𝑛𝑖𝑡𝑖𝑎𝑙𝑖𝑡 is the initial income, 𝑇𝑂𝑖𝑡 is the openness
to trade in nominal / 𝑅𝑂𝑖𝑡 is exports plus imports divided by purchasing power parity adjusted GDP (real GDP), 𝐺𝑂𝑉𝑖𝑡
is the government expenditure, 𝐺𝐶𝐹𝑖𝑡 is the gross capital formation, 𝐹𝐷𝐼𝑖𝑡 is the foreign direct investment, measured
by FDI inflows (% of GDP), 𝑇𝐹𝑃𝑖𝑡 is the total factor productivity and 𝐻𝐶𝑖𝑡 is the human capital. Economic growth as
a dependent variable is measured by the real GDP per capita (in constant 2010 US dollars). The benefits of trade openness on growth have been evident in cross sectional studies, such as Zeren and Ari (2013) and Kehoe et al. (2011) which used GDP per capita as the dependent variable. We estimated the effect of trade on growth by using 2 proxies for openness which were the trade openness ratio (TO) and the real openness (RO). The trade openness ratio (TO) is usually represented by nominal exports plus nominal imports divided by nominal GDP. Meanwhile the real openness (RO) is exports plus imports divided by purchasing power parity adjusted GDP (real GDP). The other independent variables i.e. government expenditure, FDI and total factor productivity are also expressed as a ratio of GDP. Educational attainment represents human capital (HC), which was obtained from the Barro and Lee (1993) datasets.
The econometric method used to estimate Equation (1) is based on the dynamic panel GMM estimator that was suggested by Arellano and Bond (1991) and was developed further by Arellano and Bover (1995) and Blundell and Bond (1998). The GMM estimator was intended for panel data with a small T and a vast N. Due to the estimator being widely applied in existing literature, only a short explanation is presented here. This estimator was selected because of the need to address country-specific effects and the simultaneity bias.
Arellano and Bond (1991) suggested transforming Equation (1) into a first difference to remove the country-specific effect and to use the lagged levels of the regressors as instruments to eliminate the simultaneity bias. Nevertheless, according to Arellano and Bover (1995), this type of modelling strategy might lead to incorrect inferences if the explanatory variables are persistent. To rectify this problem, Blundell and Bond (1998) proposed a system GMM estimator in which the level and difference equations were combined. The lagged differences of the regressors were then used as additional instruments for a level equation. They illustrated that this type of modelling strategy could reduce the biases and imprecision linked to the difference estimator.
There are two variants of the GMM estimator, the one- and the two-step estimators. Theoretically, the two-step estimator is more efficient than the one-step estimator because it uses optimal weighting matrices. This study applied the two-step GMM estimator to examine the effect of trade openness and economic growth. The consistency of the GMM estimator depends on two specification tests, the Hansen test of overidentifying restrictions and an autocorrelation test on the disturbances (Arellano and Bond, 1991). Failure to reject the null of the Hansen test implies that the instruments are valid and the model is correctly specified. With respect to the autocorrelation test, it should
697
reject the null of the absence of the first-order autocorrelation (AR1) and not reject the absence of the second-order autocorrelation (AR2).
Table 1 presents the descriptive statistics of the variables that provided the standard deviations, means, minimum and maximum values of the variables. The list of countries incorporated this study are presented in the Appendix.
Table 1 Descriptive Statistics for All Countries, Developing and OECD Countries All Countries
Variable Mean Std. Dev. Min Max
GDP per capita 10727.1 14570 17.0082 83216.7
Trade Openness 70.4 39.4469 6.3203 333.532
Real Openness 66.5 40.7422 10.606 314.538
Government Expenditure 15.5594 5.32941 0.01371 30.4005 Foreign Direct Investment 3.80127 6.53709 0.00000 83.0646 Total Factor Productivity 0.67338 0.26047 0.17216 1.87748 Gross Capital Formation 22.9179 6.40256 4.12109 69.9559
Human Capital 2.43099 0.59843 1.13532 7.674
Developing Countries
Variable Mean Std. Dev. Min Max
GDP per capita 2883.94 2647.68 156.742 14438.4
Trade Openness 67.4513 35.5984 6.3203 220.409
Real Openness 66.4681 36.6366 10.606 201.442
Government Expenditure 14.1157 4.63516 3.9976 30.4005 Foreign Direct Investment 3.51522 4.49211 2.05E-08 38.1683 Total Factor Productivity 0.57295 0.251 0.17216 1.87748 Gross Capital Formation 22.9587 7.24499 4.12109 69.9559
Human Capital 2.24271 0.59578 1.13532 7.674
OECD Countries
Variable Mean Std. Dev. Min Max
GDP per capita 26634.2 15741.6 17.0082 83216.7
Trade Openness 76.3726 45.6178 9.1023 333.532
Real Openness 65.2509 47.8604 10.606 314.538
Government Expenditure 18.3391 5.50668 0.01371 28.7537 Foreign Direct Investment 4.25808 9.29931 0.02409 83.0646 Total Factor Productivity 0.85131 0.16819 0.23118 1.28594 Gross Capital Formation 22.7447 4.0968 11.0462 37.845
Human Capital 2.77466 0.41941 1.53433 3.60817
EMPIRICAL FINDINGS
The empirical results of Equation (1) are presented in Tables 2, 3 and 4 which indicated that for all 86 countries, both developing and OECD countries, openness prompted higher economic growth. The outcomes strongly supported the hypothesis that openness tends to leads to higher growth. This is consistent with the theory of endogenous growth. The statistical significance of FDI demonstrated that FDI is vital for economic development, affirming past empirical works, such as Dollar and Kraay (2002). The findings additionally demonstrated that free trade is useful for TFP. The result for developing countries was quite robust, which indicated that openness to trade leads to better economic growth. Our study showed that TFP, FDI, HC and GCF were statistically significant determinants of economic growth. The negative impact of government expenditure on economic growth was in line with Fan and Rao (2003), who found that safeguard consumption had an exceptionally solid negative effect on monetary development in Africa and Latin America. The negative effect of government spending was suggested by poor people or an irrelevant level of GCF. In the OECD countries, trade openness was also found to contribute to higher growth and development. For OECD countries, it was found that government spending essentially advanced development in the OECD countries.
As shown in Tables 2, 3 and 4 the first and second order autocorrelation of residuals revealed asymptotic standard ordinary of AR(1) and AR(2) distribution values. For the first order AR(1), the test for autocorrelation rejected the hypothesis of invalid p-estimations. The Arellano and Bond measurements were critical at the 5 to 10 percent level. Though, the AR(2) test for order autocorrelation (second) neglected the null hypothesis to dismiss of no autocorrelation. Subsequently, AR(1) with AR(2) was used to tests the legitimacy of the framework estimator for the GMM estimator. The statistics and the p-values gave the likelihood of accurately dismissing no autocorrelation in the null hypothesis. The Hansen test demonstrated that the over identifying restrictions were valid. The joint importance based on the Walt test for the regressors demonstrated a measurable essentialness at the 5 per cent level.
Table 2 The Result of Openness and Growth in All Countries of Interest.
Independent Variables: Dependent Variable Gdpt
Gdpt-1 0.8911*** 0.9128*** (0.0221) (0.0220) TOt 0.2412*** (0.0542) ROt 0.1377*** (0.0482) Govt 0.0181 0.0012 (0.0433) (0.0534) Fdit 0.0456** 0.0506** (0.0197) (0.0232) Tfpt 0.2217*** 0.1834** (0.0852) (0.0879) Gcft 0.0130** 0.0147** (0.0066) (0.0061) Hct -0.0163 -0.0184 (0.0272) (0.0288) Constant -1.4952* -1.0195 (0.8521) (0.9665) Diagnostic Test: Observation 378 378 AR(1) - 2.46** - 1.71* AR(2) - 1.73* - 1.92* Hansen Test 0.2400 0.1830
Notes: The figures in parentheses are standard errors. Asterisks ***, **, * denote statistical significance at the 1%, 5% and 10% levels, respectively.
Table 2 shows the results that the trade openness ratio (TO) and real openness (RO) significantly and positively influenced the level of GDP per capita (Gdp) at the 1 percent level. The estimated result showed that for all countries, Foreign Direct Investment (Fdi), Total Factor Productivity (Tfp) and Gross Capital Formation (Gcf) significantly and positively influenced the level of GDP per capita at least at the 5 percent level. Meanwhile, the government expenditure (Gov) was insignificant even though the sign was positive and human capital (Hc) was insignificant with a negative sign.
Table 2 reported a significant and positive coefficient for trade openness (TO) and (RO) at the 1% level. The coefficients of 0.2412 and 0.1377 implied that a 1% increase in trade shares would increase the GDP per capita by 0.24% and 0.14% annually. Hence, these results provided substantial evidence to support the hypotheses that a changes in openness causes higher economic growth. These findings are similar to the studies carried out by Grossman and Helpman (1991) and Sala-i-Martin (1997). The significant and positive coefficients for both Fdi and Gcf, respectively, suggested that FDI and domestic capital are equally important in explaining the growth differences across countries.
According to the result in Table 3 for developing countries, openness positively and significantly affected GDP at the 5% level. The finding indicated that openness leads to higher economic growth after controlling for government expenditure (Gov), foreign direct investment (Fdi), total factor productivity (Tfp), gross capital formation (Gcf) and human capital (Hc). These findings also confirmed other studies in existing literature which concluded that openness positively affected economic growth such as Frankel et al. (1999) and Dollar and Kraay (2003).
Table 3 The Result of Openness and Growth in Developing Countries
Independent Variables: Dependent Variable Gdpt Gdpt-1 0.8460*** 0.8600*** (0.0455) (0.0345) TOt 0.1057** (0.0515) ROt 0.1033** (0.0442) Govt -0.1036*** -0.0763*** (0.0346) (0.0297) Fdit 0.0835*** 0.0798*** (0.0234) (0.0251) Tfpt 0.3474*** 0.2873*** (0.0881) (0.0646) Gcft 0.0092 0.0093 (0.0101) (0.0104) Hct 0.0533*** 0.0337** (0.0202) (0.0170) Constant 1.2358* 0.6476 (0.6449) (0.5607) Diagnostic Test: Observation 239 239 AR(1) - 2.23** - 1.77* AR(2) - 1.71* - 1.63 Hansen Test 0.9720 0.9610
699
Trade promotes growth in external markets which ensures a better allocation of resources and promote the orientation of investments towards exporting sectors. The exporting sectors by development strategies are focused on domestic markets. Furthermore, trade liberalisation would, therefore correct these distortions and promote the optimal allocation of resources and investment. It would also revive economic growth and enable developing economies to play a more competitive role in a globalised world.
The positive impact of openness on growth was also reported by Iftikhar (2012). Trade openness promotes growth in several ways. Openness creates massive benefits, increases investments as a result of enlarged markets, economies of scale, the flow of information, technology and knowledge spill overs. Thus, in turn, it creates an efficient utilisation of resources, improved technological efficiency and trade facilitation that returns in higher foreign exchange which is used to expand the less developed sectors of the economy.
In terms of the independent variables, the significance of Foreign Direct Investment (Fdi) indicated that FDI is important to enhance growth. These findings confirmed the results of previous empirical works such as Sala-i-Martin (1995). In addition, TFP and HC proved beneficial to growth a highly significant level. The negative impact of government expenditure (Gov) implied that governments may respond to greater openness by increasing expenditure on certain functional categories which do not really lead to growth. A study carried out by Fan and Rao (2003) found that defence expenditure had a very strong negative impact on economic growth in Africa and Latin America. The impact of a negative sign for government spending can be seen from the poor or insignificant level of Gross Capital Formation (Gcf) in this study as shown in Table 3.
The results for OECD countries are reported in Table 4. The panel result showed that the two step estimator seemed to be more consistent, the two step estimator was robust again showing that trade openness was positively related to growth. The trade openness (TO) and (RO) were significant at the 1 percent and the 5 percent levels. In column 1 (TO), all of the independent variables are insignificant. This indicated that none of these variables were the main factors for growth in the OECD countries.
Table 4: The Result of Openness and Growth in OECD Countries
Independent Variables: Dependent Variable Gdpt
Gdpt-1 0.9598*** 0.9397*** (0.0141) (0.0186) TOt 0.0671*** (0.0324) ROt 0.0870)** (0.0429) Govt 0.0371 0.0754*** (0.0242) (0.0254) Fdit -0.0147 -0.0159 (0.0162) (0.0256) Tfpt 0.0122 0.0266 (0.0541) (0.0593) Gcft 0.0000 0.0027 (0.0063) (0.0057) Hct -0.0119 -0.0425 (0.0133) (0.0270) Constant -1.3062 -0.9896)** (0.3993) (0.5041) Diagnostic Test: Observation 139 139 AR(1) -3.38*** -3.07*** AR(2) -0.92 -0.42 Hansen Test 1.0000 1.0000
Notes: The figures in parentheses are standard errors. Asterisks ***, **, * denote statistical significance at the 1%, 5% and 10% levels respectively.
However, in column 2 (RO), only the government expenditure (Gov) was highly significant at the 1 percent level. The positive sign and significance of trade openness and growth in OECD countries showed that openness was the engine of growth in developing countries and also an important factor contributing to growth in developed countries (Dar and Amirkhalkhali, 2003). Due to openness, the growth and industrialisation observed in countries that has been realised in the form of external learning. This happened together with an increase in trade. Thus, the export-led growth hypothesis in the neoclassical approach has been advocated to be valid. This result is achieved by an increase in productivity through exports.
The positive and significant level of government expenditure (Gov) in OECD countries indicated that government expenditure played a major role in OECD countries in order to spur growth. In endogenous growth models, some elements of tax and government expenditure play a role in the growth process. Several papers have extended the
analysis of taxation, public expenditure and growth, demonstrating various conditions under which fiscal variables can affect long-run growth, for example, Stokey and Rebelo (1995) and Mendoza et al. (1997).
Our diagnostic test results for Tables 2, 3 and 4 suggested that the test of the first and second order autocorrelation of residuals, reported the asymptotically standard normal distribution values of AR (1) and AR (2). Tables 2, 3 and 4 showed the test for first order autocorrelation AR (1) rejected the null; the p-values of the Arrelano and Bond statistics at the 5 percent and the 10 percent significance levels. The test for second order autocorrelation AR (2) failed to reject the null hypothesis of no autocorrelation. The p-values and the statistics reported gave the probability of correctly rejecting the null hypothesis of no autocorrelation. Hence, both AR (1) and AR (2) test supported the validity of the system GMM estimator. The p-values of the Hansen test showed as insignificant, meaning that the model did not suffer from over identification. Hence, the model was deemed reliable since it passed all diagnostic tests.
CONCLUSION
The empirical findings demonstrated that trade openness promotes economic growth in developing and OECD countries. The magnitude of trade openness to enhance growth is higher in developing countries than in OECD countries. A few policy implications can be drawn from the findings. To start with, both developing and developed countries ought to maintain open trade policies and reduce trade barriers. An openness to trade uncovers nearby markets to worldwide competition which encourages investment and innovation. International competition leads to better TFP and local firms will concentrate more on human capital improvement to expand their competitiveness. In the case of developing countries, they should consider FDI due to its positive impact on growth. Government expenditure may negatively affect growth. Along these lines, developing countries should apply prudent steps to keep away from the negative effect of indiscreet government spending.
For OECD countries, trade openness should continue enhancing the economies. Our findings demonstrates that the government expenditure significantly promotes growth in OECD countries. Consequently, government spending can be expanded to advance economic growth.
Taking everything into account, our precise empirical investigation has achieved an indisputable outcome with cross-sectional specifications. As in many past studies on openness and growth issues, openness is found to be a significant positive coefficient, which infers that openness to trade is advantageous for growth. Trade openness is helpful in elevating growth by prompting lower costs, better data and fresher advances. In any case, trade openness policies must be joined by proper integral arrangements, for example, venture, training, budgetary and macroeconomic strategies to ensure that solid development comes about.
REFERENCES
Akilou, A. (2013). “Is there a causal relation between trade openness and economic growth in the WAEMU countries?”,
International Journal of Economics and Finance, Vol. 5, pp. 151-156.
Alcala, F. and Ciccone, A. (2004), “Trade and productivity”, The Quarterly Journal of Economics, Vol. 119, pp. 613-646.
Almeida, R. and Fernandes, A.M. (2008), “Openness and technological innovations in developing countries: Evidence from Firm-Level Surveys”, The Journal of Development Studies, Vol. 44 No. 5, pp. 701-727.
Arbix, G., and Laplane, M. (2003), “Stagnation, liberalization and foreign investment in Latin America.” Competition and Change, Vol. 7 No. 2-3, pp. 113-125.
Arellano, M. and Bond, S. (1991), “Some tests of specification for panel data: Monte Carlo evidence and an application to employment equations”, Review of Economic Studies, Vol. 58, pp. 277-297.
Blundell, R. and Bond, S. (1998), “Initial conditions and moment restrictions in dynamic panel data models”, Journal of Econometrics, Vol. 87, pp. 115–143.
Barro, Robert J., and Jong-Wha Lee. (1993), “International comparisons of educational attainment”, Journal of Monetary Economics, Vol. 32, No. 3, pp. 363-394.
Chang, R., Kaltani, L., and Loayza, N.V. (2009), “Openness can be good for growth: The role of policy complementarities”,
701
Dar, A., and Amirkhalkhali, S. (2003), “On the impact of trade openness on growth: Further evidence from OECD countries”,
Applied Economics, Vol. 35, pp. 1761-1766.
Das, A., and Paul, B.P. (2011), “Openness and growth in emerging Asian economies: Evidence from GMM estimations of a dynamic panel”, Economics Bulletin, Vol. 31, pp. 2219–2228.
Dollar, D. and Kraay, A. (2002), “Growth is good for the poor”, Development Research Group, World Bank. Washington, DC.
Dollar, D. and Kraay, A.(2003), “Institutions, trade, and growth,” Journal of Monetary Economics, Vol. 50, pp. 133–162.
Dufrenot, G., Mignon, V., and Tsangarides, C. (2010), “The trade-growth nexus in the developing countries: A quantile regression approach”, Review of World Economics, Vol. 146, pp. 731–761.
Fan, S., and Rao, N. (2003), “Public spending in developing countries: Trend, determination and impact.” EPTD Discussion Paper No. 99, Washington, D.C.: International Food Policy Research Institute.
Fenira, M. (2015), “Trade openness and growth in developing countries: An analysis of the relationship after comparing trade indicators”, Asian Economic and Financial Review, Vol. 5, pp. 468–482.
Frankel, J.A. and Romer, D. (1999), “Does trade cause growth?” American Economic Review, Vol. 89, No. 3, pp. 379–399.
Gundlach, E. (2005), “Solow vs. Solow: Notes on identification and interpretation in the empirics of growth and development”, Review of World Economics, Vol. 141 No. 3, pp. 541-556.
Grossman, G. and Helpman, E. (1991), “Innovation and Growth in the Global Economy”, Cambridge, MA: The MIT Press. Hansen, L. (1982). “Large sample properties of generalized method of moment’s estimators.” Econometrica, Vol. 50, pp.
1029-1054.
Hye, Q. M., Wizarat, S. and Lau, W.Y. (2016), “The impact of trade openness on economic growth in China: An empirical analysis”, The Journal of Asian Finance, Economics and Business, Vol. 3, pp. 27–37.
Iftikhar, A. (2012), “Trade liberalization and economic growth: What’s the empirical relationship in Bangladesh?”, Journal of Business and Management, Vol. 1, No. 6, pp. 23-33.
Jamilah Idris, Zulkornain Yusop and Muzafar Shah Habibullah. (2016), “Trade Openness and Economic Growth: A Causality Test in Panel Perspective”, International Journal of Business and Society, Vol. 17, No. 2, pp. 281-290.
Jin, J.C. (2000), “Openness and growth: An interpretation of empirical evidence from East Asian countries”, The Journal of International Trade and Economic Development, Vol. 9, pp. 5-17.
Kehoe, Timothy J., and Felipe Meza, (2011), “Catch-up growth followed by stagnation: Mexico, 1950–2010”, Latin American Journal of Economics, Vol. 48, pp. 227–68.
Kim, D.H. (2011), “Trade, growth and income”, The Journal of International Trade and Economic Development, Vol. 20, pp. 677–709.
Kim, D.H., Lin, S.C., and Suen, Y.B. (2011). Nonlinearity between trade openness and economic development. Review of Development Economics, Vol. 15, pp. 279–292.
Kim, D.H., Lin, S.C., and Suen, Y.B. (2012). “The simultaneous evolution of economic growth, financial development and trade openness”, The Journal of International Trade & Economic Development, Vol. 21, No. 4, pp. 513-537.
Mankiw, N.G., Romer, D. and Weil, D.N. (1992), “A contribution to the empirics of economic growth”, Quarterly Journal of Economics, Vol. 107, No. 2, pp. 407- 437.
Marelli, E. and Signorelli, M. (2011), “China and India: Openness, trade and effects on economic growth”, The European Journal of Comparative Economics, Vol. 8, pp. 129–154.
Mendoza, E.G., Milesi-Ferretti, G.M., and Asea, P., (1997), “On the ineffectiveness of tax policy in altering long run growth: Harberger's superneutrality conjecture”, Journal of Public Economics, Vol. 66, pp. 99-126.
Mukhopadhyay, H. (2000), “Does trade reform distort domestic ratio.” Paper Presented in the Conference to Honour Professor K. L. Krishna, Centre for Development Economics, Delhi School of Economics.
Nowbutsing, B.M. (2014), “The impact of openness on economic growth: Case of Indian Ocean rim countries”, Journal of Economics and Development Studies, Vol. 2, pp. 407–427.
Rassekh, F. (2007), “Is international trade more beneficial to lower income economies? An empirical inquiry”, Review of Development Economics, Vol. 11, No. 1, pp. 159–169.
Roodman, D. (2006). How to do xtabond2: An introduction to “difference” and “system” GMM in Stata (Working paper no. 103). Washington, DC: Center for Global Development.
Sakyi, D., Villaverde, J. and Maza, A. (2015), “Trade openness, income levels, and economic growth: The case of developing countries, 1970–2009”, The Journal of International Trade & Economic Development, Vol. 24, No. , pp. 860–882.
Sala-i-Martin, X. (1997). “I just run two million regressions”, American Economic Review, Vol. 87, pp. 178-183. Sarkar, P. (2007). “Trade openness and growth: Is there any link?” MPRA Paper No. 4997.
Solow, R.M. (1956), “A contribution to the Theory of Economic Growth”, Quarterly Journal of Economics, Vol. 70 No. 1, pp. 65 − 94.
Stokey, N.L., and Rebelo, S. (1995), “Growth Effects of Flat-Rate Taxes”, Journal of Political Economy, Vol. 103, pp. 419 - 450.
Ulaşan, B. (2015), “Trade openness and economic growth: Panel evidence”, Applied Economics Letters, Vol. 22, pp. 163– 167.
United Nations. (2014). Global governance and policy space for development. Trade and Development Report, 2014. New York and Geneva: United Nations.
Vamvakidis, A. (2002), “How robust is the growth-openness connection: Historical evidence”, Journal of Economic Growth,
Vol. 7, pp. 57–80.
Were, M. (2015), “Differential effects of trade on economic growth and investment: A cross-country empirical investigation”,
Journal of African Trade, Vol. 2, pp. 71–85.
Zarra-Nezhad, M., Hosseinpour, F., and Arman, S.A. (2014), “Trade-growth nexus in developing and developed countries: An application of extreme bounds analysis”, Asian Economic and Financial Review, Vol. 4, pp. 915–929.
Zeren, F., and Ari, A. (2013), “Trade openness and economic growth: A panel causality test”, International Journal of Business and Social Science, Vol. 4, pp. 317-324.
APPENDIX
The selected developing countries included in the analysis: Albania, Armenia, Algeria, Azerbaijan, Argentina, Bangladesh, Barbados, Benin, Bolivia, Botswana, Brazil, Bulgaria, Cameroon, Central Africa, Chile, Colombia, Costa Rica, Czech Republic, Dominican Republic, Ecuador, Egypt, Georgia, Ghana, Guatemala, Honduras, India, Indonesia, Iran, Jamaica, Jordan, Kyrgyz Republic, Lithuania, Macedonia, Malawi, Malaysia, Mauritius, Mexico, Mongolia, Morocco, Mozambique, Pakistan, Panama, Peru, Philippines, Romania, Russia, Senegal, Slovak Republic, South Africa, Sri Lanka, Thailand, Trinidad and Tobago, Tunisia, Turkey, Ukraine, Uruguay, Venezuela, Zambia, Zimbabwe.
The selected OECD countries included in the analysis: Australia, Austria, Azerbaijan, Belgium, Canada, Denmark, Finland, France, German, Greece, Hungary, Iceland, Ireland, Italy, Japan, Korea, Luxembourg, Netherlands, New Zealand, Norway, Poland, Portugal, Spain, Swaziland, Sweden, Switzerland, United Kingdom and United States.