Mass Spectrometry for the Analysis o f
Overlapping Fingerprints and Inks
by
Nicholas J. Bright
UNIVERSITY OF
SURREY
Supervised by
Melanie J. Bailey,
Karen J. Kirkby
&
Neil I. Ward
Submitted for the degree of Doctor of Philosophy
Faculty of Engineering and Physical Sciences
Advanced Technology Institute
University of Surrey
September 2012
© Nicholas J. Bright 2012
All rights r e se r v e d INFORMATION TO ALL USERS
The q u a lity of this r e p r o d u c tio n is d e p e n d e n t u p o n the q u a lity of the c o p y s u b m itte d . In the unlikely e v e n t that the a u th o r did not sen d a c o m p l e t e m a n u scrip t
and there are m issing p a g e s , th e se will be n o t e d . Also, if m a teria l had to be r e m o v e d , a n o t e will in d ic a te the d e le t io n .
uest
P ro Q u est 27558389
Published by ProQ uest LLO (2019). C o p y rig h t of the Dissertation is held by the Author.
All rights r eserv ed .
This work is p r o te c te d a g a in s t u n a u th o riz ed c o p y in g under Title 17, United S ta tes C o d e M icroform Edition © ProQ uest LLO.
ProQ uest LLO.
7 8 9 East Eisenhow er Parkway P.Q. Box 1346
Summary
Using the technology available to forensic investigators today, it is not currently possible to distinguish (with certainty) whether a fingerprint is above or below a layer of ink. This has implications where a suspect’s fingerprint may be found on a document, but they claim to have handled the paper before any ink was put down on
the paper, e.g. “I only put the paper in the drawer”. Furthermore, most of the
techniques destroy the sample, which in a forensic context is not recommended. Fundamental experiments analysing fingerprints and inks on basic substrates such as silicon and paper have been carried out. A protocol for determining the deposition order o f overlapping undeveloped fingerprints and inks using time-of-flight secondary ion mass spectrometry (ToF-SIMS) has been developed. The developed protocol is based on using the normalised standard deviation of the intensity of an ink line, where that ink line overlaps with a fingerprint. This method produces a numerical value for the sample, thereby removing any potential human error in judgement when imaging the sample alone. After further testing it was shown that
this first protocol was not robust.
A new method and protocol was developed based upon using the entirety of the data produced in the secondary ion image. This new protocol is based upon using the fingerprint ridge pattern as a mask on the ink line signal, rather than using line scans, which are less representative of the data collected. Further research revealed that when samples involving a fingerprint overlapping with ink are chemically developed the ability of the protocol to identify the deposition order was affected. In some samples, the chemical development process appears to have had a positive effect on the protocol. The results presented indicate that diazafluoren-9-one immersion could be used preferentially over ninhydrin when investigating questioned documents. These results could affect the order in which forensic investigators use different chemical development techniques to analyse evidence. Currently it is common practice to use more than one technique to develop fingerprints. The results presented
could lead to recommendations about the order in which chemical development techniques are used.
Techniques, such as ToF-SIMS, require the use of a vacuum chamber into which the sample is placed for analysis. Currently, there is no published literature on the effect that low pressures systems (such as vacuum chambers) have on the chemistry of fingerprints. This research shows that pressures as low as 2x10'^ Torr have the ability to remove 20-26% (depending on the exact pressure) of a fingerprint’s mass. This suggests it would be beneficial to develop high pressure systems in order to carry out analyses in order to detect all chemical species present in a sample. It was also found that some vacuum chambers can in fact add mass to a sample (believed to be from chemical contamination).
Supervisors: Melanie J. Bailey Karen J. Kirkby Neil I. Ward
Declaration
This thesis and the work to which it refers are the results of own efforts. Any ideas, data, images or text resulting from the work of others (whether published or unpublished) are fully identified as such within the work and attributed to their originator in the text, bibliography or in footnotes. This thesis has not been submitted in whole or in part for any other academic degree or professional qualification. I agree that the University has the right to submit my work to the plagiarism detection service TumitinUK for originality checks. Whether or not drafts have been so- assessed, the University reserves the right to require an electronic version of the final document (as submitted) for assessment as above.
Nicholas J. Bright
Acknowledgments
I would like to thank Steve Hinder for training me on the ToF-SIMS instrument and then for the many, many hours of assistance when something went wrong and for helping interpreting data. Thank you to John Watts and Marie-Laure Abel for their help in interpreting data and proof-reading papers and reports.
To those in the ion beam centre who stopped me getting zapped with radiation: Brian Jones, Luke Antwiss, Chris and Charlie Jeynes, they all deserve recognition for providing assistance when I was trying to access different bits of equipment.
Thanks go to Dan Driscoll and Sub Reddy for guidance on GC-MS and QCM respectively. Thank you to Terry Willson who actually carried out the GC-MS analysis of fingerprints. To all the “anonymous” fingerprint donors who have provided me with fingerprints to analyse, thank you.
From the Home Office (CAST) I would like to thank Jona Ramadani and in particular Steve Bleay, for providing valuable insight and guidance on how to steer some of this research, in order to make it applicable to real forensic cases.
A big thank you to Roger Webb who stepped in to help in my supervision when Mel was on maternity cover. His guidance led to opening many avenues of investigation to expand into. I would like to thank Karen Kirkby for offering me the PhD studentship, as without that I can safely say I wouldn’t be here today! Also for providing guidance and assistance especially with regards to University regulations and policy.
“Uncle Neil” (Ward) also deserves recognition as it was his suggestion that I carry out a PhD in the first place. He has also been there to listen to my moaning about academic life and kept me faithful to my analytical chemistry origins.
A massive thank you goes to Melanie Bailey who was responsible for the day-to-day supervision of this work, for showing me the way physicists do things (and for
respecting how chemists do things) and for generally providing direction and guidance for my time researching.
Finally, a thank you to my wonderful fiancée Vicky, who has had to put up with me over the past 3 years, supporting me in too many ways to mention.
I include a quote from an American maths teacher who was on an exchange at my school during my A-Levels and it felt quite apt for this PhD ...
"When you're up to your ass in alligators,
remember you're there to drain the swamp"
Glossary of Main Terms
ATR-FTIR CAST DESI DFO DMAC DNA BDX BSDA ESI FIB FP GC GHB LDI LMIG MALDI M eV-SM S MS PET PIXE PVC QCM RBS SEM TEC ToF-SIMS VMDAttenuated total reflection - Fourier transform infra-red (spectroscopy)
Centre for Applied Science and Technology Desorption electrospray ionisation
Diazafluoren-9-one Dimethylcinnamaldehyde Deoxyribonucleic acid Energy dispersive X-ray
Electrostatic detection apparatus Electrospray ionization
Focussed ion beam Fingerprint
Gas chromatography
Gûfwma-hydroxybutyric acid Laser desorption ionization Liquid metal ion gun
Matrix assisted laser desorption ionization High energy secondary ion mass spectrometry Mass spectrometry
Poly(ethylene terephthalate) Particle induced X-ray emission Poly(vinyl chloride)
Quartz crystal microbalance Rutherford backscattering Scanning electron microscopy Thin layer chromatography
Time-of-flight secondary ion mass spectrometry Vacuum metal deposition
List of Figures
Figure 1-1: (a) Photo of an indented fingerprint (b) Photo of a visible fingerprint (in blood) (c) Photo of a latent fingerprint developed using ninhydrin. [3-5]...2 Figure 1-2: Set up of a desorption electrospray ionisation instrument coupled
with a mass spectrometer (DESI-MS) [33]... 6 Figure 1-3: Desorption electrospray ionisation image of the distribution of
cocaine on a latent fingerprint blotted on glass (modified with the addition of a scale bar) [35]...8 Figure 1-4: Desorption electrospray ionisation images of a forged number on
paper [36]... 9 Figure 1-5: Ion images showing (from left to right) the presence of aluminium
{m/z 26.98), amphetamine {m/z 77.04, 91.05 and 136.11) and the total ion
image [45]... 11
Figure 1-6: Time-of-flight-secondary ion mass spectrometry (ToF-SIMS)
secondary ion image of ink printed on coated paper [50]...13 Figure 1-7: Time-of-flight-secondary ion mass spectrometry (ToF-SIMS) ion
images from a black fountain pen ink and a blue ballpoint pen ink (M: 349 = black fountain pen ink, M: 358 = blue ballpoint pen ink). The ballpoint pen ink was deposited immediately after the fountain pen ink was written [53]...15 Figure 1-8: Time-of-flight-secondary ion mass spectrometry (ToF-SIMS) ion
images from a black fountain pen ink and a blue ballpoint pen ink (M: 349 = black fountain pen ink, M: 358 = blue ballpoint pen ink). The black fountain pen ink was allowed to dry for one and a half hours before the blue ballpoint pen ink was deposited [53]...15
Figure 1-9: Spatial maps of ions, generated via MeV SIMS o f (a) paper; (b)
fingerprint residue; (c) ink and overlays thereof in (d) fingerprint deposited on top of the ink (blue = ink, pink = paper, green = fingerprint, yellow = fingerprint + paper); (e) shows a different sample where is ink deposited on top of the fingerprint (adapted from [30])...19 Figure 1-10: Depth profiles of (a) fingerprint on top of ink and (b) ink on top of
Figure 1-11: (a) Fluorescence image of rat white lipid cells (b) high energy
secondary ion mass spectrometry image of PO3' (c) Fragment ions of
phosphatidylinositol (PI); field of view 150 pm x 150 pm [61]...21 Figure 1-12: Basic representation of a matrix assisted laser desorption ionisation instrument [64]...22 Figure 1-13: Matrix assisted laser desorption ionisation (MALDI) ion images
showing various species with their m/z ratios (no image scale supplied) [65]... 24
Figure 1-14: Schematic diagram of a GC-MS instrument [73]... 27 Figure 1-15: (A) IR spectrum and photomicrograph of a four-year-old boy's
eccrine fingerprint (B) IR spectrum and photomicrograph o f a nine-year-old boy’s sebaceous fingerprint [80]... 33 Figure 1-16: U.S. Dollar bill with a latent fingerprint, (a) Scanned image of a U.S. Dollar bill, (b) Infrared image o f the outline area o f a dollar bill, revealed by using the second derivative band intensity at 1016 c m '\ (c) Isolated image of the number “3”. (d) isolated image of the border design on the bill obtained by second derivative band mathematics [82]...34 Figure 1-17: Attenuated total reflectance - Fourier transform infra-red (ATR-
FTIR) spectroscopic image of latent fingerprints. The imaged area is 2.5 x 3.6 mm^ and the 2830-2870 cm'^ integration range was used to represent the distribution of lipids. The following lifting media were used: (a) BVDA GelatineGel; (b) Dycem Print Lifter [83]... 35 Figure 1-18: Attenuated total reflectance - Fourier transform infra-red (ATR-
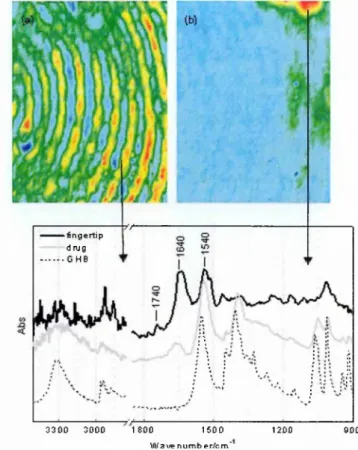
FTIR) image of a fingerprint showing (a) the protein distribution in the mark and (b) a microparticle of GHB drug [84]... 36 Figure 1-19: a) image of a finger residue particle before infrared detection, b) the
same image after infrared detection, and c) the infrared spectrum of this fingerprint residue particle [85]... 37 Figure 1-20: Schematic diagram showing the phenomena of (a) inelastic and (b)
elastic scattering [87]...38 Figure 1-21: Production of characteristic X-rays by removal o f inner electron
and electron transition resulting in photon emission (adapted from [87])... 38 Figure 1-22: Scanning electron microscopy (SEM) images of fingerprints
Figure 1-23: Scanning electron microscopy (SEM) macro image of a latent fingerprint developed with magnetic iron oxide powder suspension deposited on polyethylene (adapted from [91])... 42 Figure 1-24: A) Room light photograph of paper treated with ninhydrin followed
by zinc chloride. B) Latent fingerprint from (A) developed by argon laser [22]. Colour images were not supplied...44 Figure 1-25: (A) Fingerprint developed with ninhydrin (left) and DFO,
photographed under white light. (B) Fingerprint developed with ninhydrin (left) and DFO and illuminated using 514 nm wavelength light from a 12W argon ion laser and photographed through a 610 nm filter [102]... 45 Figure 1-26: One-week-old fingerprint on a clear glass slide after treatment with
cyanoacrylate and rhodamine 6G: multi-spectral software image (left), conventional laser light method (right)... 46 Figure 1-27: Fingerprint on white paper, treated with ninhydrin. Left: Chemical
imaging using multi-spectral software, right: conventional laser technique 46
Figure 1-28: How specular imaging works on (A) blank/clean substrate and (B) Substrate with fingerprint ridges (adapted from [103])...47 Figure 1-29: Fingerprint detection experiment on orange painted metal surface,
image taken under the special lighting setup by the authors. (B) is a magnified image of (A)...48 Figure 1-30: (a) Close-up view of a hardcover book bearing a latent fingerprint
under normal viewing conditions (no polarizer, no special lighting arrangements), (b) The same area imaged with a specially arranged specular lighting setup, (c) The same area imaged with a specially arranged specular lighting condition plus polarization image processing [103]... 49
Figure 1-31: Equipment setup for typical analysis using Lin et al. (2006)
specular reflective technique [103]... 49 Figure 1-32: Untreated fingerprint on black gel lifter, scanned with the GLScan
[104]... 50 Figure 2-1: A schematic diagram of a ToF-SIMS instrument... 61 Figure 2-2: Schematic diagram of how an attenuated total reflectance - Fourier
Figure 3-1: Positive ion images of an undoped fingerprint (from the donor) deposited on a silicon wafer depicting (A) Elemental ions (Na, K and either or CaH respectively) (B) Fragment ions originating from the substrate and (C) Fragment ions originating from the fingerprint. Refer to Section 2.4.1 for experimental conditions... 68 Figure 3-2: Positive ion images of an undoped fingerprint (from the 2"^ donor)
deposited on a silicon wafer depicting (A) Elemental ions (Na, K and respectively) (B) Fragment ions originating from the substrate and (C) Fragment ions originating from the fingerprint. Refer to Section 2.4.1 for experimental conditions...70 Figure 3-3: Negative ion images of an undoped fingerprint (from the 3^^^ donor)
deposited on a silicon wafer depicting (A) Fragment ions originating from the fingerprint and (B) Fragment ions originating from the substrate. Refer to Section 2.4.1 for experimental conditions...71 Figure 3-4: Positive ion images of (A) molecular ion fragments originating from
an undeveloped fingerprint on paper and (B) molecular ion fragments originating from the paper substrate. Refer to Section 2.4.1 for experimental conditions...73 Figure 3-5: Positive ion images of (A) molecular ion fragments originating from
a ninhydrin developed fingerprint on paper and (B) molecular ion fragments originating from the paper substrate. Refer to Section 2.4.1 for experimental conditions...75 Figure 3-6: Negative ion images of (A) molecular ion fragments originating
from a ninhydrin developed fingerprint on paper and (B) molecular ion fragments originating from the paper substrate. Refer to Section 2.4.1 for experimental conditions... 76 Figure 3-7: Positive ion images of (A) ions and molecular ion fragments
originating from a silicon wafer substrate and (B) ions and molecular ion fragments originating from a Staedtler 4300M black ballpoint pen ink deposited on the silicon wafer substrate. Refer to Section 2.4.1 for experimental conditions... 78 Figure 3-8: Chemical structures (and their masses) of the 3 main dyes found in a
Figure 3-9: Negative ion images o f (A) ions and molecular ion fragments originating from a silicon wafer substrate and (B) ions and molecular ion fragments originating from a Staedtler 4300M black ballpoint pen ink deposited on the silicon wafer substrate. Refer to Section 2.4.1 for experimental conditions...79 Figure 3-10: Positive ion images of (A) molecular ion fragments originating
from a silicon wafer substrate and (B) molecular ion fragments originating from a Staedtler 43COM black ballpoint pen ink deposited on the silicon wafer substrate. Refer to Section 2.4.1 for experimental conditions...81 Figure 3-11: Positive ion images of (A) molecular ion fragments from a
Staedtler 4300M black ballpoint pen ink deposited on paper and (B) ions originating from the paper substrate. Refer to Section 2.4.1 for experimental conditions...82 Figure 3-12: Positive ion images o f (A) a fingerprint deposited after ink and (B)
a fingerprint before ink on a paper substrate. Refer to Section 2.4.1 for experimental conditions... 83 Figure 3-13: Positive ion images of (A) a fingerprint deposited after ink and (B)
a fingerprint deposited before ink on a paper substrate. Refer to Section 2.4.1 for experimental conditions...84 Figure 3-14: Line scans of overlapping fingerprints and inks following the
intensity o f ions characteristic of the ink (from m/z 358.2) - the inserted
images show the location where the line scans were taken [130]...85 Figure 3-15: Normalized standard deviations of the line scan data for each o f the
different samples in the study, compared with the protocol "cut-off ’ point [130]... 87 Figure 3-16: Secondary ion and optical images (representative o f the area shown
in the secondary ion image) of ink lines deposited on undeveloped fingerprints... 88 Figure 4-1: Normalised standard deviations of ten fingerprints (both above and
below ink) compared with the current confidence limit set by the proposed protocol...90 Figure 4-2: Line scan following the intensity of ink ion signals along an ink line
Figure 4-3: Line scan following the intensity o f ink ion signals along an ink line where an ink line lies on top of an undeveloped fingerprint...92 Figure 4-4: Line scans firom Sample I showing the original data (with a
polynomial trend line) and comparing that with the new normalised data...92 Figure 4-5: Line scan data from Figure 4-2 with highlighted regions showing
peaks and troughs... 93
Figure 4-6: A) Positive ion image of K {m/z 38.97) showing clear fingerprint
ridge detail B) two-colour image used as a mask for showing areas where ink and fingerprint overlap and C) two-colour image used as a mask for showing areas of the ink where ink does not overlap with fingerprint... 94 Figure 4-7: Diagram showing how fingerprint ridge masks were applied to the
ink ion image in order to produce two new composite images, showing the difference in ink signal intensity where it overlaps (A) and does not overlap with the fingerprint ridge (B)... 95 Figure 4-8: Results of applying the new protocol to samples from previous
investigations (see Sections 3.6 and 4)... 97 Figure 5-1: Positive ion images of a fingerprint deposited on top of ink lines
before being developed with ninhydrin and the same sample post development. Refer to Section 2.4.1 for experimental conditions... 99 Figure 5-2: Positive ion images of ink lines deposited on top of a fingerprint
before being developed with ninhydrin and the same sample post development. Refer to Section 2.4.1 for experimental conditions... 101 Figure 5-3: Positive ion images of a fingerprint deposited on top o f ink lines
before being developed with l,2-diazafiuoren-9-one (DFO) and the same sample post-development. Refer to Section 2.4.1 for experimental conditions... 102 Figure 5-4: Positive ion images of ink lines deposited on top of a fingerprint
before being developed with 1,2-diazafiuoren-9-one (DFO) and the same sample post-development. Refer to Section 2.4.1 for experimental conditions... 104 Figure 5-5: Positive ion images of a fingerprint deposited on top of ink lines
and the same sample post-development. Refer to Section 2.4.1 for experimental conditions... 106 Figure 5-6: Positive ion images of ink lines deposited on top of a fingerprint
before being developed with dimethylaminocinnamaldehyde contact transfer and the same sample post-development. Refer to Section 2.4.1 for experimental conditions... 107 Figure 5-7: Positive ion images of a fingerprint deposited on top of ink lines
before being developed by 1,2-indandione contact transfer and the same sample post-development. Refer to Section 2.4.1 for experimental conditions... 109 Figure 5-8: Positive ion images of ink lines deposited on top of a fingerprint
before being developed with 1,2-indandione contact transfer and the same sample post-development. Refer to Section 2.4.1 for experimental conditions... 110 Figure 5-9: Positive ion images of a fingerprint deposited on top of ink lines
before being developed by cyanoacrylate fuming and the same sample post development. Refer to Section 2.4.1 for experimental conditions...113 Figure 5-10: Positive ion images of ink lines deposited on top of a fingerprint
before being developed with cyanoacrylate fuming and the same sample
post-development. Refer to Section 2.4.1 for experimental conditions 115
Figure 5-11: Images showing (A) areas of the ink which overlap with fingerprint (B) areas of the ink which do not overlap with the fingerprint (C) the original ink signal (D) the mask used to create image A (E) the mask used to create image B and (F) the original fingerprint ridge pattern...116 Figure 5-12: Results to show the how chemical development has affected each
overlapping fingerprint and ink sample, comparing the protocol value for each sample before and after development...117 Figure 6-1: A chart showing how a blank quartz crystal microbalance (QCM) is
affected by a low pressure system. Results fi-om analysing three QCMs (crystals 1-3), three times each (replicates A-C)... 120 Figure 6-2: A chart showing the mass changes exhibited by a quartz crystal
then subjected to a low pressure system. Results from analysing three QCMs (crystals 1-3), three times each (replicates A-C)...121 Figure 6-3: A chart showing the mass changes exhibited by a quartz crystal
microbalance (QCM) when a fingerprint is deposited on the surface and then subjected to a medium-low pressure system. Results from analysing three QCMs (crystals 1-3), three times each (replicates A-C)... 123 Figure 6-4: A chart showing the mass changes exhibited by a quartz crystal
microbalance (QCM) when a fingerprint is deposited on the surface and then subjected to a “medium” pressure system...124 Figure 6-5: A chart showing the % mass changes exhibited by two quartz crystal
microbalances (QCMs) when a fingerprint is deposited on the surface and
then subjected to ambient conditions stored in normal lighting conditions 126
Figure 6-6: Attenuated total reflection - Fourier transform infra-red spectra of fingerprints subjected to a low pressure system (2x10'^ Torr)...128 Figure 6-7: Attenuated total reflection - Fourier transform infra-red spectra of
fingerprints subjected to a medium-low pressure system (2x10'^ Torr)...131 Figure 6-8: Relative abundances (determined by gas chromatography - mass
spectrometry (GC-MS)) of organic molecules found in fingerprints before and after being subjected to a vacuum chamber (pressure of 2x10'^ Torr). Hexadecanoic acid and squalene are plotted on a secondary axis to effectively show the change in relative abundances across all species... 134
List of Tables
Table 1: Strengths and limitations o f desorption electrospray ionisation (DESI) [34]... 7 Table 2: Strengths and limitations of keV time-of-flight-secondary ion mass
spectrometry (ToF-SIMS) [43]...10 Table 3: Strengths and limitations of MeV SIMS [30, 58]... 18 Table 4: Strengths and limitations of matrix assisted laser desorption ionisation
[63-66]...22 Table 5: Strengths and limitations of gas chromatography [72]... 28 Table 6: Strengths and limitations of attenuated total reflectance - Fourier
transform infrared spectroscopy [79]...31 Table 7: Strengths and limitations of scanning electron microscopy with energy
dispersive X-ray detection (SEM-EDX) [86]...39 Table 8: Strengths and limitations of optical techniques [2, 29, 92-95]... 43 Table 9: Strengths and limitations of gravimetric techniques [105]... 51 Table 10: Tentative assignment of wavenumbers (cm'^) for fingerprints deposited
on aluminium foil. Analysis by attenuated total reflection - Fourier transform infra-red spectroscopy. Adapted from [134] and [133]... 129
Table of Contents
Summary...î Declaration... iü
Acknowledgments... iv
Glossary of Main Terms...vi
List of Figures... vii
List of Tables... xv
1 Introduction...1
1.1 What Are Fingerprints?...1
1.2 Current Techniques Available for Fingerprint and Ink Analysis...5
1.3 Summary of Instrumental Techniques... 53
1.4 Fingerprints and Low Pressure Systems... 54
1.5 Aim and Objectives... 54
1.6 Summary...55
2 Materials and Methods...56
2.1 Fingerprint Preparation Protocol...56
2.2 Fingerprint Development Reagents...57
2.3 Types of Ink Used in This W ork... 58
2.4 keV - Time-of-Flight-Secondary Ion Mass Spectrometry (ToF-SIMS) 59 2.5 Mass Analysers... 62
2.6 Quartz Crystal Microbalance (QCM)...63
2.7 Attenuated Total Reflection - Fourier Transform Infra-Red (ATR-FTIR) ... 64
2.8 Vacuum Chambers... 65
2.9 Summary...65
3 Development of a Protocol for Overlapping Fingerprints and Inks Analysis... 67
3.1 Fingerprints on Silicon...67
3.3 Developed Fingerprints on Paper... 74
3.4 Ballpoint Pen Ink on Silicon...77
3.5 Ballpoint Pen Ink on Paper... 81
3.6 Overlapping Undeveloped Fingerprints and Ink on Paper...82
3.7 Summary... 88
4 Modification of the Protocol...89
4.1 Image Analysis...93
4.2 Summary... 97
5 The Effect of Chemical Developers on the Modified Protocol... 98
5.1 The Effect of Ninhydrin Immersion... 99
5.2 The Effect of 1,2-Diazafluoren-9-one (DFO) Immersion... 101
5.3 The Effect of Dimethylaminocinnamaldehyde (DMAC) Contact Transfer. 104 5.4 The Effect of 1,2-indandione Contact Transfer...108
5.5 The Effect of Cyanoacrylate (Superglue) Fum ing...112
5.6 Summary...117
6 The Effect of Low Pressure Systems on Fingerprint Chemistry... 119
6.1 Investigation of Potential Mass Change... 119
6.2 Investigation of Potential Chemical Change Using Attenuated Total Reflection - Fourier Transform Infra-Red (ATR-FTIR) Spectroscopy 126 6.3 Investigation of Potential Chemical Change Using Gas Chromatography -M a ss Spectrometry (GC-MS)... 132
6.4 Summary...134
7 Conclusions and Future Work... 136
7.1 Conclusions... 136
7.2 Future W ork... 139
8 References...142
9 Appendix...150
Chapter 1
This chapter provides the reader with an introduction to fingerprints and why they are important in forensic science (Section 1.1). Section 1.2 describes the techniques currently available for analysing and detecting fingerprints (all of which are briefly summarised in Section 1.3). Section 1.4 explains the importance of low pressure systems in fingerprint analysis. The end of the chapter (Section 1.5) provides the reader with the aim and objectives of the thesis.
1 Introduction
1.1 What Are Fingerprints?
Fingerprints are a copy of the friction skin ridges that are found on the hands. The ridge patterns are formed in the womb (the pattern is affected by the microenvironment around each finger) and then grow as the finger grows (the process can be likened to drawing a face on a balloon with a pen and then inflating the balloon). Every single person is thought to have different fingerprint patterns, even identical twins with the same DNA are different [1]. Fingerprints are different to finger marks, if the owner/donor of the finger mark/fingerprint is known then it is a fingerprint. If the owner/donor is not known then the mark is a finger mark. The samples in this research are all fingerprints as the donors were known. There are three main types of fingerprints that can be found at a crime scene (see Figure 1-1) [2]. The first type is indented (moulded) fingerprints. These are 3D impressions of friction skin ridges that are found on malleable surfaces such as putty or candle wax. Enhancement and visualisation is carried out by using oblique lighting. The second type of fingerprint is visible fingerprints. These may be viewed in positive or negative contrast depending on how the fingerprint was made; because these fingerprints are visible it is possible to document the fingerprint simply by taking a photograph. The third type of fingerprint that can be found at a crime scene is the latent fingerprint. These are normally invisible to the naked eye and generally require some form of physical or chemical treatment in order to visualise the fingerprints [2].
0.5 cm 0.5 cm 0.5 cm
m m ..
(a) (b) (c)
Figure 1-1: (a) Photo of an indented fingerprint (b) Photo of a visible fingerprint (in blood) (c) Photo of a latent fingerprint developed using ninhydrin. [3-5]
1.1.1 Developing latent fingerprints
Latent fingerprints are a highly variable combination of chemicals that can originate from (predominantly) natural secretions from pores found on the skin all over the body and other (exogenous) contaminants [6-10]. The natural (endogenous) components consist mainly of eccrine [11] and sebaceous gland secretions [12]. Eccrine gland secretions from the fingers, hands, and soles of the feet contain both organic and inorganic species (amino acids and salts). Sebaceous glands are not found on the hands or soles of the feet and only
secrete organic materials {e.g. fatty acids and other oils). The sebaceous secretions are
transferred to the fingers by touching places like the hair and face, which are areas that contain a large number of sebaceous glands.
In order to visualise and document latent fingerprints, the police utilise relatively cheap and robust physical and/or chemical treatments that react with the species that make up the fingerprint [13]. Many of these techniques will be used sequentially with other techniques in order to generate the greatest quality images. The Home Office Centre for Applied Science and Technology (CAST) publishes a Fingerprint Development Handbook, which documents the processes that forensic investigators should carry out when looking for latent fingerprints on surfaces. These processes vary according to the type of material that is being examined. CAST has produced 13 process selection charts to determine which
development process should be used on a particular material [14]. For example, when developing latent fingerprints on porous materials such as paper and cardboard the following methods can be used:
Fluorescence examination
Inherent fiuorescence by laser or an alternate light source can reveal the location of latent fingerprints as some of the components of latent fingerprints will fluoresce under certain wavelengths of light [15-16]. These can then be photographed using special light filters for documenting the fingerprint.
Iodine fuming
Iodine fuming involves heating crystalline iodine so that it sublimes (quicker than at room temperature) into violet vapours; the sample is placed in a cabinet with the iodine crystals. The vapours then absorb into the oily deposits in the fingerprint residue which imparts a yellow-brown colour to the ridge pattern [17]. However, fingerprints developed by iodine are not permanent; in the presence of air, the yellow-brown colouring fades. This means that iodine-developed fingerprints have to be photographed and documented immediately upon development. Nevertheless, it is possible to fix the fingerprints as iodine is known to react with starch giving a stable, deep blue complex [18].
1.8-Diazafiuoren-9-one IDFOl immersion
1.8-Diazafiuoren-9-one (DFO) reacts with amino acids and possibly some other
constituents [14] in latent fingerprints. When this reaction is complete, the developed latent fingerprints will fluoresce with the use o f a laser or an alternative light source [19]. Samples are typically dipped/sprayed with the DFO solution. It has strengths in that it can detect fingerprints that are many months or years old, but it can cause diffusion or running of some inks which, if fluorescent, may mask fingerprints [14].
Ninhvdrin [and its analogues! treatment
Ninhydrin or its analogues (such as 1,2-indandione) react with the amino acids in latent fingerprints and normally produce a visible colour change [20-21] which can easily be photographed and documented under white light. By using alternative lighting or laser
light [22] it is possible to enhance the developed fingerprint for documenting. Treatment can be carried out by dipping the sample in the appropriate solution [23] or by contact transfer [24].
Dimethvlaminocinnamaldehvde (DMAC) treatment
The use of dimethylaminocinnamaldehyde (DMAC) as a fingerprint development reagent was first proposed in the 1970s as an immersion/dipping technique to target the urea that is often found in fingerprints [25]. However, the quality of the fingerprints that were developed was poor. Recently, the use of DMAC fuming and the use of DMAC impregnated sheets have been proposed as alternative fingerprint development processes for porous surfaces, such as paper [26].
Electrostatic document examination (ESDAl
Electrostatic document examination (ESDA) can sometimes develop fingerprints. It is not recommended for routine use because the sensitivity to fingerprints more than a few days old is poor, but freshly deposited fingerprints may be developed [14, 27].
It should be noted that o f the chemical enhancement techniques ninhydrin is the most widely used process, but it is not the most effective; DFO is known to develop a higher numbers of marks overall [14]. The reason ninhydrin is so widely used is because it develops visible marks that can be quickly and easily captured. It is thus well-suited to applications where it is necessary to process large numbers of exhibits rapidly and it is considered that DFO treatment and subsequent fluorescence examination is too time consuming [28].
A major problem that can arise in the forensic analysis of documents is the determination of whether or not a latent fingerprint has been laid prior to ink or text being deposited, or whether the ink was laid down and then the fingerprint deposited. This has implications in cases where a suspect’s fingerprint may be found on a document, but they claim to have
handled the paper before any ink was put down on the paper, e.g. “I only put the paper in
the drawer”. There is currently no method for determining whether a fingerprint found on a document was deposited before, or after the text. Even where fingerprints spatially overlap with text, police institutions are unable to determine whether a fingerprint is located above
or below the ink. This is because latent fingerprint development reagents which react or bond to the constituents of the fingerprints, such as ninhydrin or DFO, only give a 2D image of light/dark contrast with no depth information [2, 29].
The aim of the research is therefore to investigate whether it is possible to identify whether a fingerprint was deposited prior to or after an ink layer. Previous studies have shown this is potentially possible by high energy secondary ion mass spectrometry (MeV SIMS) [30]. The reported study doped the fingerprints with a commercial hand cream in order to
achieve the results obtained (see Section 1.2.1.3). Fieldhouse et a l (2011) utilised ESDA
to determine the deposition order of developed fingerprints, pen inks and laser printer toner on paper. The majority of the developed marks analysed did not yield any information about the sequence regardless of the development technique or ink used, except for ninhydrin developed samples involving laser printing [27]. Koeijer (2006) has reported initial findings on using keV time-of-flight secondary ion mass spectrometry (ToF-SIMS) for determining the deposition order of overlapping fingerprints and inks [31]. This research also investigates chemical changes in latent fingerprints in relation to the effect of
low pressure systems {i.e. vacuum chambers). Many of the techniques discussed in Section
1.2.1 rely on low pressure systems in order to operate. Currently, there has been nothing (as far as can be reasonably found) published on the effect that vacuum systems might have on the composition of latent fingerprints. By looking at the chemical composition of the fingerprint it will be possible to show whether or not a vacuum system can change the composition of, and thus physically alter, the latent fingerprint. If this is the case then police institutions might need to think more carefully about which analytical techniques to use when analysing/detecting latent fingerprints.
1.2 Current Techniques Available for Fingerprint and Ink Analysis
This section presents research carried out prior to this project and covers the differing methods encountered including ionisation and desorption methods, spectroscopic, microscopic techniques and gravimetric techniques.1.2.1 Ionisation and desorption methods
There are various ionisation and desorption methods available, including desorption electro spray ionisation (DESI), matrix assisted laser desorption ionisation (MALDI), time- of-flight-seeondary ion mass spectrometry (ToF-SIMS) and gas chromatography (GC) 1.2.1.1 Desorption eleetrosnrav ionisation (DESI)
Theorv
Desorption electrospray ionisation (DESI) consists of accelerating a charged aqueous solution using a gas jet towards the target surface. The charged micro droplets of solution act as projectiles and are able to desorb charged molecules from the surface as a result of electrostatic and pneumatic forces [32]. The desorbed ions are then transferred (at atmospheric pressure) into a mass spectrometer (mass spectrometers are discussed in Section 2.5) and are analysed [33]. Figure 1-2 shows a simple schematic of the equipment [33]. The desorbed ions can be used to produce an image of the surface showing where they originate. Table 1 summarises the strengths and limitations of the technique.
HV power supply Atm ospheric inlet of
m ass spectrom eter Solvent
Ion transfer line Nebulizer capillary Desorbed ions Spray capillary Gas jet Spray-Surface Freely moving
-sample stage in air
Figure 1-2: Set up of a desorption electrospray ionisation instrument coupled with a mass spectrometer (DESI-MS) [33].
Table 1: Strengths and limitations of desorption electrospray ionisation (DESI) [34].
St r e n g t h s Li m it a t io n s
• Aqueous spray causes sample to become wet and damaged on a
100 pm scale • Poor repeatability • Not quantitative
• Small volatile molecules not detected
• Molecules with no functionality are not detected
• Analysis carried out at atmospheric pressure - no need for vacuum system
• Imaging capability (spatial resolution of approx. 150 pm)
• Light molecule detection possible, e.g. drugs
(cannabis and cocaine) and inks
• Masses in the range of 0-20 kDa easily detected
• Possibility to be made portable • Commercially available
• Unit mass resolution easily achieved Literature review
Cooks et al. (2008) used DESI for latent fingerprint chemical imaging with the intention
of identifying small amounts of drugs of abuse within the latent fingerprint [35]. Eingerprints were contaminated with the drugs by exposing them to solutions of the drug (allowing the fingers to dry) and then depositing the fingerprint on ordinary surfaces, such as glass, paper and plastic. Additives were added to the aqueous jet spray to enhance the ionisation of some of the compounds found in the drugs; these additives included ammonium hydroxide and sodium chloride. A mixture of methanol:water (9:1, v/v) was sprayed at a constant volumetric flow rate of 1.5 pL/min delivered by the instrument’s
syringe pump. Solutions of NH4OH (for A9-tetrahydroeannibinol experiments) and NaCl
(for Research Department Explosive (RDX) experiments) were added to the spray solution at final concentrations of 0.1% and 1 mM, respectively. Figure 1-3 shows a DESI image of the distribution of cocaine on a latent fingerprint blotted on glass [35].
In addition to the drugs and exogenous materials, endogenous compounds were also detected by this technique, such as stearic acid and triacylglycerols. These were used to
record chemical fingerprints from sebum-rich latent fingerprints [35]. Takats et al. (2004)
fragmentation patterns by using tandem mass spectrometry (MS/MS) [33]. Cooks et al.
(2008) showed that it might be possible to distinguish between overlapping fingerprints by looking for the distinctive exposure history to certain chemicals [35]. Simply put, if one fingerprint contained for example a cannabis metabolite it would be easy to distinguish between the two fingerprints, as only the fingerprint with the metabolite would be imaged. However, difficulty can arise if both fingerprints contain the same chemicals, as there would be little to distinguish between them.
0.5 cm
Figure 1-3: Desorption electrospray ionisation image of the distribution of cocaine on a latent fingerprint blotted on glass (modified with the addition of a scale bar) [35].
Cooks et al. (2007) has also shown that it is possible to use DESI as a way to detect
document forgery by analysing the ink on the paper [36]. Ink from 10 different ballpoint pens were analysed directly to determine their mass spectra. In order to demonstrate the application of DESI for forged documents the number “1432” was written on paper. After allowing 2 hours to dry a different ink was used to change the number to “ 1982”. The surface of the paper was then analysed by DESI and ion images were produced from ions
characteristic of two different inks {m/z 372.4 and 484.5) as shown in Figure 1-4. It can be
clearly seen that the overlap DESI image (Figure 1-4C) matches that which was produced optically (Figure 1-4D). Also there are areas where the inks overlap (the top left of the character 4, and middle part of the characters 4 and 8) but they can still be distinguished using DESI.
Figure 1-4: Desorption electrospray ionisation images of a forged number on paper [36]. DESI imaging for the analysis of inks has the strength that there is no sample preparation required, it is non-destruetive and can be carried out in ambient conditions for the analysis of documents [36]. However, currently the technique is not fully portable [37] and so developments in automation are needed in order to improve the technique.
1.2.1.2 keV - Time-of-flight-secondarv ion mass spectrometry (ToF-SIMS)
Time-of-flight-secondary ion mass spectrometry (ToF-SIMS) is another surface analysis technique that traditionally, has not found use in biological based samples such as fingerprints [38]. However its use for such samples is now being developed [39], [40] as well as for forensic purposes [41], [42].
Theorv
The theory of ToE-SEMS is discussed in detail in the materials and methods section (Section 2.1) however the strengths and limitations of ToF-SIMS are summarised in Table
2.
Literature review
Szynkowska et a l (2007) utilised ToE-SIMS for the detection and analysis of fingerprints
on various substrates [43]. Hands were washed and then fingerprints deposited on the different materials; aluminium foil, a copper sheet, stainless steel, glass, a brass sheet and paper (not specially treated). The samples were then analysed by ToE-SIMS. Large scale
scans (2.2 cm x 2.2 cm) of the fingerprints were produced, however the ridge patterns were not sufficiently visible at this size scan. Images from a smaller scan size (1 cm x 1 cm) were then taken and produced good quality images of the fingerprint and the ridge detail. Sean times took between 1-3 hours, which appears to be quite long when compared with treatment by ninhydrin. However, the time might be justified by the volume of chemical information that can be collected using the technique. Additionally the time taken for a DNA sample to be analysed can often be on the scale of 1-2 days and so 1-3 hours in this
instance is not prohibitively long. Szynkowska et a l (2007) investigated whether
contaminants {e.g. gunpowder, nickel and arsenic compounds) not originating from the
fingerprint or substrate (glass, metal sheet etc.) could be identified [43]. The resulting
images clearly showed that the contaminants could be identified in the fingerprints on the varying substrates. This work shows the great potential of ToF-SIMS for application in forensic investigation.
Table 2; Strengths and limitations of keV time-of-fiight-seeondary ion mass spectrometry (ToF-SIMS) [44].
STRENGTHS
• All elements from H onwards can be detected, as individual atoms or in molecular combinations
• Imaging capability (down to nm resolution)
• Unit mass resolution easily achieved • Pg sensitivity
• Ability to depth profile • Mass range of 0-10 kDa
LIMITATIONS • Ultra high vacuum required • Not portable
• Sample is sputtered away on a sub- mieron scale (destructive)
• Possible mass interferences due to fragmentation
• Deposition substrate can affect the secondary ion yield and the sputter rate • Affected by topography (sample needs to
be completely flat)
Further work by Szynkowska et al. (2009) has shown that it is possible to use ToF-SIMS
for the detection and identification of illicit drugs (namely amphetamine,
over a fingerprint [45]. The contaminate drugs amphetamine; methamphetamine and MDMA were transferred to fingers by direct contact with the powdered drug. Excess powder was removed by wiping with a piece of textile. The fingerprints were then deposited upon four different substrates (aluminium, steel, brass and glass) by touching the surface with the fingers. Samples of the illicit drugs were pressed into a pill form so that mass spectra of the drugs could be obtained without interference from fingerprints or the substrate. Field of view: 500.0 x 500.0 pm^ M:26.98 tc: 813977 M:77.04 tc:337148 M:91.05 tc-.B67179 M: 136.11 tc:623759 total ion tc:46462030
Figure 1-5: Ion images showing (from left to right) the presence of aluminium {m/z 26.98),
amphetamine {m/z 77.04, 91.05 and 136.11) and the total ion image [45].
Results showed that the drugs could be differentiated from the substrate (aluminium sheet
etc.). However, the data presented by Szynkowska et al. (2009) in this work do not show fingerprint ridge detail (see Figure 1-5), which would be of fundamental importance in casework to demonstrate that the drugs were indeed found in the fingerprints and not simply on the substrate.
Work carried out by Fardim & Holmbom (2005) shows that ToF-SIMS can be used for imaging the surface of paper to aid in characterisation [46]. It was shown that whilst the spatial resolution of the technique might not be as good as field emission scanning electron microscopy (FF-SFM), it is advantageous because it can produce secondary electron images as well as chemical maps of the surface. The disadvantage of using ToF-SIMS is the lack of detailed morphology of some nanostructures in the paper; this is due to poor lateral resolution and surface damage if low raster sizes are used. By applying a Au-Pd coating the intensity of characteristic secondary ions of papermaking and paper coating chemicals was increased and this improved the ToF-SIMS imaging significantly. This article shows that ToF-SIMS is a useful technique for characterising paper and its various coatings and fillers.
Lee et al. (2008) carried out research into red sealing-inks used in documentation in Asia [47]. They utilised ToF-SIMS in order to investigate whether the red sealing-ink was on top or below ink from a common ballpoint pen. The problem encountered with the ToF- SIMS instrumentation is the limited/small chamber size in which to fit the sample. Whilst it is possible to purchase large volume vacuum chambers, the time taken for the chamber to pump down to the correct pressure with an A4 sheet of paper inside could be on the scale of days. This means analysing a whole piece of A4 paper is not realistically possible and that a sub-sample must be taken. The authors also showed that it is possible to remove individual paper fibres from the sample containing ink from the paper and carry out subsequent analyses. This then allows for “covert” analysis of the document. It was deduced that it was possible to determine whether the black ballpoint pen ink was on top or below the red sealing-ink. However, how “covert” the removal of fibres from the surface actually is, is debatable.
Shibatani et al. (2008) have used ToF-SIMS to study depth profiles of inkjet ink
components on paper [48]. The authors used Cs as the primary ions and coated the sample surface with platinum in order to prevent charging - therefore sample information for the first 0-60s of analysis was from the platinum layer and subsequently, after 60s the Pt layer
was passed and the top surface o f the ink layer was exposed. Shibatani et al. (2008)
decided to study the presence of a volatile compound (glycerine) that is used in the ink to
help the ink flow smoothly during printing. Shibatani et al. (2008) used a fully deuterated
form of glycerine so that it would be easily recognisable in the mass spectra. The group discovered that the glycerine was found throughout the entire depth of the ink from the bottom of the ink layer to the surface of the ink.
Dalton et al. (2002) have carried out research into the distribution of ink components
throughout printed coated paper using ToF-SIMS [49]. The authors found that it is possible to analyse the chemical composition through an ink film that is printed on to kaolin (clay)
coated paper via ToF-SIMS. Analysis was carried out by looking at specific fragments that
represent the various molecular compounds found in the ink formulation. It is possible to gain some molecular structure information from various depths in the ink film by using ToF-SIMS. It was also found that at the surface of the ink there was a resin formed by the cross-linking of unsaturated hydrocarbons present in the ink formulation and was estimated that this resin thickness was approximately 35-50 nm. The authors concluded that none of
the ink pigment penetrated into the (wood-free) paper eoating layer. This was from comparison of the ToF-SIMS ink-paper interface with the micro roughness of the coating. This article shows that it is possible to depth profile through 1.5pm of ink on to a paper.
Heard et al. (2004) have used gallium ion ToF-SIMS with high spatial resolution to further
investigate the ability of ink to penetrate paper [50]. This was done by embedding the paper in resin and then analysing the cross-section of the paper as well as depth profiling the ink film deposited on the paper. ToF-SIMS analysis showed the ink layer as a visible thin line on the surface of the paper coating (see Figure 1-6). No penetration of ink into the paper layer appeared to have occurred.
Ink
Coating
-P a p e r
Figure 1-6: Time-of-flight-secondary ion mass spectrometry (ToF-SIMS) secondary ion image of ink printed on coated paper [50].
Some inks however, reacted with the resin in which they were embedded; this meant that the ToF-SIMS technique could not be used. The authors then used focused ion beam (FIB) technology to cross-section the paper and to image the adsorption of the reactive inks into the paper. It was found that because the reactive inks used for FIB analysis was more conductive compared with the eoating, it gave a high contrast between them, which the authors believe allows for a simple assessment of the level of ink penetration into the paper.
Coumbaros et al. (2009) showed that ToF-SIMS has the potential to be used in serious criminal cases where conventional ink analyses are inconclusive and further evidence is
needed [51]. 13 ballpoint pen inks were analysed via ToF-SIMS. Background spectra were
taken of the paper on which each ink was written, these were then subtracted from the spectra taken from the ink on the paper. The mass spectra were taken in both positive and negative ToF-SIMS mode. Owing to the nature of the dyes present in the ink, the negative mode yielded no significant peaks and so was not shown in the paper. The positive spectra of the inks analysed were compared to either mass spectral data obtained under identical conditions or from the literature. Differentiating between the 13 inks was relatively straightforward, however difficulty was found in distinguishing between inks of a certain brand and in one case two inks were indistinguishable fi*om one another. Further investigations included analysing thin layer chromatography (TLC) plates on which inks had been separated. TLC is regularly used in the analysis of inks due to its simple procedure and cheap apparatus [52]. The results of this work show that ToF-SIMS can be applied to the analysis of inks on paper alone or that the ink components can be separated
via TLC and then analysed directly by ToF-SIMS. The authors felt the combination of
TLC and ToF-SIMS would in fact be beneficial in the general analysis of inks. Future
research is needed into other inks from different pens e.g. roller ball, fountain pens etc., as
well as inks from printers and fax machines.
He et al. (2006) reported on the analysis of multiple layers of different coloured inks
deposited on paper [53]. He et al. (2006) used ToF-SIMS to analyse various coloured inks
and collected their mass spectra. From these, a set of characteristic masses was assigned to each eolour/ink, and non-overlapping peaks were selected to produce ion map images of the coloured ink handwritings. The experimental results showed that secondary ion images can be used to assess reliably the deposition order of overlapping inks on paper. Figure 1-7 shows that if the overlapped inks are deposited within a close space o f time it is actually very difficult to tell which was deposited first/last. This is possibly due to the inks mixing whilst they are still wet. Figure 1-8 shows that if inks are allowed to dry then it is far easier to tell the deposition order as the ink deposited last/on top will prevent the emission and detection of ions from the underlying ink. This leads to the “underneath” species being masked and appearing as a gap in the ion maps.
1.000 mm 1.000 mm 1.000 mm M:349 tc:4214 M:358 tc:5461 total ion tc:6142200
Figure 1-7: Time-of-flight-secondary ion mass spectrometry (ToF-SIMS) ion images from a black fountain pen ink and a blue ballpoint pen ink (M: 349 = black fountain pen ink, M: 358 = blue ballpoint pen ink). The ballpoint pen ink was deposited immediately after the
fountain pen ink was written [53].
1.000 rnm
1.000 rnm
\
1.000 rnm
M:349
tc:2624
M:358
tc:6234
total ion
tc:6576298
Figure 1-8: Time-of-flight-secondary ion mass spectrometry (ToF-SIMS) ion images from a black fountain pen ink and a blue ballpoint pen ink (M: 349 = black fountain pen ink, M: 358 = blue ballpoint pen ink). The black fountain pen ink was allowed to dry for one and a
half hours before the blue ballpoint pen ink was deposited [53].
Koeijer (2006) has reported initial findings on using keV time-of-flight secondary ion mass spectrometry (ToF-SIMS) for determining the deposition order of overlapping fingerprints and inks [31]. The images presented only show a small section of where the fingerprint and ink overlap which could make conclusions subjective. It is not clear that Koeijer (2006) have fully examined the potential of using ToF-SIMS for overlapping fingerprints and inks
and therefore the research in this project hopes to investigate this more comprehensively (by understanding the fundamental science that underpins it).
Attard Montalto et ah (2012) have recently presented a methodology for the use of ToF-
SIMS as a technique for determining the deposition order of laser printed ink and natural fingerprints on paper [54]. The authors used scanning electron microscopy with energy dispersive X-ray detection to carry out initial investigations of the boundary where ink coated paper met plain paper; the results showed the change in surface topography where
the laser printed ink coated the paper to where the paper was uncoated. Attard Montalto et
al. (2012) then used ToF-SIMS to image blind samples of unknown deposition order. The
images the authors produced were not that clear and they reported finding it difficult to
differentiate between the fingerprint and paper, relying mainly on the Na, K and C3H5 ions
to image the fingerprint ridges. No attempt was made to analyse in the negative ion mode; the effects of donor and depletion variability as well as ageing of the deposited fingerprint were also investigated in this work. The authors reported a 100% success rate in
determining the deposition order of the overlapping fingerprint and ink in all 21 blind
samples they analysed. However, all of the conclusions appear to be based on a subjective observation of the images and no quantitative protocol was carried out or developed.
1.2.1.3 High energv secondary ion mass spectrometry (MeV SIMS)
High energy secondary ion mass spectrometry (MeV SIMS) is a modification o f the conventional ToF-SIMS technique. It uses significantly higher energy ion beams to carry out analyses. This means that the primary ion beam can travel several centimetres through air (which is not possible for the low energy ion beam used in conventional ToF-SIMS) [55], [56] and chemical analysis o f samples in air using MeV ion beams is currently under development [57].
This is an important area of investigation as conventional ToF-SIMS analysis is carried out in an ultra-high vacuum chamber (at 10'^ Torr) and as such there is currently no published research on the effect of a vacuum on fingerprints. It will later be shown that compositional
changes occur in fingerprints that are subjected to a vacuum chamber (see Section 6 for
experimental results), therefore an atmospheric pressure analysis technique (such as MeV SIMS) will be beneficial. Additionally, atmospheric analysis permits the study o f large objects that cannot be placed in a vacuum chamber (as the chamber is not needed).
Theory
The primary ions used in MeV SIMS are To generate these ions, a mixture of gas
eontaining 90% H2 and 10% O2 (100% O2 gas causes damage to the internal workings of
the instrument) is allowed to flow into an ionisation chamber. A set o f filaments is then heated to produce the thermionic emission of electrons which are accelerated towards the gas by a discharge voltage. A series o f magnets is used to steer the electrons into a helical path (increasing the chance of collisions with the gas). The electrons collide with the gas molecules, ionising them and creating a plasma of ions and electrons.
An extraction voltage of around 20 kV is then applied to the electrodes at one end of the chamber in order to extract negative ions. A set of Einzel lenses then guide the ions towards another magnet which steers ions of the desired mass into the tandem accelerator. The beam of negatively charged ions enters the tandem linear accelerator at one end and the ions are accelerated towards the high positive voltage (up to 2 MV) at the centre of the
accelerator vessel. When the ions reach the centre they encounter the stripper gas (N2).
This gas removes electrons from the negative ions and makes them positively charged, repelling them from the high positive voltage at the centre and accelerating them towards earth potential at the other end of the accelerator. The ions are therefore accelerated twice: once towards the terminal and secondly away from it. Therefore, if the positive voltage at the centre of the accelerator is at 2 MV then singly charged ions leaving the tandem accelerator will have energies of 4 MeV. For multiply charged ions, energies up to 10 MeV can be obtained.
Upon exiting the accelerator vessel, the beam passes into the switching magnet where it is directed down one of the beam lines (in this case a microbeam line). A set o f quadrupoles are then used to focus the beam down to the right diameter on the target. The primary ions collide with the target surface and transfer their energy to the target atoms present in a series of binary collisions. This increase in energy in the surface means that some high energy target atoms (called recoil atoms) collide with more atoms in the target surface. Target atoms that recoil back through the sample surface produce sputtered material. Photons and primary ions can also be ejected from the surface. Not all collisions lead to ejections from the surface. In fact, many atoms close to the surface are embedded further into the material and cause surface mixing. The charged molecular fragments that are ejected from the surface are attracted towards the time-of-flight tube. This tube is
responsible for allowing the sputtered material to separate according to the mass:charge ratio throughout the flight (see Section 2.5.1). The sputtered material is then detected by the mass analyser, which outputs a spectrum of time-of-flight vj. intensity of ions. The
time scale can be converted to mass-to-charge ratio {m/z) by appropriate calibration. The
strengths and limitations of MeV SIMS are shown in Table 3. Table 3: Strengths and limitations of MeV SIMS [30, 58].
STRENGTHS
• All elements from H onwards can be detected, as individual atoms or in molecular combinations
• Imaging capability (down to pm resolution)
• Capability to depth profile
• Potential for ambient pressure analysis • » l k D a masses can be detected
LIMITATIONS
• High Cost
• Non-commereial instrument - brand new • Sample is sputtered away on < 1 pm scale • Possible mass interferences due to
fragmentation
• Deposition substrate can affect the emission of secondary ions
• Poor mass resolution compared to ToF- SIMS
Literature review
Bailey et al. (2010) have shown how MeV SIMS can be used to analyse overlapping
fingerprints and ink in order to determine their deposition order [30]. Figure 1-9 reports the spatial maps of the paper, fingerprint and ink molecules and where they are located within the sample. It is clearly seen in Figure l-9(d) that the fingerprint molecules are on top of the ink line as the ink signal is partially masked by the fingerprint material. Comparing Figure l-9(d) to Figure l-9(e), where the ink is on top of the fingerprint, it is seen that the ink fully covers the fingerprint as expected.
I 1 200pm I 1 200pm
200pm
^ *
200pm 200pm
(d)
{e)
Figure 1-9: Spatial maps of ions, generated via MeV SIMS of (a) paper; (b) fingerprint
residue; (c) ink and overlays thereof in (d) fingerprint deposited on top of the ink (blue = ink, pink = paper, green = fingerprint, yellow = fingerprint + paper); (e) shows a different
sample where is ink deposited on top of the fingerprint (adapted from [30]).
Figure 1-10 shows how the fingerprint and ink signals vary as a function of analysis time. Figure 1-10(a) (fingerprint deposited on ink) shows a gradual decrease in the fingerprint signal, while the ink signal increases. This is consistent with the fingerprint being sputtered away to reveal the ink underneath. The reverse happens in Figure 1-10(b) (ink deposited on fingerprint), the fingerprint signal increases, whilst there is some decrease in the ink signal. This is consistent with the ink layer being sputtered away to reveal the fingerprint material
beneath [30]. Bailey et ah (2010) suggest that no further research is needed other than to
corroborate their work. It should be highlighted however, that hand cream had to be used in order to achieve any results. Therefore, more research must take place in order to understand the fingerprint chemistry involved in areas where they overlap with ink.
c 1.1-1 O Fingerprint # Ink 0 10 20 30 40 50 60 70 80 90 100 2
8
Fingerprint InkOsSyi’’®! a«6iP>l^r5S3K3
ink
Time%
1 0 2 0 30 40 50 60 70 80 90 100 Time%
Figure 1-10: Depth profiles of (a) fingerprint on top of ink and (b) ink on top of fingerprint [30].
The use of already existing ion beam analysis techniques such as particle induced X-ray emission (PIXE) and Rutherford backscattering spectrometry (RBS) used in conjunction with MeV SIMS will make a highly competitive surface analysis technique [59]. Quantification of the MeV SIMS signal should be less problematic than for ToF-SIMS as these techniques are not as influenced by the same electric field effects [39], [60].
Matsuo et al. (2010) have carried out research into using high energy primary ion beams
for molecular depth profiling and imaging of organic and biological materials [61]. Molecular depth profiling was carried out on an organic multi-layered material using non size-selected cluster ions of Arjoo; the multilayer structure was clearly revealed using Ar
cluster ions. However, Shard et a l (2007) suggest that when Cgo ions are used as primary
ions, the sputtering yield has been reported to be nonlinear and it is difficult to produce clear molecular depth profiles [62]. Molecular imaging was carried out on rat white lipid cells that were seeded and cultured on sterilised silicon wafers. The cells were then
analysed by MeV SIMS using a 6 MeV Cu primary ion beam. Figure
![Figure 1-2: Set up of a desorption electrospray ionisation instrument coupled with a mass spectrometer (DESI-MS) [33].](https://thumb-us.123doks.com/thumbv2/123dok_us/478182.2556577/25.851.116.727.611.960/figure-desorption-electrospray-ionisation-instrument-coupled-spectrometer-desi.webp)
![Figure 1-3: Desorption electrospray ionisation image of the distribution of cocaine on a latent fingerprint blotted on glass (modified with the addition of a scale bar) [35].](https://thumb-us.123doks.com/thumbv2/123dok_us/478182.2556577/27.849.271.556.330.649/figure-desorption-electrospray-ionisation-distribution-fingerprint-modified-addition.webp)
![Figure 1-4: Desorption electrospray ionisation images of a forged number on paper [36].](https://thumb-us.123doks.com/thumbv2/123dok_us/478182.2556577/28.848.237.595.89.431/figure-desorption-electrospray-ionisation-images-forged-number-paper.webp)
![Table 2; Strengths and limitations of keV time-of-fiight-seeondary ion mass spectrometry (ToF-SIMS) [44].](https://thumb-us.123doks.com/thumbv2/123dok_us/478182.2556577/29.848.83.755.551.977/table-strengths-limitations-time-fiight-seeondary-spectrometry-sims.webp)

![Table 4: Strengths and limitations of matrix assisted laser desorption ionisation [63-66].](https://thumb-us.123doks.com/thumbv2/123dok_us/478182.2556577/41.844.76.728.195.1049/table-strengths-limitations-matrix-assisted-laser-desorption-ionisation.webp)
![Table 6 : Strengths and limitations of attenuated total reflectance - Fourier transform infrared spectroscopy [79].](https://thumb-us.123doks.com/thumbv2/123dok_us/478182.2556577/50.841.76.752.615.942/strengths-limitations-attenuated-reflectance-fourier-transform-infrared-spectroscopy.webp)