Handbooks 47c
Labour Cost Index 2008=100
Handbook for Users
Handbooks 47c
Labour Cost Index 2008=100
Handbook for Users
Inquiries: Pekka Haapala Hanna Jokimäki +358 9 17 341 tvkindeksi@stat.fi
Homepage: www.tilastokeskus.fi /til/tvki/index_en.html
Layout: Marita Potila
©
2013 Statistics FinlandQuoting is encouraged provided Statistics Finland is acknowledged as the source.
ISSN 1797–9439 = Handbooks
Foreword
Statistics Finland published its first revised labour cost index in June 2009. The base year of the revised index is 2008. In its concepts and methodological descriptions this handbook is based on the publication Cost of an hour worked 2000–2007, Labour Cost Index 2003 = 100.
The descriptions and methods of the new index are updated to the handbook as to changes made. The handbook update was prepared by Outi Ahti-Miettinen, Pekka Haapala, Kati Heikkinen, Hanna Jokimäki, Pentti Jonninen, Seppo Kouvonen and Antti Suoperä.
Helsinki, Statistics Finland, September 2013 Hannele Orjala
Contents
1 What is the labour cost index? . . . .5
1.1 About the history of the labour cost index . . . 5
1.2 Regulations guiding the calculation of the labour cost index. . . 5
1.3 The theory of the labour cost index . . . .6
1.4 National and international labour cost index. . . 6
2 What does the labour cost index measure?. . . .8
2.1 The structure of the labour cost index . . . .8
2.2 Focus on costs per hour worked . . . .8
3 Classifications and weight structure . . . .13
3.1 Industry . . . .13
3.2 Classification of costs. . . .13
3.3 Weight structure . . . .15
4 Sample of the labour cost index . . . .16
4.1 Allocation . . . .16
4.2 Drawing of the sample . . . .17
4.3 Estimation . . . .18
5 Calculation of the labour cost index in practice . . . 20
5.1 Processing of the data . . . .20
5.1.1 Preliminary control of data. . . .20
5.1.2 Database controls . . . .20
5.1.3 Imputation of labour input data. . . 21
5.1.4 Finalising the processing of the data. . . 21
5.2 Compilation of the labour cost index . . . .22
5.3 Adjustments for seasonal variation and working days . . . 22
6 Old indices and other information service . . . .26
7 Uses and application of the labour cost index. . . 27
7.1 What is the labour cost index used for . . . .27
7.2 Connections to other statistics describing labour costs . . . 27
8 Calculation examples on the use of the index . . . 28
8.1 Calculating change in cost per hour worked . . . 28
8.2 Calculating change in cost per hour worked by indices with two different base years . 28 8.3 Changing index base year . . . .28
8.4 Calculating own index. . . .28
9 Publication of the labour cost index . . . .29
Appendix 1 Series of the labour cost index (different categories) . . . 30
Appendix 2 Imputation models of labour input . . . .31
Appendix 3 Inquiry forms in manufacturing, services, education and public sector. . . 33
1
What is the labour cost index?
1.1 About the history of the labour cost index
Surveys on labour costs in manufacturing havebeen carried out in Finland since the 1940s. The regulation-based European Community statistics on labour costs were initiated towards the end of the 1960s, after which basic surveys concerning the level and structure of labour costs have been implemented at periodic intervals. Later on Member States were required to supply calcu-lated statistics on the level and structure of la-bour costs for the intermediate years as well.
The foundation of the joint European cur-rency has emphasised the need for continuous monitoring of cost development. The original aim was to produce an index describing the price development of a standardised labour input unit, as an example the US Employment Cost Index. However, the production of an index describing the price development of a standardised labour input unit would have required a significant in-vestment into the collection of basic data. Pri-marily for cost reasons, a decision was made in
the end to use a cost index describing the change in average costs instead of a price index, as it was better suited for the existing statistical systems of many of the largest Member States.
Production of the labour cost index was at first based on a gentlemen’s agreement of the di-rectors of national statistical institutes of the Member States of the European Union (EU) and it was started in 1996. At the initial stage the in-dex was based on the statistical systems existing in the Member States. In Finland the cost devel-opment of hours worked was defined between 1996 and 2002 on the industry level by dividing the monthly earnings for total working hours of a full-time wage and salary earner, determined according to Statistics Finland’s index of wage and salary earnings and structure of earnings sta-tistics, by the average labour input for a month. The number of working hours of full-time wage and salary earners was based on Statistics Fin-land’s employment statistics.
1.2 Regulations guiding the calculation of the labour cost index
The experiences gained from the first labourcost index soon showed that to attain sufficient international comparability, the compilation of the index would have to be defined on the basis of an EU regulation. Since 2003 the compilation of the index has been decreed by Regulation No 450/2003 of the European Parliament and of the Council and by related Commission Regulation No 1216/2003 on its implementation. In the first phase the regulation-based statistical obliga-tion related only to manufacturing and private service sector industries. The industry coverage of the index was enlarged by the Commission’s new implementing Regulation No 224/2007 to concern from 2007 onwards the industries of so-called welfare services for which the public sector is mainly responsible. The European
Par-liament yearly monitors the quality of the labour cost index on the basis of a report submitted by the Commission.
The concepts and classifications of the labour cost index are defined in the Commission’s im-plementing Regulation. The index series based on the years 1996 to 2008 is based on the EU’s Standard Industrial Classification NACE Rev. 1 of that time. From 2009 the index is based on the EU’s present Standard Industrial Classifica-tion NACE Rev. 2. In connecClassifica-tion with the intro-duction of the new classification each Member State also had to produce retrospective time ser-ies with the new Standard Industrial Classifica-tion starting from 2000.
1.3 The theory of the labour cost index
The labour cost index is a unit value indexdes-cribing quarterly change in average costs per hour worked. In the Regulation concerning the labour cost index the basic formula for a Laspeyres index for period t is defined as fol-lows: LCI h h w h W tj i t i j i i j i j i i t i j i j i j i i j i i t =
∑
= =∑
∑
∑
w w w w w ( / ) ( /wi) j i j i i j i W W∑
∑
where wit= labour costs per hour worked
in industryiin periodt hi
t
= hours worked by employees in
industryiin periodtand
Wi j =wi j *hi j
labour costs of employees in industryiin annual periodj
The index describing the basic series of the industry’s main group level depicts the avera-ge chanavera-ge in labour costs in the industry. The indices relating to industry sums are thus for-med from the price ratio w / wi
t i
j concerning each basic series and from its weight W
W i j i j i
∑
.The weights must be used in the index calcula-tion within two years from the time period they refer to.
The annual link between the indices of years j andj+1is thus of the form:
K h h j j i j i j i i j i j i , + + =
∑
∑
1 1 w w wherewi 1j+ = average price of the year (j+1) following the base year in industryi,
wi
j= average price of the base year in industryi,
hi
j= number of hours worked in the base year in industryi.
The labour cost index is part of statistics on economic trends reacting easily to short-term cost changes. Statistics on labour cost index are published almost in real time within 70 days of the end of the quarter. The labour cost index describes the price pressures caused on the labour market through changes in the wages and salaries sum and in unit cost per hour worked.
The index is also useful when analysing rea-sons for the change in the wages and salaries sum. It can be used to decompose the change in the wages and salaries sum into price (cost per hour worked) and volume components (number of hours worked) and also to specify the impact of one-off cost components. At the same time it is possible to expand on the analysis concerning both labour productivity and unit labour costs.
The change in unit labour costs can be sum-marised into the expression:
Δ(unit labourcost) =(Δvolume of labour input)* (Δaveragec v
ost per hour worked olume of production
)
( )
Δ
1.4 National and international labour cost index
As the calculation of the labour cost indexchanged from 2003 to be regulation-based, its production model also had to be re-evaluated in Finland. In compliance with the obligations of the Statistics Act, the production model of the index was still to be built on existing data, in which case the index of wage and salary earnings was of crucial importance. Utilisation of the ex-isting data was intensified by specifying the im-putation bases of one-off pay components and by using seasonally adjusted values in measuring hours worked in the working month.
However, the experiences gained from the revised production model soon showed that the objectives of the Regulation could not be reached when using the available basic statistics. Work on an index based on quarterly collected empirical cost data was started in 2005 and pub-lication of data at the beginning of 2009. Data collection began in the private sector in 2007 and in the local government sector in 2010. The data of the central government sector are based on the administrative TAHTI register. Since 2007 the index derived from empirical data has
been based on the Standard Industrial Classification TOL 2008 (NACE Rev.2).
The labour cost index released by Eurostat, the Statistical Office of the European Commu-nities, is based for Finland on empirical basic data from 2009 onwards. According to the EU Regulation, from the statistical year 2007 on-wards the index must also cover industries O to S, for which mainly the public sector holds re-sponsibility. The labour cost index data in the central government sector are derived directly from the State Treasury’s TAHTI register and do not require separate data collection. The data cover all government agencies. In the local gov-ernment sector, data collection began with the three largest municipalities in 2008 and was gradually extended to cover the entire local gov-ernment sector by 2012. For the time being the effect of the local government sector has been estimated in the index series Statistics Finland has supplied to Eurostat on the basis of average earnings of the index of wage and salary earn-ings. The costs of the congregations are not at this stage yet taken into account when determin-ing the cost development of the EU’s index. At
the moment, Eurostat releases the index for Fin-land only on the industry level. The index has, until 2012, been produced only as a raw series, that is, unadjusted for working days and seasonal variation. In the autumn of 2012, a seasonally adjusted index for the private sector has been produced as the time series became long enough for working day and seasonal adjustments. The government’s seasonally adjusted indices are also calculated for the index series that are delivered to Eurostat.
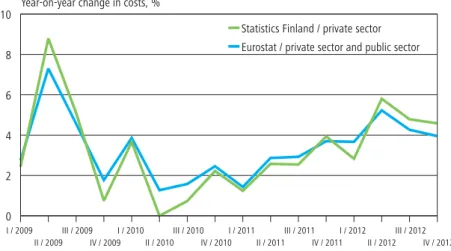
Figure 1A shows that the inclusion of the public sector lowered the change in average costs in 2009, raised it in 2010 and 2011 and lowered it again in 2012.
The national labour cost index is released quarterly around 70 days after the end of the quarter on Statistics Finland’s Internet pages. The national index also covers all industries. Data are released on the main industry sums, six main groups (C, F, G, H, J and K) and on four sub-industries of manufacturing (food industry, forest industry, chemical industry and metal in-dustry), as well as on the central and local gov-ernment sectors’ industry sums.
0 2 4 6 8 10
Statistics Finland / private sector
Eurostat / private sector and public sector
Year-on-year change in costs, %
I / 2009 II / 2009 III / 2009 IV / 2009 I / 2010 II / 2010 III / 2010 IV / 2010 I / 2011 II / 2011 III / 2011 IV / 2011 I / 2012 II / 2012 III / 2012 IV / 2012 Figure 1A.
Change in labour cost per hour worked compared with the corresponding quarter of the previous year according to Eurostat and Statistics Finland in 2009–2012
2
What does the labour cost index measure?
2.1 The structure of the labour cost index
The labour cost index is a unit value indexmeas-uring the quarterly change in average labour costs per hour worked. On the main group level of the industry the index describes the change in average costs. The cost development of industry sums is determined by weighting the cost devel-opment of the industry main groups with cost weights derived from the previous year or the year before it.
The change in labour costs is broken down to three sub-indices:
– The index of wage costs measures the change in wages and salaries calculated per hour worked. Wage costs include all pay and bon-uses according to Section 13 of the prelim-inary tax withholding act (No 1118/1996), thus also costs incurred by payments in kind and incentive stock options.
– The social cost index measures the develop-ment of employers’ statutory and voluntary social insurance contributions calculated per hour worked. The change is measured on the basis of the payment rate, so the time of pay-ment or possible retrospective or refunded payments do not influence the cost develop-ment.
– The labour cost index without one-off pay components measures the change in wage costs and social costs without extraordinary or one-off pay components. Such are typ-ically performance-based bonuses, holiday bonus, holiday supplement, part of seniority increments paid in hourly paid branches and costs raised by incentive stock options and contractual pay increases paid retrospectively from previous pay periods.
2.2 Focus on costs per hour worked
The data suppliers’ responding possibilities areensured by using in the collection of basic data the concepts applied in payroll accounting in the branch in question. The collection of basic data thus makes use of four forms, which are pre-sented in Appendix 3 of this handbook. The form for hourly-paid branches is used in
enter-prises where a significant part of the personnel are under collective agreements for hourly-paid employees, such as manufacturing, motor vehi-cle sales and transport. The education form is used by those employers in education where the working time of the teaching personnel is based on compulsory teaching time, not total
remu-19,2 71,1
2,4 5,7
1,6
2009
0% 20% 40% 60% 80% 100%
Social insurance contributions Earnings for total working time
Performance-based bonus Other one-off components Other costs
Social cost index Costs without one-off components Index of wage costs
Labour cost index
Figure 2A.
neration. In service enterprises, use is made of a questionnaire where data on part-time personnel is separated from the total data for the enter-prise. Part-time are all service relationships where an employment contract for part-time employees is valid. In addition to the education form, a public sector form where data for full-time and part-time employment as well as hourly-paid personnel are separated is used in the local government sector. Comparability be-tween data from different branches is ensured by means of processing rules connected to the pro-duction process.
Data collection intends to guarantee the comparability between the volume of the paid wages and salaries sum and hours worked. The data supplier must report the wages and salaries paid in the pay periods ending during the statis-tical quarters. This may include pay components paid retrospectively from previous quarters or one-off pay components. The reported number of hours worked must correspond to the amount of pay remunerated. Therefore, for example overtime hours must be recorded in the statisti-cal quarter during which most of the overtime pay is remunerated.
Number of employment relationships at the end of the statistical reference period
Data suppliers must report the number of paid employment relationships at the end of the sta-tistical reference period. Employment rela-tionships of those on unpaid leave for over two
weeks (e.g. laid off, military service, sickness lea-ve or daily allowance part of parental lealea-ve) are not taken into account. In hourly-paid branches hourly and monthly-paid employment rela-tionships are presented separately, in service branches full-time and part-time employment re-lationships. In the local government sector, full-time and part-time employment as well as hourly-paid personnel are separated.
Number of working hours
The labour cost index describes the change in la-bour costs per hour worked. The total number of hours worked is defined in accordance with Council Regulation (EC) No 2223/96 of 25 June 1996 on the European system of national and regional accounts in the Community.
Employers are not always able to provide re-liable information on the number of hours worked. In that case Statistics Finland imputes the number of hours worked either on the basis of paid hours or compulsory teaching hours. Re-porting the number of hours of work always in-cludes information on the type of labour input reported:
– Hours worked: All employers report the work input of hourly-paid employees as hours worked and approximately one-half of em-ployers report the work input of monthly-paid employees as hours worked. The number of hours worked by the hourly-paid can usually be determined direct from payroll accounting. A working time monitoring system is generally
Hourly-paid in manufacturing Monthly-paid in manufacturing Services Teaching personnel in education Non-teaching personnel in education Public sector Statistical period x x x x x x
Number of employment rel. at end of period x x x x x x
Number of hours worked – either either x x x
Number of hours paid – or or – – x
Number of teaching hours – – – x – –
Volume of teachers’ other work than teaching – – – x – –
Number of paid sickness leave – – – x – x
Wages and salaries subject to withholding tax x x x x x x
Monetary pay for hours worked x – – – – –
Sunday and overtime pay premiums x – – – – –
Wages and salaries paid for hours not worked x – – – – –
Pay for extra and overtime work – x x x x x
Performance-based bonuses x x x x x x
Other extraordinary or one-off pay x x x x x x
Ordinary wages and salaries – – – x x x
Tariff of social insurance contributions, % x x x x x x
Table 2A.
needed for reporting the number of hours worked by monthly-paid employees. The number of hours worked can be calculated by deducting paid and unpaid absences from the theoretical working hours and by adding over-time hours to it. Only extra and overover-time hours compensated during the statistical quar-ter are recorded as overtime hours. Hours ac-tually worked also include paid working time used for personnel training.
– Paid hours: The hours included in regular working time for which employees have been paid normal, raised or lower pay (long sickness leaves) are reported as paid hours. Mid-week holidays on working days are also included in the paid working time for monthly-paid em-ployees. Paid working time during holiday is defined according to the normal period at work. Paid working time also comprises time off granted due to shortening of working hours. – Teaching hours: Teaching hours of full-time
or part-time teachers working under a work-ing time arrangement based on compulsory teaching time must be reported according to compulsory teaching. When determining the number of teaching hours teachers’ all over-time hours are taken into consideration. The number of hours worked in education is im-puted by multiplying compulsory teaching time with the coefficient 1.5 and by adding to the value derived other hours worked than those based on compulsory teaching. For full-time teachers the number of days absent due to sickness is also specified, which in part supports the calculation of hours worked. Wages and salaries subject to preliminary withholding tax in total
Wages and salaries subject to preliminary with-holding tax comprise pay and bonuses including benefits in kind paid during the pay period end-ing durend-ing the quarter in accordance with Section 13 of the preliminary tax withholding act. Wages and salaries include the pay paid for the labour input in the period in question, that paid retro-spectively for other than the above reported la-bour input and remuneration paid one-off or at regular intervals. Wages and salaries subject to preliminary withholding tax comprise such as wage costs arising from exercising of incentive stock options. In the inquiry concerning educa-tion a specificaeduca-tion is requested of ordinary wages and salaries.
Monetary pay for hours worked by the hourly-paid Monetary pay for hours worked by the hourly-paid is reported mainly according to the practice used in the agreement sector. Monetary pay for hours worked includes monetary pay paid on the basis of direct work performance, that is,
– Time-based, contract and premium pay, – Sunday and overtime pay premiums,
– Various supplements for shift work, evening and night work, and
– Supplements for adverse working conditions. The compensation granted for adjustment of working hours should always be included in pay for hours not worked regardless of the practice in the agreement sector. This is done to advance the comparability of statistics production be-tween agreement sectors and to ensure coher-ence between wage costs and paid hours. Pay premiums for extra, Sunday and overtime work for the hourly-paid
Pay premiums for overtime and Sunday work and work done during weekly period of time off included in monetary pay for hours worked are specified for hourly-paid employees.
Pay of the monthly-paid paid for extra and overtime work
Pay for extra and overtime hours included in wages and salaries subject to preliminary with-holding tax is specified in the inquiry. It is pay received by the wage and salary earner for work done outside regular working hours determined on the basis of hours worked. Regardless of the payment basis, the pay includes all pay compo-nents paid for extra and overtime work, also that paid on the basis of work-related shift, Sunday or public holiday work.
Pay of the hourly-paid for working hours not worked
The pay included in wages and salaries subject to withholding tax for other than hours worked paid on the basis of working hours is specified for the hourly-paid, that is,
– Wages and salaries paid during annual leave, – Compensation during public holidays, – Compensation for shift leave,
– Wages and salaries paid during absence due to illness or an accident,
– Pay related to child birth and child care, – Separate allowance or pay paid for adjusting
working time,
– Compensation for on-call work. Performance-based bonuses
The performance-based bonus and cash-based profit-sharing included in wages and salaries sub-ject to withholding tax are reported for both hourly-paid and monthly-paid employees. Agreements are made about systems concerning performance-based bonuses at each enterprise. The performance-based bonus is generally based on the financial result, realisation of productivity or development targets. The bonus usually accu-mulates in longer periods than a pay period. It is based on other than direct work performance. Other extraordinary or one-off pay
Other extraordinary or one-off pay included in wages and salaries subject to withholding tax is re-ported for both hourly-paid and monthly-paid em-ployees. These pay components are not typically included in the wage and salary earner’s continu-ous remuneration paid for each pay period. Other extraordinary or one-off pay includes such as: – Holiday bonus and holiday supplement, – Cost incurred by exercising of incentive stock
options,
– Seniority increment or similar paid at irregu-lar intervals
– Allowance for time off in compensation for shortened working hours paid at irregular in-tervals,
– Emergency call-out allowance,
– Pay related to ending of an employment rela-tionship (pay for the period of notice without the obligation to work, redundancy pay), – One-off component paid on the basis of the
collective agreement, – Initiative bonuses, and
– Pay increase paid retrospectively from the previous quarter.
Teaching hours in education
For teaching personnel following the working hours of compulsory teaching, reported is the number of teaching hours held in the quarter (full-time and part-time teaching personnel). The labour input is reported separately as teach-ing hours held and as other than teachteach-ing hours. The labour input of other personnel must always be reported as hours worked.
Club and remedial teaching hours in education For teaching personnel following the working hours of compulsory teaching, reported is the number of club and remedial teaching hours
held during the quarter (included in teaching hours reported).
Other than teaching hours in education
For full-time teaching personnel, other working hours than teaching (e.g. hours during planning and training according to collective bargaining agreement). Preparatory and subsequent work related to compulsory teaching hours is not re-ported here as they are imputed.
Paid days of absence due to sickness
Paid (incl. partly paid) days of full-time teaching personnel following the working hours of com-pulsory teaching due to sickness absences and family leaves. Sickness absences and family leaves of part-time teaching personnel and other school personnel are not reported.
Ordinary wages and salaries in education and the local government sector
For education and local government sector re-ported is the ordinary wages and salaries actually paid in the statistical reference period, which, in addition to basic pay, includes allowances of fixed amount, such as seniority allowances, re-mote area allowance, language allowance and al-lowance for shop stewards. The concept of ordin-ary wages and salaries is needed when paying wages and salaries during annual leave and sick leave and maternity leave, for instance.
One-off hourly fees in education
In education pay for extra and overtime work in-cluded in wages and salaries subject to withhold-ing tax. In teachwithhold-ing only overtime hours com-pensated as one-off hourly fees are interpreted as extra and overtime work, not annual weekly overtime hours compensated monthly by the same sum throughout the year. Working time compensated by a leave of similar length is not counted in extra and overtime work.
Tariff of social insurance contributions
The change in labour costs caused by social in-surance contributions is evaluated by means of payment tariffs. When determining the costs the change in the enterprise’s personnel structure should be taken into account. In contrast, the ef-fect of the payment period, such as back ments, refunds of payments or advance pay-ments, are meant to be excluded from the measured cost development.
The cost tariff caused by social insurance contributions is usually determined at the begin-ning of the year in accordance with the new
charge criteria and after that they stay the same throughout the year unless there are significant changes in the personnel structure or the social insurance contributions of the enterprise. For example, in 2009 the general reduction in social security contributions lowered enterprises’ social cost tariff by 0.8 per cent from the beginning of April.
The tariff must cover enterprises’ all statu-tory and voluntary social insurance contribu-tions, that is,
– Employment pension contributions,
– Pensions paid by enterprises direct to their employees,
– Employers’ social security contributions, – Statutory and voluntary accident insurance
payments,
– Unemployment insurance contributions, – Group life insurance contributions, and – Costs from other voluntary insurance related
to use of labour input.
Statistics Finland determines the value of the enterprise’s social costs on the basis of the pay-ment tariff and the wages and salaries sum.
3
Classifications and weight structure
3.1 Industry
The calculation of the labour cost index is based on the Standard Industrial Classification. The EU’s Regulation requires submittal of the results according to the main groups of the new TOL 2008 as well as on separately defined industry sums. In the national publication cost develop-ment is also specified for four key manufacturing industries (food industry, forest industry, chem-ical industry and metal industry).
The classifications of the indexation stage de-termine the classification level used in the collec-tion and processing of the data. The sample used in the collection of basic data is stratified according to the main industry group, which specification may be the basis for the basic series of the
chain-linked index as well. Data suppliers are re-quested to specify the basic data for the key indus-tries by industry unit. In practice, the specification of costs by industry is actually made only in a few enterprises.
The revised Standard Industrial Classification NACE Rev. 2 was introduced in the printouts of the labour cost index (2008=100) at the beginning of 2009. At the same time, the index based on empirical data for the years 2007 and 2008 was re-leased in accordance with the new classification. The indices of the previous base year (2003 = 100) are published only according to the old Standard Industrial Classification (NACE Rev. 1.1).
3.2 Classification of costs
By definition, labour costs refer to total costs in-curred by employers in the employment of em-ployees. Labour cost items and the total numberof paid personnel are defined in Commission Regulation No 1737/2005 concerning imple-mentation of statistics on labour costs.
D1 Compensations of employees
D11 Wages and salaries
D111 Wages and salaries (excluding apprentices)
D1111 Direct remuneration, bonuses and allowances
D11111 Direct remuneration, bonuses and allowances paid in each pay period
D11112 Direct remuneration, bonuses and allowances not paid in each pay period
D1112 Payments to employees’ savings schemes
D1113 Payments for days not worked
D1114 Wages and salaries in kind
D11141 Company products
D11142 Staff housing
D11143 Company cars
D11144 Stock options and share purchase schemes
D11145 Other wages and salaries in kind
D112 Wages and salaries of apprentices
D12 Employers’ social contributions
D121 Employers’ actual social security contributions (excluding apprentices)
D1211 Employers’ statutory social contributions
D1212 Collectively agreed, contractual and voluntary social security contributions
D122 Employers’ imputed social contributions
D1221 Guaranteed remuneration in the event of sickness
D1222 Employers’ imputed social contributions for pensions and occupational health care
D1223 Payments to employees leaving the enterprise
D1224 Other employers’ imputed social contributions
D123 Employers’ social contributions for apprentices
D2 Vocational training costs
D3 Other expenditure paid by the employer
D4 Taxes
D5 Subsidies received by the employer
Table 3A.
The cost concept used in the labour cost in-dex covers from table 3A compensations of em-ployees (D1). When describing the cost devel-opment a more general classification level may well be used and focus can be put on the key cost concepts. Thus the costs of vocational edu-cation (D2), employer’s other costs (D3), and subsidies received by the employer (D5) can be excluded from the quarterly cost description
(they are included in the description area of the labour cost survey). The cost item taxes (D4) is not relevant in Finland. As shown in Figure 2A, around 1.6 per cent of labour costs remain out-side quarterly cost monitoring.
Weight structure
2009 2012
share % share %
Private sector
B Mining and quarrying 0,3 0,3
C Manufacturing 35.6 31.9
D Electricity, gas, steam & air conditioning supply 2.2 1.3
E Water supply, waste management, etc. 0.2 0.5
F Construction 7.1 7.3
G Wholesale and retail trade, etc. 14.6 13.5
H Transportation and storage 5.8 8.2
I Accommodation and food service activities 3.0 1.9
J Information and communication 7.4 8.5
K Financial and insurance activities 4.4 5.1
L Real estate activities 1.1 0.9
M Professional, scientific and technical activities 5.7 5.4
N Administrative and support service activities 4.4 5.2
O Public administration, etc. 1.0 1.2
P Education 1.4 2.3
Q Human health and social work activities 2.4 4.2
R Arts, entertainment and recreation 2.1 0.9
S Other service activities 1.4 1.1
Total 100.0 100.0
State sector
J Information and communication 0.4 0.6
K Financial and insurance activities 0.1 0.1
L Real estate activities 1.0 0.9
M Professional, scientific and technical activities 11.3 13.0
N Administrative and support service activities 3.3 0.1
O Public administration, etc. 79.3 81.6
P Education 2.2 1.6
Q Human health and social work activities 1.9 1.6
R Arts, entertainment and recreation 0.6 0.6
Total 100.0 100.0
Local government sector (large municipalities and joint municipal authorities)
D Electricity, gas, steam & air conditioning supply 0.1
E Water supply, waste management, etc. 1.2
F Construction 0.4
H Transportation and storage 1.2
I Accommodation and food service activities 2.0
J Information and communication 0.5
L Real estate activities 0.6
M Professional, scientific and technical activities 3.0
N Administrative and support service activities 2.3
O Public administration, etc. 8.8
P Education 1.1
Q Human health and social work activities 75.2
R Arts, entertainment and recreation 3.5
S Other service activities 0.1
Total 100.0
Table 3B.
3.3 Weight structure
The labour cost index is a chain-linked index where industry-specific indices are weighted to-gether with industry-specific cost weights. For each year use is made of value share weights cal-culated from the previous year for the cost item in question (wage costs, social costs, costs total, costs without one-off items). However, weights calculated for the year 2007 were used both in the index starting year 2007 and in the following year. Because the coverage of the index varies by industry, the used weight structure may differ somewhat from the structure of Statistics Fin-land’s Business Register, for example.
The indexation of labour costs is made so that the change in average costs in the industry is determined from the aggregates defined on the industry level. In the calculation process level data are thus produced for each quarter on the key index variables, that is, wages and salaries sum, social costs, number of hours worked and costs without one-off items.
Use of endogenous weights in the system en-sures the internal coherence of the index series and their weight structure.
4
Sample of the labour cost index
The description area of structural statisticscon-cerning earnings and labour costs (structure of earnings statistics, labour cost survey) does not include small enterprises with under 10 wage and salary earners and of the industries agricul-ture, forestry and fishing, or public administra-tion. The target population of the labour cost in-dex is both by its size category and industry more exhaustive than this. The target popula-tion of the index also covers small enterprises re-gardless of their size and of the industries, public administration. Of the industries thus only agri-culture, forestry and fishing are left outside the theoretical population of the index.
On the other hand, small enterprises have, due to practical reasons, still been excluded from the empirical survey frame. In general, all enter-prises employing at least 30 wage and salary earners are selected to the survey frame. How-ever, in the industries dominated by small enter-prises, construction (F), trade (G), accommoda-tion and food service activities (I), real estate ac-tivities (L), professional, scientific and technical activities (M) and administrative and support service activities (N), all enterprises employing at least 20 wage and salary earners are selected to the survey frame. In terms of the local govern-ment sector, municipalities with over 5,000
in-habitants and all joint municipal authorities have been selected for the survey frame. The aim is that the population of the statistics would cover at least 60 per cent of the wages and salaries sum of the industry.
The survey frame of the population is formed annually in September by utilising the file in the Business Register formed for the statistics on pri-vate sector wages and salaries. The frame is based on the update situation (t-1) at the end of the year preceding the statistical reference per-iod (statistical year=t). The same survey frame is used for estimating all quarters of the statistical year. However, preliminary data on the first two quarters of each statistical year are based on the survey frame of the year (t-2) preceding the reference period.
The survey frame for the year 2007 was based on the Business Register of mid-2006. At that point the sampling frame did not yet in-clude information on the industry of enterprises in accordance with TOL 2008 (NACE Rev. 2). The industry according to the new classification was determined for the frame using the conver-sion key based on the old industry code. Only af-terwards it was found that the TOL 2008 code formed with the key involved considerable inac-curacy.
4.1 Allocation
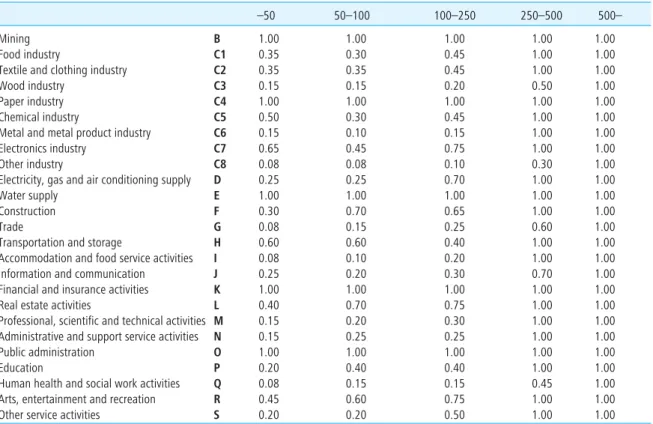
The EU Regulation requires compilation of sta-tistics on changes in labour costs both on the level of the whole national economy and sepa-rately for each main industry group. In addition, for the sake of the national statistics and the effi-ciency of the sampling frame it is necessary to follow the internal cost development of manu-facturing on a rough level as well. For the samp-ling design manufacturing is divided into seven sub-industries (see Table 4A). The allocation of the sample by industry is thus based on psumed use – a specific industry stratum is re-served in the sampling frame for each index ac-cording to the publication objective.
The average unit costs per hour worked are known to vary somewhat depending on the size of the enterprise. Enterprises are skewed as to size, the presumed non-response rate is higher for small enterprises and large enterprises cover the majority of the wages and salaries sum. In
the survey frame the representativeness of all size enterprises is meant to be ensured for the collected data. The survey frame for the private sector is therefore stratified by the number of wage and salary earners into five size categories.
When determining the sampling ratios of strata the sample is allocated so that as accurate and unbiased estimates as possible could be pro-duced for the population so that useful estimates could be obtained for the output variable from each subgroup. When using the Neyman alloca-tion, the coefficients of variation for the esti-mates of some industries would become large es-pecially on the main group level of the new Standard Classification of Industries. If the aim was to have as small coefficients of variation as possible for the estimates of all industries, the coefficient of variation for the estimate of the whole population would then rise.
The allocation of stratum-wise sampling rates was based on two-phase power allocation. Choos-ing the power 0.5 (i.e. square root) was used to ensure results fit for publication both on the lev-els of the national economy and main industries while the aim of performing the allocation in two phases was to guarantee optimal allocation of the sample with respect to different size enterprises. The construction of sampling rates was started by determination of sample sizes for all 25 industry strata, in the second phase for all size strata of the
industry. The anticipated non-response rate was taken into account in sample size determination.
Table 4A presents the targeted theoretical sampling ratios. Attainment of results fit for publication requires data collection from all en-terprises in certain small industries. In most in-dustry strata the sample selected covers all en-terprises employing at least 250 wage and sal-ary earners.
4.2 Drawing of the sample
The sampling method used is simple stratified random sampling without replacement. In terms of the private sector, the sample unit is an enter-prise and the sample criteria are the enterenter-prise’s industry and size category. A random sampling number defined for each enterprise in the frame is used in drawing the sample. This is utilised in the annual update of the sample. Table 4B presents the key parameter figures of the original sample drawn for the year 2007. No major changes have taken place in the figures since 2007.The sample of the labour cost index is up-dated yearly. In that connection the industry and size strata for the enterprises belonging to the survey frame are defined according to the new frame and enterprise closures are removed from the frame and new enterprises are added to it. The size and allocation of the additional sample are decided by comparing the realised sampling ratios with those according to the target design (Table 4A).
So far only a few operating enterprises have been removed from the sample drawn for the
–50 50–100 100–250 250–500 500–
Mining B 1.00 1.00 1.00 1.00 1.00
Food industry C1 0.35 0.30 0.45 1.00 1.00
Textile and clothing industry C2 0.35 0.35 0.45 1.00 1.00
Wood industry C3 0.15 0.15 0.20 0.50 1.00
Paper industry C4 1.00 1.00 1.00 1.00 1.00
Chemical industry C5 0.50 0.30 0.45 1.00 1.00
Metal and metal product industry C6 0.15 0.10 0.15 1.00 1.00
Electronics industry C7 0.65 0.45 0.75 1.00 1.00
Other industry C8 0.08 0.08 0.10 0.30 1.00
Electricity, gas and air conditioning supply D 0.25 0.25 0.70 1.00 1.00
Water supply E 1.00 1.00 1.00 1.00 1.00
Construction F 0.30 0.70 0.65 1.00 1.00
Trade G 0.08 0.15 0.25 0.60 1.00
Transportation and storage H 0.60 0.60 0.40 1.00 1.00
Accommodation and food service activities I 0.08 0.10 0.20 1.00 1.00
Information and communication J 0.25 0.20 0.30 0.70 1.00
Financial and insurance activities K 1.00 1.00 1.00 1.00 1.00
Real estate activities L 0.40 0.70 0.75 1.00 1.00
Professional, scientific and technical activities M 0.15 0.20 0.30 1.00 1.00
Administrative and support service activities N 0.15 0.25 0.25 1.00 1.00
Public administration O 1.00 1.00 1.00 1.00 1.00
Education P 0.20 0.40 0.40 1.00 1.00
Human health and social work activities Q 0.08 0.15 0.15 0.45 1.00
Arts, entertainment and recreation R 0.45 0.60 0.75 1.00 1.00
Other service activities S 0.20 0.20 0.50 1.00 1.00
Table 4A.
year 2007. This is due to considerable natural rotation of enterprises, or their closures or mer-gers of operations. In addition, a few data suppliers have been granted transition times for responding or, for compelling reasons, an exemption from re-porting data concerning working hours. Once the inquiry has become established, the significance of rotation will grow.
In the local government sector, simple ran-dom sampling without return is also used as a sampling method. The sampling unit is a munici-pality. As the index was extended to include in-dustries that mainly operate in the public sector,
the sample initially in 2008 to 2011 only in-cluded the three largest municipalities. In 2011, 17 large municipalities and 20 largest joint mu-nicipal authorities were added in the sample. For the 2012 sample, municipalities with fewer than 50,000 inhabitants were drawn for the sample and more larger joint municipal authorities were also included in the sample. Thus the municipal sample has expanded gradually to cover the en-tire municipal sector. So far, only the data of the 20 largest municipalities and 20 largest joint mu-nicipal authorities are used in index calculation.
4.3 Estimation
Before the calculation of final estimation coeffi-cients, the survey frame is stratified again to cor-respond to the industry and size data at the be-ginning of the statistical reference year. Some of the enterprises in the sample have contracted during the year preceding the statistical year be-low the be-lower limit of the frame. Enterprises not belonging to the frame but having answered to the inquiry are taken to the survey data without a weighting coefficient. The same survey frame, updated to the level at the beginning of the year, is used for estimating all the quarters of the sta-tistical year.
Estimation of the change in labour costs is based on cost and labour input estimates esti-mated on the industry main group level (=index basic series). The average wage cost per hour
worked in stratumh(orWh) is defined from the expression W Y T y t h hi hi hi i n hi i n h h = = = =
∑
∑
1 1 / whereYhi = total of wages and salaries sum of enterprisesiin stratumh,
Thi = total of hours worked in enterprisesiin stratumh,
yhi = wages and salaries sum of enterpriseiin stratumh,
thi = sum of hours worked by enterpriseiin stratumh, i = enterprise h = stratum Branch/ Stratum Size of sample, enterprises (n) Population, enterprises, (N) Sample ratio, % (n/N)
Wage and salary earners in the sample, Business Register (Tn)
Wage and salary earners in popula-tion, Business Register (TN)
Share of wage and salary earners in the sample (%) Total 2,040 6,814 29.9 598,807 895,262 66.9 B 17 17 100.0 1,792 1,792 100.0 C 435 1,542 28.2 196,975 290,124 67.9 D 27 63 42.9 7,293 9,582 76.1 E 20 20 100.0 1,798 1,798 100.0 F 296 707 41.9 41,448 57,329 72.3 G 221 1,343 16.9 85,865 143,532 59.8 H 178 290 61.4 42,148 51,066 82.5 I 36 259 13.9 13,462 23,462 57.4 J 112 350 32.0 37,887 60,228 62.9 K 143 143 100.0 33,809 33,809 100.0 L 45 93 48.4 2,879 4,580 62.9 M 110 503 21.9 16,666 37,194 44.8 N 150 655 22.9 63,588 88,896 71.5 O 18 18 100.0 8,527 8,527 100.0 P 66 184 35.9 11,574 19,015 60.9 Q 55 335 16.4 14,755 35,714 41.3 R 49 86 57.0 5,807 7,692 75.5 S 62 206 30.1 12,902 20,986 61.5 Table 4B.
The basic data collected with the sample are raised to the industry level with the traditional Horwitz-Thompson estimator. There the esti-mation coefficient based on the inverse of the sampling probability is defined from the survey frame by strata on the basis of the wages and sal-aries sum share of the responded enterprises. Es-timation is based on the wages and salaries sum of the wage and salary indices of each quarter.
k p P hi hi i n hi i N h h = = =
∑
∑
1 1 1 wherephi = wages and salaries sum in
the responded enterprisesiin stratumh Phi = total of wages and salaries sum of
enterprises i in stratumh,
i = enterprise,
h = stratum
Specific estimation coefficients are defined for each quarter using the same survey frame corresponding to the situation at the beginning of the year. Enterprises included in the frame that have not responded but have been found to have closed operation or merged during data col-lection are interpreted as having responded. So-called fading enterprises are regarded as hav-ing responded only if their response is included in the data.
5
Calculation of the labour cost index in practice
5.1 Processing of the data
5.1.1 Preliminary control of data
The enterprises selected to the sample provide data on different quarters through an Internet application. For this process written replying in-structions are supplied to the enterprises. Basic data concerning the enterprise are pre-filled on the form, but respondents can also update them. The respondent has access to the response values concerning the preceding quarter as well. If the enterprise has had significant activity in several industries, the data are requested separately for each industry unit. The application mainly con-tains restrictions related to value ranges. In error cases the system notifies of erroneous values. Er-roneousness of the data does not, however, pre-vent them from being submitted.
The basic data collected with the electronic data collection application are pre-checked before entering them in the database. In practice, the pre-liminary control has two parts: controlled are com-pulsory data(numbers of wage and salary earners, definition basis and number of hours, wages and sal-aries sum subject to withholding tax, tariff of social insurance contributions and statistical period)as well as the respondent’s contact details. Erroneousness of the data does not prevent them from being en-tered in the production database.
In connection with the preliminary control the return monitoring code is also updated, the alternatives being deficient, returned or non-re-sponded. The correction is in practice made ei-ther by putting clearly deducible correct data in place of erroneous data or by asking the data supplier for additional information. The data on the respondent’s activity are also checked during the preliminary control phase. The changes are entered in the database with the alternatives:
closed, merged, fading (number of wage and salary earners clearly lower than in the frame).
5.1.2 Database controls
The aim of the controls made in the database is to ensure that the basic data on labour costs per hour worked/paid reported by data suppliers are truthful and to indicate probably untruthful val-ues for further actions.
When the data collection for an individual en-terprise starts, the logicality and level of key basic
data (number of wage and salary earners, number of hours worked, wages and salaries sum) are en-sured. Controls on enterprises having previously answered to the inquiry are based on the quar-terly change in data concerning each enterprise. On data entered in the database controlled are: – Quarterly change in unit cost calculated per
hour worked/paid,
– Change in the definition basis of hours, – Summation of hourly-paid employees’ pay
specification, and
– Change in the tariff of social insurance contributions.
The control process relating to the quarterly change of unit cost per hour worked goes as follows: 1. The enterprise’s labour cost per hour
worked/paid without one-off components is compared with the enterprise’s
corresponding value in the previous quarter. 2. The comparison group of the enterprise is
defined according to the industry stratum defined for the enterprise.
3. Control limits are determined for each comparison group on the basis of the decile distribution relating to the unit change in wage costs. The smallest change is defined as the lower limit for the change in wage costs -the change limit corresponding to -the first decile (D10). Correspondingly, the biggest quarterly change is used as the upper limit – the change limit corresponding to the last decile (D90).
4. An observation value remaining within the limits is accepted. Observation values below the lower limit and above the upper limit are marked as outliers and they are printed on the control list.
The list of those printed on the control list (good 20 per cent of all observations) is checked manually by retrieving the data to the correction display of the application. When the data to be controlled are checked the correction display shows the parameters and their quarterly changes calcu-lated from the data of the previous and current quarters. When controlling, use can also be made of a micro level hourly cost report, which shows the long-term development of enterprises’ hourly costs.
5.1.3 Imputation of labour input data
The labour cost index measures the change in la-bour costs calculated per hour worked. With a few exceptions, data suppliers can report the la-bour input of hourly-paid employees in hours worked. In contrast, over one half of the labour input of monthly-paid employees is given as paid hours – not worked. The imputation application concerning the number of working hours en-sures that in addition to the data on empirical hours (hours worked vs. paid), data defined with the regression model on the number of both hours worked and paid hours are always avail-able for each data supplier.
Data on the number of hours worked based on imputation are used when the enterprise has reported labour input in paid hours. Imputed data on the number of hours worked are also used to replace empirical basic data of unsatis-factory quality, which, despite attempts, could not be corrected in the control phase. The share of qualitative changes is under five per cent of the labour input. When available are quarterly data on both the number of the enterprise’s paid hours and hours worked, it is also possible to fol-low the change in paid free-time and its effects on the development of labour costs.
The imputation of the labour input of hourly-paid and monthly-paid employees in manufacturing and in service industry is based on separate models. The model specifications of these regression models (structure and func-tional form) are very similarsimple log models. The models are made for groups formed separately on the basis of industry strata in each quarter. The imputation goes as follows:
1. The dependency of reported paid hours is estimated between enterprise-specific features (e.g. for monthly-paid employees in manufacturing: numbers of full-time and part-time employees in the current and previous quarters, number of paid hours in the previous quarter, in the service sector the share of part-time employees). In the models the explanatory variables used are the number of full-time and part-time wage and salary earners (or the relative share of the number of part-time employees) and the square root of the number/share both at the beginning and end of the statistical quarter. The square root transformation of numbers is used as the explanatory variable of paid hours, because the marginal effect on total labour input caused by an increase in labour
force is smaller for large enterprises. At first a problem caused by the skewness of basic data made it more difficult to estimate labour input in large enterprises – there were no balanced basic data on large enterprises reporting hours worked and paid hours. 2. Predictions concerning paid hours are
calculated both for enterprises reporting hours worked and paid hours using the coefficients of enterprise-specific features estimated in stage 1. The imputation is based on the linear combination of estimated coefficients and for missing data, of enter-prise-specific features.
3. Estimated is the dependency of the reported hours worked on the imputed paid hours. In the models the explanatory variable used is the number of paid hours and its square root. 4. Predictions concerning hours worked are
calculated both for enterprises reporting hours worked and paid hours using the coefficients of the enterprise-specific features estimated above.
Thus those enterprises that reported the data in paid hours (hours worked) a prediction is made on the number of paid hours (hours worked) and imputed number of hours worked (paid hours) is calculated.
The models are presented in Appendix 2 of this handbook. Public sector data suppliers can report work input as hours worked so no impu-tations are needed in the local or central govern-ment sector.
5.1.4 Finalising the processing of the data
At the concluding stage of data processing the numbers of both hours worked and paid hours are imputed for each respondent (see Section 5.1.3). In manufacturing imputation is made separately for hourly-paid and monthly-paid employees.
At the finalising phase of data processing the processor of the data decides for each respond-ent left erroneous on the control list, whether to use for labour input a calculated prediction or empirical data on the number of hours worked. Dubious labour input data printed on the con-trol list can be accepted with a code reserved for that purpose. If an acceptance sign is not defined for the enterprise printed on the control list, a prediction is used. The share of these cases is un-der five per cent.
5.2 Compilation of the labour cost index
The labour cost index is a chain-linked indexwhere industry-specific cost changes are weighted together with the cost weights of the preceding year (or the year before that). In prac-tice, the index is calculated by defining from the sample the average cost of the industry main group calculated per hour worked, by determin-ing its change compared with the base year and by weighting together the industry-specific se-ries with cost weights. The index formula de-fined in the Regulation concerning the compila-tion of the index leaves some scope for nacompila-tional applications.
The index calculation process goes as follows: 1. The average cost of the index base year
(2008) is defined for each basic series determined by the industry’s main group and in manufacturing (C) for each sub-series (see Section 4). The average cost of the basic series (or sub-series) of the base year is the arithmetic mean, i.e. non-weighted, of the average costs for the quarters of the year 2008. 2. For each statistical quarter the arithmetic
average cost of the basic series
(or sub-series) is defined with the current working hour weights.
3. For each statistical quarter the ratio of the average costs of the basic series to the average cost of the base year is defined and
the index figure concerning the quarter in question is determined.
4. The cost change concerning each industry sum (e.g. industries B-S) is calculated in comparison with the index base year by weighting the index relating to each basic series with the value share weight
concerning the cost item derived from the previous year. The value share weights are defined from the basic data of the labour cost index, for which reason the value shares of the starting year of data collection, 2007, have to be used for the calculation of the indices relating to the industry sums for both 2007 and 2008.
5. The change in the index relating to the industry sum is defined from the statistical quarter to the last quarter of the previous year. The index figure relating to the industry sum is derived by chaining - that is, by multiplying the point figure of the last quarter of the previous year by the percentage change occurring until the statistical quarter.
6. The calculation of the annual index relating to industry sums advances in a similar way. The calculation of annual means is based on the arithmetic mean of the series, weighted by working hours.
5.3 Adjustments for seasonal variation and working days
When viewing time series describing economicphenomena, we can often see the index series to follow a certain “formula” from one year to the next, as visible in Figure 5A, for example. That is, when drawing annual index series in the same figure, the variations in the series are parallel in identical periods. This annually/quarterly re-peated variation is called seasonal variation and there appears similarity in sequences of the length of the basic time unit (month or quarter). It is customarily thought that a time series is composed of distinct components that cannot be detected separately. From time series describing the development of an economic phenomenon the following four components are commonly distinguished: trend, cyclical, seasonal and resi-dual components.
In addition to the traditional trend, cyclical, seasonal and residual components, calendar vari-ations can be eliminated in economic time series
by working day adjustment. In the case of the la-bour cost index the reason for quarterly changes can be, apart from cost changes, differences in the number of working days, which is particularly in-fluenced by the timing of holidays and placement of weeks in quarters and the effects of public holi-days on working holi-days.
In accordance with Eurostat’s Regulation, three series must be published on the labour cost index:
– A raw series, where labour costs are depicted as real,
– A series adjusted for working days, where at-tention is paid to the variation of working days, and
– A seasonally adjusted series, which takes ac-count of seasonal adjustment, such as the reg-ular effect of the payment time of one-off pay components.
Finland has delivered working day adjusted and seasonally adjusted series of the Labour Cost Index 2008 = 100 to Eurostat since the autumn of 2012 when the time series became long enough to model the variation in the number of working days and seasonal variation. Prior to this, the index was produced only as a so-called raw series. The index series of the municipal sec-tor are not yet seasonally adjusted due to the fact that the series are short and the poor coverage of the sample during the initial years. In the series that are delivered to Eurostat the effect of the local government sector has been estimated based on the index of wage and salary earnings.
The variation in the number of working days can be divided into two parts – the number of ac-tual weekdays and Sundays. Similarly, public ho-lidays may be fixed hoho-lidays, whose weekday va-ries, such as Christmas, or moving holidays, which change the quarter, such as Easter.
As can be seen in Table 5A, the number of ordinary weekdays alone changes from one quar-ter to the next between 60 and 66. Correspond-ingly, the number of public holidays varies from zero to seven. These have an effect on labour costs because generally public holidays are also days off, as are Saturdays for most people, when the number of hours worked for monthly-paid
I II III IV 80 85 90 95 100 105 110 115 120 125 2012 2011 2010 Figure 5A.
Labour cost index 2008=100 in the private sector by quarter in 2010–2012
Year Quarter Days, No. Working days,
No. [1] Normal weekday Saturdays, No. Normal weekday Sundays, No. Mid-week holidays, No. [2] Saturday holidays, No. Sunday holidays, No. [3] 2010 I 90 62 13 13 2 0 0 II 91 61 11 12 4 2 1 III 92 66 13 13 0 0 0 IV 92 64 11 12 2 2 1 2011 I 90 63 12 13 1 1 0 II 91 61 12 11 4 1 2 III 92 66 13 13 0 0 0 IV 92 63 12 12 2 2 1 2012 I 91 64 13 12 1 0 1 II 91 60 12 12 5 1 1 III 92 65 13 14 0 0 0 IV 92 62 12 13 4 1 0 2013 I 90 62 13 11 2 0 2 II 91 61 12 13 4 1 0 III 92 66 13 13 0 0 0 IV 92 62 12 13 4 1 0
[1] Working days are here understood as normal weekdays included in working days from Monday to Friday.
[2] Monday to Friday coinciding with a public holiday. Mid-week holidays are also considered weekdays that are not generally working days, such as Mid summer Eve. [3] Sundays coinciding with a public holiday, such as Easter Sunday.
Table 5A.
office workers working from Monday to Friday may vary between 435 and 478.5 hours per quarter. Let us assume that the monthly costs of an employee for an enterprise are EUR 4,000, the cost per hour worked then varies from EUR 25.08 to EUR 27.59 if the person has worked 7 hours 15 minutes every day.
Similarly, a large number of public holidays and especially the variation of their number from one quarter to the next and between differ-ent quarters of successive years have an effect on labour costs in branches that work in shifts and where shifts are also worked on public holidays. Then the compensations received from public holidays may raise hourly costs. As an example, let us examine the second quarters of 2012 and 2013. In the second quarter of 2012 there were five mid-week holidays and one public holiday on a Saturday and one on a Sunday, while in the second quarter of 2013 there were four mid-week holidays and one public holiday on a Saturday. The number of public holidays alone reduced from seven to five.
At simplest, calendar variations can be ex-plained by the change in the number of week-days. In the case of the labour cost index differ-ences in the remuneration systems make the sit-uation more complicated, however. For exam-ple, the payment practices of compensations during mid-week holidays are different for hourly-paid employees, depending on the collec-tive agreement. According to some agreements the compensation during mid-week holidays is paid in the month on which the holiday falls, in some agreements a uniform compensation is agreed for all months, whether the month has mid-week holidays or not. Then the models must be constructed industry-specifically, as was done for the imputation models for hours worked. For this reason regression models by which a coefficient can be given to each public holiday are generally used.
For the labour cost index seasonal variation is mostly due to the payment periods of holiday bonuses and other one-off pay and bonuses, such as performance-based bonuses, and the timing of holidays. In the second and third
quar-I/2008 II/2008 III/2008 IV/2008 I/2009 II/2009 III/2009 IV/2009 I/2010 II/2010 III/2010 IV/2010 I/2011 II/2011 III/2011 IV/2011 I/2012 II/2012 III/2012 IV/2012 0 2 4 6 8 10
Seasonally adjusted serie Original serie
5B.
Year-on-year change in labour costs in the private sector from the respective quarter of previous year %, original and seasonally adjusted series in 2008–2012
2012 Working days Days off Days worked Labour cost
euro/quarter euro/working day euro/day worked
1st quarter 64 0 64 12,000 187.50 187.50
2nd quarter 60 5 55 12,000 200.00 218.18
3rd quarter 65 20 45 14,000 215.38 311.11
4th quarter 62 5 57 12,000 193.55 210.53
Table 5B.
ters labour costs are usually higher per hour worked than in the first and fourth quarters, be-cause of the reasons just mentioned above (see Figure 5A).
Let us examine the labour costs of our exam-ple person in 2012, the monthly cost for the em-ployer being EUR 4,000. We assume that the person’s holiday entitlement is six weeks, of which he/she takes one week in April (2nd quar-ter), four weeks in July (3rd quarter) and one week in December (4th quarter). In addition, holiday bonus is paid to him/her in July, the cost from which for the employer is assumed to be EUR 2,000. Table 5B shows that the person’s la-bour costs per day worked vary considerably more than the costs calculated per working day.
Variation in the effective date of contractual pay increases and their payment makes it diffi-cult to adjust for seasonal variation in the time se-ries. Taking this into account requires information about the effect of industry-specific pay increases
on the wages and salaries sum and their possible payment schedule. Collectively bargained pay in-creases are not taken into consideration in the sea-sonal adjustment of the labour cost index.
For removing the effects of seasonal variation use is made of the TRAMO/SEATS method re-commended by Eurostat. The method recom-mended by Eurostat improves the quality of sea-sonally adjusted data and international comparability.
Figure 5B shows the annual change percenta-ges for both the raw series (original series) and the seasonally adjusted series for 2008 to 2012. For example, the annual change of the raw series in the second quarter of 2009 was high partially due to the fact that there were three fewer wor-king days than in the corresponding period in 2008. The annual change of the seasonally adjus-ted index is clearly smaller during the same time period.
6
Old indices and other information service
The labour cost index is produced in compliancewith the EU’s concepts and classifications. The concepts defined in the EU Regulation have been used since 1996. However, the revisions of the statistics production method and of the Standard Industrial Classification from 2007 make it more difficult to compare these statistics with earlier ones.
Eurostat publishes the labour cost index quarterly on its Internet pages. Unlike the
na-tional labour cost index, Eurostat publishes data by industry without sector division. Differences between countries in the statistics compilation method may influence the comparability of the indices on different countries.
The labour cost index is published on Statis-tics Finland’s free Internet pages. More detailed results on changes in labour costs are released yearly in the summary publication Wages, sala-ries and labour costs.
7
Uses and application of the labour cost index
7.1 What is the labour cost index used for
The labour cost index measures the change inla-bour costs calculated per hour worked within a certain industry. The change in average labour costs is affected by such as:
– Contractual pay increase of earnings and the wage drift,
– Structural change in labour force,
– Changes in use of labour force (e.g. overtime work, holidays, temporary lay-offs, mid-week holidays),
– One-off pay components, e.g. perfor-mance-based bonuses,
– Change in social insurance tariffs.
Cost-type specific sub-indices published from the index enhance the possibilities to ana-lyse the reasons for the cost change. Changes in cost factors are also examined in the annual pub-lication of the statistics on wages and salaries and labour costs released every year.
On the level of the national economy the la-bour cost index can be used when comparing the
cost development calculated per hour worked with changes in productivity. As it covers the whole European Union, the index allows compari-sons of Finland’s cost development with its rival countries. Seasonal adjustment of the index im-proves international comparability of cost changes. On the level of enterprises the labour cost in-dex makes it possible to compare one’s cost de-velopment with enterprises in the same industry both in Finland and in the EU area.
The official index of wage and salary earnings is often better suited for price updates of deliv-ery contracts than the current labour cost index. The seasonally adjusted and working-day ad-justed index improves the suitability of the la-bour cost index for delivery contracts. Due to the shortness of the time series and seasonal ad-justment methods, seasonally adjusted time se-ries may become revised quite much due to new observations. This should be considered when using the data.
7.2 Connections to other statistics describing labour costs
The index of wage and salary earnings publishedby Statistics Finland measures the change in earnings received from regular working hours. It is based on the statistics on wages and salaries concerning mainly the last quarter of the year. The change in the index of wage and salary earn-ings and the labour cost index may differ, for ex-ample, because of the more exhaustive cost con-cept of the labour cost index, changes in use of working hours, different calculation methods of indices and varying recording practices for ex-traordinary or one