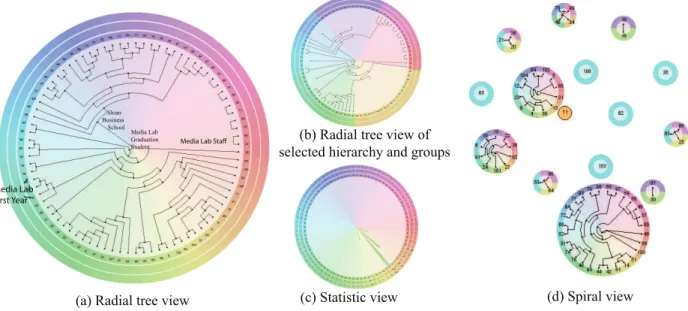
Visual Analysis of People’s Calling Network from CDR data
Category: ResearchSloan Business School
Media Lab Staff
Media Lab First Year
Media Lab Graduation Student
(a) Radial tree view
(b) Radial tree view of selected hierarchy and groups
(d) Spiral view (c) Statistic view
Figure 1: Four visualizations for analyzing the MIT Reality Mining dataset. (a) depicts the entire calling network, in which each subject is represented as a leaf node with a unique identification. (b) displays the result of interactive hierarchy and group selection based on (a). (c) shows the calling pattern (in and out calling) of ID 8 with respect to (b). (d) shows the social connections of ID 11 (shown in yellow) with a spiral view.
A
Call detail records (CDR) is a widely used data in Social Network Analysis (SNA). This paper introduces a novel visual analysis tech-nique for characterizing one person’s calling network and revealing one person’s underlying statistical calling information and social communities. We represent the entire calling network with a hi-erarchical radial kd-tree view, and allow the user to interactively analyze the social groups by selecting the hierarchy and groups of the radial tree. To inspect the calling pattern of one subject, a statis-tic view is provided with a radar chart representation. In addition, a spiral layout is employed to reveal the closeness relationship be-tween one subject and groups which have direct or indirect call-ing connections with him or her. The statistic view can be used to compare the calling patterns of different persons, or different time durations of one subject. We demonstrate the effectiveness of our approach with the CDR data of the IEEE VAST 2008 mini chal-lenge, and the MIT Reality Mining dataset.
1 I
Within the last two decades, large amounts of call detail records (CDR) datasets are becoming available. A CDR dataset includes the time, duration, caller and callee, and the locations of the cellu-lar towers. For instance, the CDR dataset from IEEE VAST Chal-lenge 2008 contains about 10000 call records from 400 persons for 10 days (from June 1st to June 10th, 2006). It implies a commu-nication network, and provides meaningful information about the characteristics of human behaviors. Many efforts have been put on studying the structure of mobile phone networks [3, 5], revealing personal life pace and reactions to outlier events [3], and classify-ing different social networks [5] (e.g., friendship, organizations). Further studies have also been conducted on the dynamics of the mobile phone networks [11], favoring the analysis of evolution of
relationships over time.
Current research on mobile phone networks has greatly enabled the understanding of the mobility pattern and human behavior. Yet, easy access to the characteristics of some subject (caller or callee) is still a challenging problem. Conventional statistical and visualiza-tion techniques can definitely help address this problem, but tend to be inefficient due to the following reasons. First, the mobile phone network is of significantly large data size. For example, the MIT Reality Mining project [4] collects data from 100 mobile phones for 9 months, and captures more than 3 million cell phone activities. Second, the mobile phone network contains complex information. Eagle et al. [3] has successfully identified different types of students based on the expansion rates of their mobile phone network. This complex property has made it quite difficult to achieve a compre-hensive visualization at limited screen resolutions. Third, the time-varying property of the mobile phone network and the evolution of someone’s communication network is difficult to be captured.
The primary goal of this work is to analyze the characteristics of one subject’s communication network, and enable comparison of subjects from different communities. The main idea takes a cluster-and-analyze procedure: prior to detailed analysis with respect to one subject, the entire network is clustered by means of an im-proved version of the Girvan-Newman algorithm [9]. Specifically, the first stage clusters the dataset into a hierarchical kd-tree, which supports interactive adjustment of level of details. By converting the tree into a hierarchical radial layout, and further flattening it into a circle, the network is mapped into a uniformly divided ring. In the analysis stage, the influence from each group (a patch of the ring) to the subject at some time is represented as an influence spot between the ring center and the cluster center on the ring. Sequen-tially connecting all influence spots of all clusters yields a polar chart with respect to the subject. The chart is dynamically changed
network of the subject. Thus, it allows for analyzing not only the evolution of one person’s calling network, but also the patterns of connections along the time line, such as the differences between days and nights.
We also introduce a novel spiral view to characterize the close-ness relationship between one subject and groups which have di-rect or indidi-rect calling connections with him or her. With the spiral view, comparing large-sized calling networks is made easy. One main advantage of the spiral view is that each unit of the spiral lay-out is a sub-group of the entire calling network, whose network and calling pattern can be structured well and analyzed simultaneously. We evaluate the effectiveness of our approach with the CDR data of the IEEE VAST 2008 mini challenge, and the MIT Reality Mining dataset.
The rest of this paper is organized as follows. Section 2 reviews the related work. Our approach is explained in Section 3. Experi-mental results and analysis are given in Section 4. Section 5 con-cludes this paper and highlights the future work.
(a) (b)
(c) (d)
Figure 2: Existing social network visualization techniques. (a-c) Three node-link representations from existing literature: (a) [10], (b) [20], (c) [18]. (d) The treemap representation [6].
2 RW
A social network, such as the mobile phone network, is a widely used term to describe the social activities. Designed for effective analysis and visualization, the node-link representation has a long history dated back to 1930s [7]. The node-link layout, in which the nodes represent the members of the network and the edges rep-resent the relationship, has the advantage of intuitiveness and in-telligibility. Typically, hierarchical structure is employed to pro-vide a level-of-details view of the underlying network [12]. Recent work [10, 14, 18, 19, 20] greatly improves the efficiency and re-fines the layout. One kernel step of these approaches is to employ a well-defined clustering algorithm to group members into identi-fiable communities. Most of them pay equal attention to all con-nections, and thus can hardly emphasize on special characteristics. For large-sized datasets with increased connectivity, over-cluttered
Figure 2 (a-c).
The adjacency matrix-based views [8] are capable of showing large-sized social network. However, an adjacency matrix provides very limited degree of freedom to interact with the underlying data, making it difficult to perform clustering operations. Alternatively, the treemap representation [6] (see Figure 2(d)) employs embedded rectangular shapes to represent hierarchical and categorical infor-mation. It is believed that the treemap layout is significantly suited for representing large datasets with full utilization of screen space. However, using the embedded rectangular representation can hardly encode the hierarchical relationship between different groups.
Another common representation for social networks is the radar chart or the spiderweb chart [2]. It is capable of highlighting the most dominant elements and quantifying the proximity between two members. We propose a refined radial layout that is suitable for analyzing the mobile phone network. With our approach, a radar chart can be constructed with respect to the person of interest, and the influences from his/her communication network can be eff ec-tively quantified by a dynamically changed polar chart.
A challenging task for visualizing a social network is to depict its time-varying properties, and conduct useful insights. The time line is a natural way to represent time-varying data [13] by building a one-to-one correspondence between the representation element and the data primitive. Recently, Bak et al. [1] present a framework, called Growth Ring Maps, to analyze the spatiotemporal data of sensor logs. This representation makes it possible for users to find similarities and extract patterns of interest in spatiotemporal data. Moody et al. [15] introduce the animated “movie” representation for the changing social network. Our approach leverages the inter-actions to show the evolution of a communicated network and the influence of each connection on one person.
3 A
We seek to design an effective visualization that allows for inter-active analysis of the behavior of a communication network. Our approach emphasizes on the connections between one subject and its direct or indirect social groups based on the assumption that an individual’s life style is a combination of relationships with related social groups. The social groups are detected using an improved version of the Girvan-Newman network clustering algorithm [9], and are formed into a hierarchical radial kd-tree. Subsequently, the tree is recursively mapped into a uniformly subdivided ring.
For a selected person, a radar chart is generated to characterize the influence from related groups by embedding the influence of every group on its polar coordinates. The definition of influence is various under different situations. The pipeline of our approach is shown in Figure 3.
3.1 Hierarchical Clustering
Existing approaches [10, 12, 14, 18] are mostly based on the node-link layout, suffering from a problem of possible cluttered visual-ization for large-sized data.
A social network is a typical case of the network with ”com-munity structure”, in which the nodes within the same group have dense node-node connections, and the edges between communi-ties are less dense. Based on this feature, the Girvan-Newman al-gorithm detects communities in complex systems. It defines the ”edge betweenness” for each edge as the number of the shortest paths between pairs of nodes. Then, it searches the edge with the biggest betweenness value and removes it. Recursively applying this operation yields a binary tree whose leaves are nodes of the network. All clustering results during the process are stored as a list for further reference. We transform the original CDR network into a weighted simple graph, which can be computed as a multiple graph by Girvan-Newman algorithm [16]. However, this algorithm
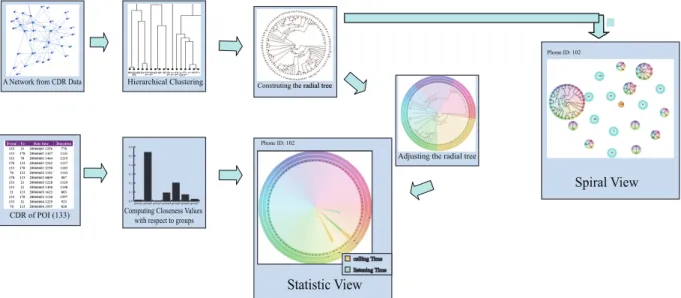
A Network from CDR Data
CDR of POI (133)
FromTo Date time Duration
133 21 20060601 1256 778 133 178 20060601 1437 1141 133 70 20060601 1444 1215 178 133 20060601 2102 1137 133 178 20060601 2150 1183 70 133 20060602 1101 1143 178 133 20060603 0009 887 133 21 20060603 1228 1129 133 21 20060603 1400 1190 21 133 20060603 1623 803 133 178 20060603 2120 1597 133 21 20060604 1229 923 70 133 20060604 1557 828 Hierarchical Clustering
Computing Closeness Values with respect to groups 0.0 0.1 0.2 0.3 0.4 0.5 0.6 group7 group6 group5 group4 group3 group2 group1
Construting the radial tree
Spiral View Phone ID: 102
Adjusting the radial tree
Statistic View
calling Time listening Time
Phone ID: 102
Figure 3: The pipeline of our approach.
is time-consuming with a time complexity ofO(kmn), wherekis the number of removed edges,mis the number of the edges in the network, andnis the number of nodes. In order to reduce the com-putation time, we compute the edge betweenness in three stages. First, the multiple graph is transformed into a simple graph by dis-carding the extra edges if there are multiple edges in the node pairs. Thus we get the edge betweenness by means of the breadth first search. Second, the edge betweenness for every edge in the multi-ple graph is increased by the edge number per node pair in the path. Third, we remove all edges whose edge betweenesses are maximum instead of removing only one edge in the traditional way. The mod-ified algorithm has a time complexity ofO(k′m′n), wherem′is the edge number in the simple graph, andk′is the iteration times.
3.2 Generating the radial layout
After clustering, each detected group is treated independently as an axis to measure the influence to one subject. The influence can be a variable with statistical or evolutionary properties, and change over time.
We choose the radial layout because it saves space, and is very suitable for showing the large nodes compared with the one-way layout, such as the traditional tree layout. Layouts like 2D force-directed layouts make the space as compact as possible. However, it makes the user confused if there are too many nodes. To allow for effective analysis and visualization of the large-sized tree (net-work), we construct a radial layout for the tree in three steps. First, all leaf nodes of the tree are sequentially and uniformly distributed on a ring. Each child node corresponds to an interval of the ring. By recursively merging the child nodes, the tree is reformulated into a radial tree view. With this procedure, the ring is subdivided into a hierarchical structure. The length of each ring patch encodes the size of clustered groups The root node is the center of the ring.
When a user expects to see what his social groups are like, he or she needs to traverse from the root node of the radial tree. The closer a group is to the root node, the more obvious difference these groups have.
3.3 Generating the spiral view
Given that a user cares about who are the closest friends, and who are the second closest friends, the radial layout in 3.2 only shows the overview for all subjects. However, this overview is not intuitive, and the user needs extra time to explore. We introduce a spiral view,
in which a subject is placed in the center, and directly or indirectly connected groups are lined into a spiral line according to their social relationship with the subject.
In the hierarchical tree produced by the Girvan-Newman algo-rithm, the closer two persons are, the nearer their hierarchical po-sitions are. Thus, the spiral line could be formed directly from the radial tree. The leaf nodes in the brother branch of the center per-son are the closest, and these brother branches are cut into form a community, and placed in the first place of the spiral line. The next community in the second place of the spiral line is the brother branches of the center person’s father node, and so on.
3.4 Statistic view
Better understanding of the social behaviors for a particular group is one of the major goals of the mobile phone network analysis. By analyzing trends in the duration and frequency of calls, it is likely to get information about the characteristics of human behavior pat-terns [3, 5]. For example, the approach proposed in [3] can be used to compare the communication behaviors between residents and ur-ban communities.
Figure 4: Statistical representation view comparison using the same data and same closeness value model: (a) Polyline view; (b) Fan view. The closeness value with blue group and orange are not displayed in the left picture, while obviously in the right.
Our approach favors effective analysis and visualization of the duration of calls for each group by using the radar charts. Because From 3.2, we can conclude that one person’s close contractors are
formation easy to tell in a radar chart without a vision loss, because all the information close to each other.
Along each axis, we place a point according to the duration. For visualization, one solution to construct a polyline by connecting all the points in clockwise ordered directions. However, this represen-tation would cause confusing results as part of the groups might have no connection. For instance, in Figure 4 (a), the group in blue has a long period of connection and its two neighboring groups have no connection with the subject. Connecting the points on the axes of the three groups makes the duration of the blue group invisible.
We choose to represent the influence from calling network with the radar chart representation. Instead of using the connected lines, we use a fan view to represent the duration (Figure 4 (b)). The set of groups yields several separate fans around the center. When we choose the fan with the radial tree view, the corresponding branch of the hierarchical tree expands to new sub-fans.
Calling network usually takes a two-way connection form, i.e., in and out calls. To distinguish them, we decompose each fan into two parts, of which each part represents one way calling in different colors.
3.5 Interactive community classification
With the proposed approach, we can easily classify the network data into different communities, identify persons with similar life styles, and compare the associated communication networks of dif-ferent persons. Generally speaking, people could have a fuzzy clas-sification about his social groups. And this prior social experience could be applied into the CDR datasets. Imaging a scene that a com-pany manager want to know about his communication time with all his clients and his relatives, instead of every client and every rela-tive. On the hierarchical tree view, groups can be divided or merged by adjusting the tree. Interactive manipulation of a radial tree view enables the user to access certain desired group and adjust shown levels of the binary tree. The user can expand or collapse the cur-rent tree nodes by simple interaction. Different colors are used to depict different subjects and groups.
4 R A
All results were generated on a PC with an Intel 4 Core 2.66 GHZ, 4G RAM, and the operate system is the 32-bit Microsoft windows7. The interface and visual analysis system was implemented with the Processing language [17]. To demonstrate the utility of our system, we conducted case studies on two CDR datasets. One is from MIT Media Lab, by conducting an Reality Mining experiment on one hundred subjects. In these subjects, seventy-five are either students or faculty in MIT Media Laboratory, and twenty-five are incoming students at MIT Sloan business school. The other is the bench-mark for the IEEE VAST 2008 challenge, generated by recording the phones calls from Isla Del Sue¨n over a ten-day period in June 2006. Each record in these two CDR dataset contains at least four fields of the calls: the two phone numbers (in and out), the time, and the duration.
4.1 MIT Reality Mining Dataset
The MIT Reality Mining dataset records the call logs, Bluetooth devices in proximity of approximately five meters, cell tower IDs, application usage, and phone status of 94 subjects from 23rd, March 2004 to 14th, June 2005. After the cleaning process, we obtain a dataset that contains social activities of 83 subjects and 3853 call records from August 2004 to March 2005.
To reduce the computation time of the Girvan-Newman algo-rithm, we adopt the call minutes between pairs of people as the weight added to the CDR call network, including in call time and out call time. This is reasonable because the call minutes reflects the degree of call communication. After performing this algorithm,
the user can choose a group of interest by traversing the tree. In this traversing process, the social community distribution can be quickly observed from the root node, where the deeper the degree of the group node is, the more concrete the social relationship is. From the biggest tree in Figure 1(a), we can find that it has two branches from the root. That means that these people can be divided into two groups: one is all the people from the Sloan Business School in MIT, and the other is mostly the Media Lab graduated students, among which, ID 78 and ID 40 are the two of the four Media Lab First Year Graduate students. This finding is confirmed in the user identification survey. In this tree, the biggest group is represented as the ring in in the right up corner.
Considering a user may know well about how many groups his or her social network could be divided into, the interactive hierar-chical layout can be quickly obtained. The user then can choose the initial clusters from the hierarchal layout which are shown as the rings. Figure 5(a) is created by a user who want to look at the group community at the level of Sloan Business School and Media Lab. If the user wants to look at the level of concrete Media Lab group hierarchy, he/she can first select its corresponding clusters and then unfold its hierarchy tree shown as Figure 5(b).
When there are too many people in a person’s social network, the directed social network observation will put too much heavy over-load in human’s observation. Fortunately, the proposed spiral view can help the user to easily compare their social relationship with multiple friends. Figure 6(a) shows the social groups with ID 11. People who have relationship could be grouped into 14 communi-ties according to their close relationship with ID 11. The most clos-est community includes ten people (ID 4,5,8,12,13,31,23,60,102, and 104) where the social relationship among themselves can be observed by the radial tree layout. In the similar manner, we can find the second closest community which only has ID 106.
Base on interactively determining the level of the social commu-nities, a radial statistical chart can be created to reveal the underly-ing patterns. After selectunderly-ing the node with ID 8, Figure 7(a) shows the ratio of in call time (colored in orange) and out call time (col-ored in green) with every person in his social network from March, 2004 to June, 2005, while his/her ratio of total call time in the same time duration is shown in Figure 7(b). Form this result, we can see that ID 8 and his/her call friends both like to call each other. More-over, the persons near ID 8 have more call time, which means that their social relationship is much closer.
4.2 IEEE VAST Challenge Dataset
Compared with the MIT Reality Mining dataset, the CDR dataset from IEEE VAST Challenge is involved with up to 400 persons. Here, we focus on how to reveal the statistic information. The radial tree view in Figure 8 clearly reveals the ID 2’s social communities in the compact social network. From this result, we can find two groups of people connected with ID 2. One has far more calls in daytime than at nights while the other is vice versa. We guess the former group is his/her work community, and the other is his/her private friends.
Comparison of different people’s social network is a very impor-tant task for analyzing the social behaviors, but it is very difficult to achieve due to its high-dimensional nature. In contrast, our spiral layout intuitively reveals each people’s network. With a side-by-side comparison of spiral views, the differences between different people’s network can be quickly identified. Figure 9 shows the so-cial network of of these two persons (ID 2 and ID 5) which have similar similar connected ID in day and night. By comparing other persons network which are belong to the same level, we can find the people with the similar level probably belongs to the same group. In this manner, we find the mit Reality Mining Dataset also has this pattern.
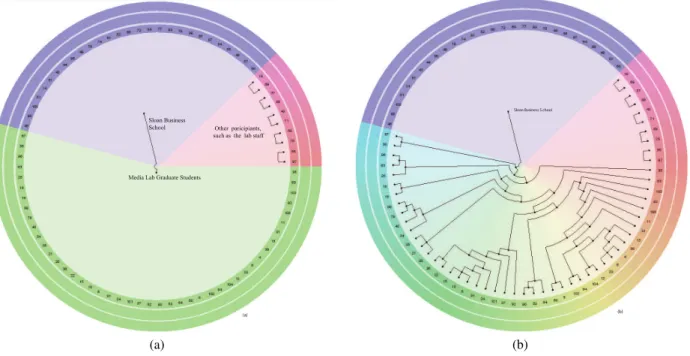
Sloan Business School
Media Lab Graduate Students
Other paricipiants, such as the lab staff
(a)
Sloan Business S chool
(b)
(a) (b)
Figure 5: The interactive tree layout of the MIT Reality Mining dataset. (a) The mainly three groups; (b) The concrete Media lab’s people social relationships.
5 C
In this paper we have presented a visual analytics system for CDR data. It focuses on the calling network of one subject, which can be regarded as an analysis technique for the relationship of an in-dividual and the social groups. We suggest that the variation of an individual’s social position is a combination of changing closeness value between him/her and each social group related to him. We treat these groups as coordinates in a radar chart, and improve it by mapping the size of each group to the length of arc. By using different views, hierarchies, the user can interactively investigate the calling network in a directed or un-directed fashion. Two case studies were carried out on two datasets, demonstrating that our approach is very promising for social network analysis concerning one subject.
In the future we expect to explore personal-related sub-graph de-tection and visualization method. Instead of using the entire net-work, analysis will focus on one subject’s related groups in most application situations. We plan to use clustering algorithms to han-dle overlapped groups to get a better social group model. We will also test our approach on other kinds of small-world networks.
R
[1] P. Bak, F. Mansmann, H. Janetzko, and D. Keim. Spatiotemporal anal-ysis of sensor logs using growth ring maps. IEEE Transactions on Visualization and Computer Graphics, 15(6):913–920, 2009. [2] J. M. Chambers, W. S. Cleveland, and P. A. Tukey.Graphical methods
for data analysis. Duxbury Press, 1983.
[3] N. Eagle. Behavioral inference across cultures: Using telephones as a cultural lens.IEEE Intelligent Systems, 23(4):62–64, 2008. [4] N. Eagle and A. S. Pentland. Reality mining: sensing complex social
systems.Personal and Ubiquitous Computing, 10(4):255–268, 2006. [5] N. Eagle, A. S. Pentland, and D. Lazer. Inferring friendship network structure by using mobile phone data. Proceedings of the National Academy of Sciences, 106(36):15274–15278, 2009.
[6] T. L. Frantz and K. M. Carley. Treemaps as a tool for social network analysis, September 2005.
[7] L. C. Freeman. Visualizing social networks.Journal of Social Struc-ture, 1, 2000.
[8] M. Ghoniem, J.-D. Fekete, and P. Castagliota. A comparison of the readability of graphs using node-link and matrix-based representa-tions. InINFOVIS ’04: Proceedings of the IEEE Symposium on Infor-mation Visualization, pages 17–24, 2004.
[9] M. Girvan and M. E. J. Newman. Community structure in social and biological networks.Proceedings of the National Academy of Sciences of the United States of America, 99(12):7821–7826, 2002.
[10] J. Heer and D. Boyd. Vizster: Visualizing online social networks. InINFOVIS ’05: Proceedings of the Proceedings of the 2005 IEEE Symposium on Information Visualization, page 5, 2005.
[11] C. A. Hidalgo and C. Rodriguez-Sickert. The dynamics of a mobile phone network.Physica A, 387(12):3017–3024, 2008.
[12] D. Holten. Hierarchical edge bundles: Visualization of adjacency re-lations in hierarchical data. IEEE Transactions on Visualization and Computer Graphics, 12(5):741–748, 2006.
[13] G. M. Karam. Visualization using timelines. InISSTA ’94: Proceed-ings of the 1994 ACM SIGSOFT international symposium on Software testing and analysis, pages 125–137. ACM, 1994.
[14] P. Mika. Flink: Semantic web technology for the extraction and anal-ysis of social networks. Journal of Web Semantics, 3:211–223, May 2005.
[15] J. Moody, D. McFarland, and S. Bender-deMoll. Dynamic network vi-sualization.American Journal of Sociology, 110(4):1206–1241, 2005. [16] M. Newman. Analysis of weighted networks. Phys. Rev. E,
70(7):056131, 2004.
[17] C. Reas, B. Fry, and J. Maeda.Processing: A Programming Handbook for Visual Designers and Artists. The MIT Press, 2007.
[18] Z. Shen, K. liu Ma, and T. Eliassi-Rad. Visual analysis of large hetero-geneous social networks by semantic and structural abstraction.IEEE Transactions on Visualization and Computer Graphics, 12(6):1427– 1439, 2006.
[19] Z. Shen and K.-L. Ma. Mobivis: A visualization system for exploring mobile data. InProceedings of IEEE Pacific Visualization Symposium, pages 175–182. IEEE VGTC, 2008.
[20] Q. Ye, T. Zhu, D. Hu, B. Wu, N. Du, and B. Wang. Cell phone mini challenge award: Social network accuracy–exploring temporal com-munication in mobile call graphs. IEEE International Symposium on Visual Analytics Science and Technology, pages 207–208, 2008.
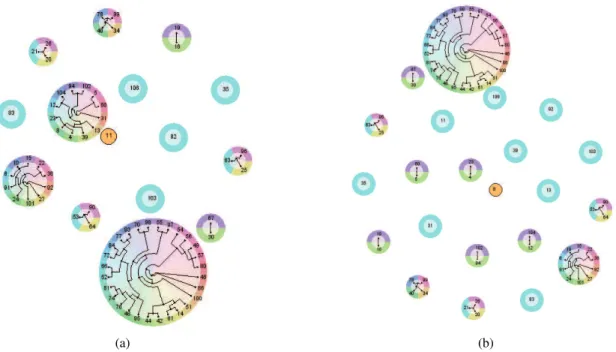
(a) (b)
Figure 6: The spiral view of the MIT Reality Mining dataset. (a) The constructed tree; (b) The spiral social relationship of the person whose id is 8.
(a) (b)
Figure 7: The radar tree chart of the ID 8 from the MIT Reality Mining dataset. (a) The ratio of in call time (colored in orange) and out call time (colored in green) with every person in his social network. (b) The ratio of total call time in the same time duration. The number in the exterior circles represents the concrete call time.
5 and 200
3 2
1
(a) (b)
Figure 8: The radial tree view from the VAST Challenge dataset.(a) The overview of the whole dataset. (b) The radar tree chart of the ID 2, where the orange color representing his (or her)ratio of call times with every person from 8:00am to 18:29pm, and the blue color representing his (or her)ratio of call times with every person from 18:30pm to 7:29am.
(a) (b)
![Figure 2: Existing social network visualization techniques. (a-c) Three node-link representations from existing literature: (a) [10], (b) [20], (c) [18]](https://thumb-us.123doks.com/thumbv2/123dok_us/454536.2552831/2.918.87.437.383.758/figure-existing-network-visualization-techniques-representations-existing-literature.webp)