Analysis of Risks and Impacts of Flooding with Satellite Remote
Sensing
Ejikeme, J.O1* Igbokwe, J.I1 Ezeomedo, I.C2 Aweh, D.S3 Akinroye, R4
1.Department of Surveying and Geoinformatics, Nnamdi Azikiwe University, P.M.B 5025, Awka, Anambra State, Nigeria
2.Department of Environmental Management, Anambra State University, Uli, Anambra State, Nigeria 3.Department of Surveying and Geoinformatics, Auchi Polytechnic, Auchi, Edo State, Nigeria 4.Department of Topographic Surveying, Kaduna Polytechnic, Kaduna, Kaduna State, Nigeria
Email:[email protected] Abstract
In recent times there have been extreme climatic conditions due to climate change. As a result of this, the intensity of rainfall has increased tremendously causing flooding in many areas and countries worldwide. It is therefore prudent that such a natural hazard is addressed in a way to reduce the impact it causes on people and the environment. Adequate geographic information on hazards and areas vulnerable to hazards is required to be able to prepare for disasters. Flood vulnerability mapping is fundamental in flood risk management because it identifies areas vulnerable to flood disaster. In this study, efforts were made to provide information that can assist government agencies in determining types of land use and land cover types that may be affected at different levels of flood risk inundation in event of flood disaster. Landsat-7ETM+ of 2012 was classified. Shuttle Radar Topography Mission (SRTM) image of 2000 was resampled to 28.5m resolution of Landsat image and used to generate the Digital Elevation Model (DEM) and slope gradient of the study area. The DEM and slope gradient map were reclassified and combined through series of analysis to generate different levels of flood risk. The different land cover classes were overlaid with the flood risk map in order to know the land cover type that will be mostly affected in the event of flood disaster. It is recommended among others that communities that fall within the very high risk flood inundation should be identified and possibly relocated to higher ground elevation.
Keywords: Flood, Satellite image, Risk, GIS and DEM 1. Introduction
Flooding is one of the serious natural hazards in the world (Seyedeh et al, 2008). Flooding results when there is runoff of river and stream inflow makes a stream channel full to capacity, filling the storm channel and spilling over. Also when there is low infiltration capacity and poor drainage, rise in hydrological water table above the surface results to flooding, sometimes this happens due to collapse of dams and when there is heavy rainfall (Nwilo, 2013).
Flooding could also result due to the combine effects of climate (precipitation) topography soil and texture (i.e. sub division of soil series) based mainly upon the texture of the upper layer and the relative amount of sand, silt and clay that are present in the soil and human activities. The immediate effects of flood are displacement of people and damage of properties apart from the threat to disease, also farm land and agricultural products will be destroyed which often leads or result to poverty, hunger and starvation in addition to the cost of reconstruction and reclaiming the affected areas.
Nigeria has been slow to realize the potential possessed by remote sensing and GIS in flood disaster management. This is confirmed by the response to the recent flood disasters that have affected more than 23states of the country, claimed many lives and properties, and threatened the ecological biodiversity. Mitigation of flood disaster can be successful only when detailed knowledge is obtained about the expected frequency, character and magnitude of hazardous events in an area as well as the vulnerabilities of the people, buildings, infrastructure and economical activities in a potentially dangerous area. Unfortunately this detailed knowledge is always lacking in most urban centers of the developing world like Nigeria (Ishaya et al, 2009).
1.1 The Study Area
The area selected for this study is located within the Anambra river basin, South-eastern Nigeria. The geographic location is approximately between latitudes 6o21’N and 6o52’N and longitudes 6o45’E and 6o52’E (see fig. 1). It lies within the tropical region. Early rainfall occurs usually in January/February with full commencement of rainy season in March and stopping in November of each year. The dry season commences from November and ends in February. The mean highest annual rainfall usually recorded around July to October is about 1952mm (Igbokwe, 2010). The temperature pattern has mean daily and annual temperatures as 28oC and 27oC
Anambra river catchment terrain falls within zone 7, eastern littoral. The implication is that water flows down the deep slopes terminating steeply into the drainage basin. Fabiyi et al, (2012) in a study conducted for the entire states of Nigeria, reported that Anambra state have only 5.5% of its land area above a flood threshold of 10%. The implication is that Anambra state has a large portion of its communities and local government areas below the flood threshold hence need to keep on a flood watch and monitoring.
Figure 1A: Map of AfricaShowing Nigeria; Figure 1B: Map of Anambra State Showing the Local Govt Areas; Figure 1C: Map of the Study Area
A
B
2. Methodology
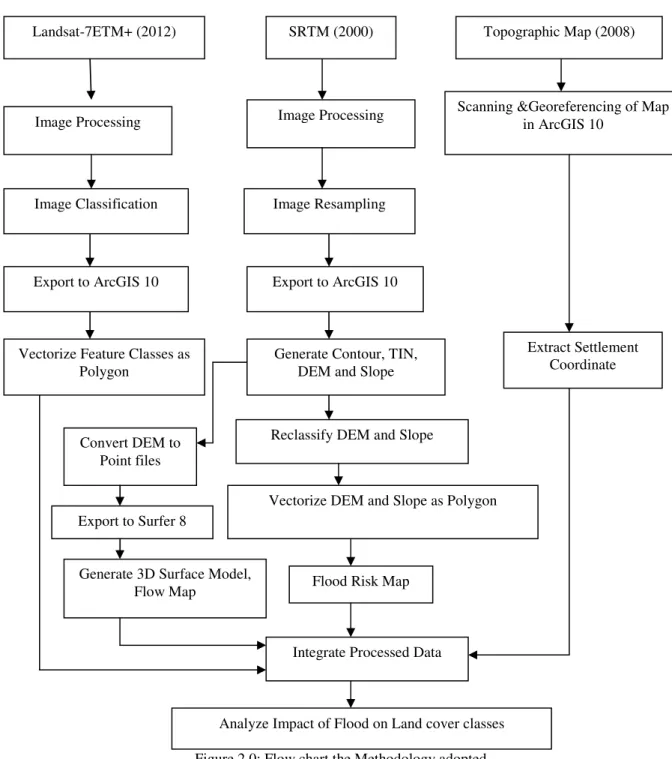
The flow chart of the methodology adopted is represented in the figure 2.0
Figure 2.0: Flow chart the Methodology adopted.
After a pre- classification visits to the site, the following classes were adopted; Water body, Farmland, Built-up Area, Vegetation, and Open space. The Landsat-7ETM+ image was classified using the maximum likelihood method.In order to ensure correct classification of the image, the geographic coordinates of each of the land cover representative class obtained during ground truthing were plotted into the image in ArcGIS 10 environment and identified before training. The classified image was exported to ArcGIS 10 software. The accuracy of the classified image was checked by plotting the coordinates of the remaining ground truth data not used in the classification process into the classified image. The result shows a high correlation and the classes vectorized into polygons.
The resampled and georeferenced Landsat-7 ETM+ of pixel size of 28.5m was used as a reference image to co-register the target image (SRTM) to the WGS 84 Datum, UTM Projection system of the Landsat-7 ETM+ dataset. The image was resampled and submappped to a smaller area using the bounding coordinates of
Landsat-7ETM+ (2012) SRTM (2000) Topographic Map (2008)
Image Processing Image Processing
Image Classification Image Resampling
Export to ArcGIS 10 Export to ArcGIS 10
Vectorize Feature Classes as Polygon
Generate Contour, TIN, DEM and Slope
Reclassify DEM and Slope
Vectorize DEM and Slope as Polygon
Flood Risk Map
Integrate Processed Data Convert DEM to
Point files
Export to Surfer 8
Generate 3D Surface Model, Flow Map
Scanning &Georeferencing of Map in ArcGIS 10
Extract Settlement Coordinate
The resampled SRTM image was exported to ArcGIS 10 environment and used to generate Digital Elevation Model (DEM) of the study area. The derived DEM was reclassified into the following categories:
i. 0-15m (Very High Risk) ii. 15-34m (High Risk) iii. 34-92m (Moderate Risk) iv. 92-189m (Low Risk) v. 189-250m (No Risk)
These categories of risk were created based on ground information obtained within the catchment during the ground truthing and the spot height of the topographic map.
The DEM was used to create the slope gradient of the study area. The slope gradient obtained from the DEM was reclassified using the following five classes based on Food and Agricultural Organization (FAO) classification of slopes:
(a) 0 -2% = Flat (Very High Risk) (b) 2-8% = Undulating (High Risk) (c) 8 -16% = Rolling (Moderate Risk) (d) 16 -30% = Hilly (Low Risk) (e) 30 -200% = Mountainous (No Risk)
These categories of risk were used to produce the slope map of the area. In order to delineate the different risk level of flooding in the study area, four maps were generated by overlaying different categories of risk level of slope map and the DEM and the common areas digitized as polygon. The maps were generated through the following combinations:
(a) Slope map (VHR) and DEM (VHR) = Very High Risk 1 (b) Slope map (HR) and DEM (VHR) = Very High Risk 2 (c) Slope map (VHR) and DEM (HR) = High Risk 1 (d) Slope map (HR) and DEM (HR) = High Risk 2
The resultant maps produced from (a) and (b) that is ‘Very High Risk 1’ and ‘Very High Risk 2’ were overlaid to produce the map showing areas with Very High Risk of inundation. Similarly (c) and (d) were also overlaid to produce map of areas with High Risk of inundation. The moderate, low, and no risk inundation area map were generated by overlaying moderate risk slope map and moderate risk DEM; Low risk slope map and low risk DEM; and No risk slope map and no risk DEM respectively.
Finally, the Very High Risk of inundation, High Risk of inundation, Moderate risk of inundation, Low Risk of inundation and No risk of inundation were overlaid together with the coordinate of the settlements extracted from the topographic map to produce the flood risk map of the study area. The analysis of the impact of flood on the classes was done by overlaying the risk map and the vectorized land cover classes.
3. Results and Discussions
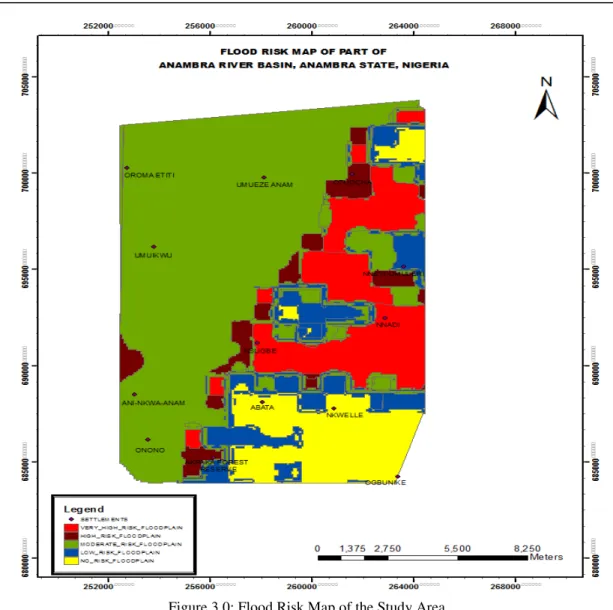
Figure 3.0: Flood Risk Map of the Study Area
Table 1.0 shows the different areas of flood risk and the percentage of the total areas occupied. The table revealed that very high risk areas occupy about 14.9% of the area studied or 3577.75hectares, while high risk areas occupy 5.1 % of the study area. Moderate risk areas cover 57.6% or 13871.03hectares. Low and No risk areas occupy about 9.9% and 12.5% respectively.
Table 1.0: Percentage coverage of flood risk areas
S/No Risk Area (Km2) % of the Area Settlements
1 Very High Risk 35777565.218 14.9 Nsugbe, NneyiUmuleri
2 High Risk 12290855.664 5.1 Otuocha, Akpaka Forest Reserve 3 Moderate Risk 138710346.195 57.6
4 Low Risk 23767546.828 9.9 UmuezeAnam, OromaEtiti, Umuikwu,
Ani-IkonaAnam, Onono
5 No Risk 30076336.592 12.5 NkwelleEzunaka, Ogbunike
Total 240622650.400 100
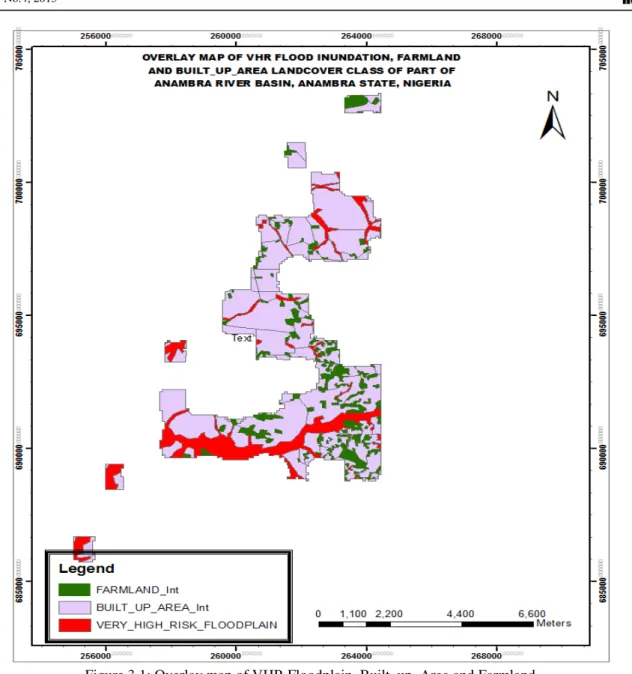
The different categories of flood risk inundation level were integrated with the feature classes in order to analyze the impact of the frisk level on the feature classes. For example, the ‘Very High Risk Floodplain’ was integrated with Built_Up_Area and Farmland classes through the intersection capability of overlay function in ArcGIS 10 environment. The result obtained is shown in figure 3.1. Also, the ‘High Risk Floodplain’ was integrated with Built_Up_Area and Farmland class as shown in figure 3.2. Similar analysis can be carried out at different risk level and feature class.
Figure 3.1: Overlay map of VHR Floodplain, Built_up_Area and Farmland
The result shows that out of the 3569.7hectares of land that are prone to very high risk flood inundation, 3150.5hectares or 88.26% of Built_Up_Areaclass will be impacted while 419.2hectares or 11.14% of farmland class will be at risk.
Figure 3.2: Overlay of HR floodplain, Built_Up_Area and Farmland
The result of this analysis revealed that out of the 885.3hectares of land that are prone to high risk flood inundation, 816.7hectares or 92.25% of Built_Up_Area class will be impacted while 68.6hectares or 7.75% of farmland class will be at risk.
4. Conclusion and Recommendations 4.1 Conclusion
Remote sensing and GIS technologies have been able to identify areas with very high, high, moderate, low and no risk of inundations within the study area. Landsat-7ETM+ image of 2012 was used to classify the study area. The result shows a high concentration of human activities very close to the Anambra River as regards to the Built_up_area class in the classification result.
Very high risk area of flood inundation covers a total area of 35777565.218hectares, out of which Built_up_area occupies 71.2% or an area of 25480919.026hectares while farmland occupies 11.7% or 4192019.148hectares. The slope gradient map revealed that large percentage of the area studied is made up of flat terrain. This corroborated the findings of Fabiyi et al (2012) that Anambra state has a large portion of its communities and local government areas below the flood threshold level of 10%.
4.2 Recommendations
Based on the results and analysis obtained, the following recommendations were made:
ii. Farming activities should be discouraged on the areas with very high risk and high risk of inundation except dry season irrigation farming where suitable.
iii. Enforcement of proper waste management and deep drainage system, proper channelization and real-time monitoring of water dynamics
References
Fabiyi, O.O., Adagbasa, G.E., Efosa, O and Enaruvbe, G.O (2012). Flood Risk and Vulnerability Analysis in Ibadan and Environs. In: B, Ayeni and O, Fabiyi (Eds): Geospatial Technologies & Digital Cartography for National Security, Tourism and Disaster Management. Proceedings of joint Conference of Geoinformation Society of Nigeria & Nigerian Cartographic Association.
Ishaya, S. Ifatimehin, O. O., and Abaje,I. B. (2009). ‘’Mapping Flood Vulnerable Areas in a Developing Urban Centre of Nigeria’’.Journal of Sustainable Development in Africa (Volume 11, No.4, 2009) ISSN: 1520-5509, Clarion University of Pennsylvania, Clarion, Pennsylvania.
Igbokwe, J.I (2010). Geospatial Information, Remote Sensing and Sustainable Development in Nigeria.15th Inaugural Lecture of NnamdiAzikiwe University, Awka.
Nwilo, P.C (2013). Geospatial Information in Flooding and Disaster Management in Nigeria.7th Annual Lecture of Faculty of Environmental Sciences, NnamdiAzikiwe University, Awka.
Seyedeh, S. S., Thamer, A. M., Mahmud, A. R. B., Majid, K. K., and Amir S. (2008), ‘’Integrated Modelling for Flood Hazard Mapping Using Watershed ModellingSystem’’,American Journal of Engineering and Applied Sciences 1 (2): 149-156