Universidad Complutense
Facultad de Informática
Ingenieria Informática
Tecnología Específica de Computación
June 16, 2017
Persimmon
A visual dataflow language for machine learning
Álvaro Bermejo García Supervised by Manuel Freire Moran Cosupervised by Pablo Moreno Ger
Abstract
Persimmon is a visual programming interface that leverages scikit-learn to pro-vide a drag and drop interface for developing Machine Learning and Data Mining pipelines. It is based on the dataflow programming principles, giving the user a functional visual language with a type safety system that checks connections at write time, non-strict evaluation, task parallelization, and execution visualization. It has been evaluated by participants on a three-task form, overall receiving good reviews, being praised by the use of colors to indicate types, consistent design, easy to navigate and shallow learning curve.
Pro-Contents
1. Introducción 7 Descripción . . . 7 Motivación . . . 9 Objetivos . . . 9 Que no es el proyecto . . . 10 Estructura de la memoria . . . 10 2. Introduction 11 Description . . . 11 Motivation . . . 12 Objectives . . . 13What the project is not . . . 14
Project Structure . . . 14 3. Focus 15 4. Literature Review 16 On Machine Learning . . . 16 On Dataflow Programming . . . 17 On Visual Programming . . . 18
State of the art . . . 18
5. Workflows 21 Simple . . . 21 Regular . . . 21 Complex . . . 22 6. Milestones 23 Tree . . . 23 Gantt Chart . . . 24 Development Methodology . . . 25 Source Code . . . 25 7. Risk Analysis 27 Stakeholders . . . 27
8. Interface Design 29 Sketches . . . 29 Colour Palette . . . 31 Typography . . . 31 9. Implementation 32 First Iteration . . . 32 Second Iteration . . . 33 Third Iteration . . . 33
Model View Controller . . . 35
Making a Connection . . . 36
Visualizing the Data Flow . . . 38
Binary Distribution . . . 39
10. Type Checking 41 Gradual Typing . . . 41
Write Time . . . 41
The two languages . . . 41
Actual Types . . . 42 Intermediate Representation . . . 43 11. Evaluation 45 Method . . . 45 Proposed Tasks . . . 45 Evaluation Results . . . 46 12. Conclusiones 49 Revisión de Objetivos . . . 49 Retrospectiva . . . 50 Conclusión . . . 50 Trabajo Futuro . . . 51 13. Postmortem 52 Objectives Review . . . 52 Retrospective . . . 53 Conclusion . . . 53 Future Work . . . 54 Bibliography 55 A. Package Organization 59 Backend . . . 59 View . . . 59
B. How was this document made? 60 Process . . . 60 Diagrams . . . 60 References . . . 60 C. Persimmon Evaluation 61 Preparation . . . 61 Previous Questions . . . 61 Tasks . . . 61 Additional Feedback . . . 62
List of Figures
4.1. Graph Execution algorithm . . . 17
4.2. Azure ML Studio web interface . . . 19
4.3. Unreal Engine 4 Blueprint system . . . 20
5.1. Just validation of the model . . . 21
5.2. Prediction using the whole dataset . . . 21
5.3. Adjustment of hyper parameters. . . 22
6.1. Milestones Tree . . . 23
6.2. Gantt Diagram of the project development. . . 24
8.1. Sketch of the first interface. . . 29
8.2. Sketch of the second interface . . . 30
8.3. Types colors. . . 31
9.1. Implementation of the first interface . . . 32
9.2. Second iteration implementation. . . 34
9.3. Third iteration interface showing a warning . . . 35
9.4. Widget Tree . . . 36
9.5. Connections between elements . . . 37
9.6. Connection modification handling . . . 38
10.1. Type hierarchy . . . 43
10.2. IR definition on Haskell . . . 44
11.1. Participants familiarity . . . 46
11.2. Task score per task per participant . . . 47
12.1. Persimmon en el extranjero . . . 50
13.1. Chinese machine learning forum . . . 53
1. Introducción
En este capítulo se presenta Persimmon, así como los objetivos y las motivaciones del proyecto. También se incluye una sección sobre temas relaciones con el proyecto pero que quedan fuera del ámbito del mismo. Finalmente se encuentra una breve revisión de la estructure de la memoria.
Descripción
El campo de Data Science ha visto un incremento exponencial de mercado en los úl-timos años, con predicciones vaticinando que hasta un millón de científicos de datos serán necesarios para 2018 (Rajpurohit, 2016). Los científicos de datos se encuentran en una situación excepcional, para el Harvard Business Review es “the sexiest job of the 21st century” (Davenport and Patil, 2012). Y sin embargo, a pesar de todo esto faltan profesionales que puedan cubrir estos puestos, la disciplina es inherentemente multidisciplinaria (Taylor, 2016), incluyendo conocimiento de estadísticas, matemáticas, programación y del dominio. Esto hace que el camino para convertirse en un experto sea largo y complejo, lo cual desemboca en las llamadas “cazas de unicornios” (Harris and Eitel-Porter, 2015) y (Press, 2015).
Herramientas como scikit-learn1, Weka o Tableau permiten un acceso simplificado y de
alto nivel a las herramientas necesarias para hacer Data Science, suavizando la curva de aprendizaje y aumentando la oferta de profesionales capaces de desarrollar análisis de datos.
Estas herramientas por otro lado requieren programación, se centran en tareas de limpieza y pre-procesamiento de datos, o proveen una interfaz muy limitada.
Persimmon pretende proporcionar una interfaz visual para scikit-learn, dando la habili-dad de crear complejos procesos de análisis sin escribir una sola línea de código, dando al usuario una expresividad comparable a la programación tradicional a la vez que se le ayuda mediante estímulos visuales.
Para poder conseguir esto el proyecto explora las siguientes disciplinas,
1Scikit-learn es una librería de Python que trae una multitud de algoritmos de aprendizaje automático a una API que permite el uso y comparación del os mismos en un alto nivel de abstracción.
• Dataflow Programming. Este paradigma representa programas como grafos acicli-cos dirigidos, iniciado en los 60 en el MIT y los laboratios Bell (Kelly et al., 1961). Modela los programas como un flujo de datos que pasa por una serie de intrucciones en vez de una serie de instrucciones que operan en unos datos externos, i.e. los datos fluyen por las instrucciones, no al revés (de ahí el nombre de dataflow). Esto pro-duce programas paralelos por naturaleza, más cercanos al paradigma funcional que al imperativo y a la arquitectura Von Neumann (sección 15, Backus, 1978).
• Programación Visual. La elección por naturaleza para representar un lenguaje de dataflow es una interfaz visual, pudiendo representar el grafo de forma clara y precisa (Shu, 1988). Mejorar más avanzadas que se pueden implementar gracias a la presentación visual incluyen comprobación de tipos en tiempo de escritura, indicador de ejecución (señalando que funciones se están ejecutando en el momento), etc.
• Experiencia del Usuario. El proyecto se nutre de la experiencia de los participantes en los experimentos con el prototipo. La interfaz debe indicar el camino para realizar la acción deseada por el usuario, dando facilidades para reducir la dificultad de uso.
• Ingeniería del Software. Comunicación con múltiples librerías y frameworks, defini-ción de interfaces y organizadefini-ción del código mediante tecnicas de programadefini-ción orientada a objetos y modulos.
• Aprendizaje Automático. Aunque no se implementan los algoritmos en sí, es nece-sario extenso conocimiento de la implementación, ya que hay que propocionar un punto de acceso a los hyperparametros y otros tipos de configuración que permite sklearn (Varoquaux et al., 2015).
• Transformación de Datos. Algunas precondiciones sobre los datos han de ser asum-idas o el usuario ha de ser provisto con las herramientas necesarias para realiar las transformaciones necesarias.
• Compiladores. El grafo visual que el usuario dibujo tiene que ser compilado a codigo fuente en Python (Transcompilación).
La hipótesis del proyecto es que la representación visual del programa y los conceptos asociados puede ayudar con el aprendizaje y uso de técnicas de aprendizaje automático, así como acelerar el trabajo de exploración temprana típico del análisis de datos.
Esta hipótesis converge con el espíritu de sklearn (Varoquaux et al., 2015, pp29) en el he-cho de que intenta simplificar el uso y acceso a herramientas de aprendizaje automático. Esta estrategia parece haber funcionado para sklearn, convirtiéndose en uno de los proyectos de aprendizaje automático de código libre más importantes, con más de 16000 estrellas en Github, siendo usado por compañías como Spotify, Facebook o Evernote (scikit-learn, 2016).
Motivación
Tras cursar Aprendizaje Automático el año pasado tuve una beca en una empresa de trading algorítmico como parte del equipo de quants2.
Allí mi principal responsabilidad era reescribir parte de las herramientas de MATLAB a Python, durante ese proceso observé como algunos de los integrantes del equipo experi-mentaban dificultades con el cambio de lenguaje.
Todos los integrantes venían de disciplinas más “puras” (Física, Matemática, Estadística, Ingeniería Aeroespacial, etc..).
Los expertos de estos campos están acostumbrados a trabajar con lenguajes de dominio específico como MATLAB, R, Simulink o Julia, y el cambio a un lenguaje deu so general trae dificultades como la programación orientada a objectos, complejas estructuras de datos, optimización o tipos más “fuertes”.
La situación es aún mas difícil para aquellos que comienzan el aprendizaje, ya que no solo tienen que lidiar con la barrera de la programación, sino que además tienen que superar la dificultad de los algoritmos en sí.
Objetivos
Estudio Viabilidad: El proyecto tiene que explorar el espacio de posibles soluciones visuales
de aprendizaje automático, evaluando distintas estrategias en el front y backend de la aplicación.
Diseño y Usabilidad: El sistema ha de ser diseñado acorde a los requerimientos, tanto en
términos de hacer sencillo el progreso a traves de milestones, como produciendo software usable en cada release. En todos los casos se debe balancear la compleji-dad contra la expresivicompleji-dad del sistema, proviniendo al usuario deu na herramiento potente sin producir una interface compleja.
Evaluación: El sistema será evaluado por participantes que pertenecen a la audiencia
potencial del software, un formulario debe ser preparando detallando las actividades que tendrán que realizar, así como serán tratados sus datos.
Herramienta de aprendizaje: El software debe ayudar con la barrera de programación,
fa-cilitando el aprendizaje de Machine Learning, ayudando al estudiante a centrarse en las conexiones, intuiciones y bases matemáticas de los algoritmos y no en los detalles de implementación y peculiaridades del lenguaje.
Acelerar análisis exploratorio: Proveyendo una interfaz visual fácil de usar con la
capaci-dad de arrastrar y soltar el usuario puede provar una plétora de algoritmos, aju-stando los hyperparámetros acorde a la evaluación sin escribir una sola línea de código.
Implementación: Hay ciertos requerimientos no-funcionales que deben ser
cumpli-dos como el proyect ocorriendo en las principales plataformas de escritorio, ser distribuido en un ejecutable fácil de instalar para facilitar la evaluación, tener un framerate que permita el uso prolongado, y hacer uso de multiple hilos de jecución para que la interfaz se mantenga usable mientras el grafo se ejecuta.
Que no es el proyecto
El proyecto no lidia con los siguientes temas:
• Procesado de datos genéricos. Aunque hay algunas funciones de manipulación de datos que son necesarios y/o están incluidas en sklearn, la manipulación de datos está fuera del ambito del proyecto, Persimmon trabaja con datos ya limpios. Esto se hace porque estas funciones son difífiles de presentar de manera visual, requiriendo interfaces especiales para ser utiles.
• Visualización de Datos. Ya que esto suele requerir código específico para cada caso, y depende de las características concretas de los datos a visualizar.
• Programación Visual de uso general. Ya que centrando el sistema en el aprendizaje automático permite hacer asunciones sobre los posibles programas que se pueden crear, permitiendo características como simplificación de tipos (capítulo type) o eliminar la necesidad de especificar el orden de ejecución (capítulo literature re-view).
Estructura de la memoria
La estructura de la memoria sigue la cronología del proyecto. Iniciando con la revisión de la literatura académica y la definición de workflow (proceso). En el siguiente capítulo las milestones del proyecto son explicadas, incluyendo un diagrama de Gantt. Siguiendo se encuentra el capitulo de análisis de riesgos, con una table de riesgos así como una review de la metodología de desarrollo.
Hacia la mitad de la memoria en el capítulo de interfaz se expone las razones que llevan al actual aspecto de la interfaz. El capítulo de implementación explica el proceso iterativo del proyecto, centrándose en problemas complejos e interesante que el proyecto ha tenido que superar. En la sección de type checking múltiples conceptos teóricos son introducidos, sobretodo teoría de lenguajes funcionales, compiladores, teoría de tipos y la representación inmediata.
La última sección antes del post-mortem explica el proceso de evaluación y los resultados. En el post-mortem se exponen las conclusiones del proyecto, así como posible áreas de trabajo futuro.
2. Introduction
On this chapter Persimmon is introduced, along its main objectives and motivations. It also includes a section about topics that are related but beyond the scope of this project. Finally, it includes an overview of the project report structure.
Description
Data Science has seen exponential growth in the market on recent years, with some predictions stating that one million data scientists will be needed by 2018 (Rajpurohit, 2016). Data scientists find themselves on a golden age, for the Harvard Business Review it is the sexiest job of the 21st century (Davenport and Patil, 2012). Despite all the hype, there is a shortage of skilled data scientists, the field is inherently multidisciplinary (Taylor, 2016), as coding, statistics and domain knowledge are required, making the path to mastery long and complex, leading to the so called Unicorn hunts (Harris and Eitel-Porter, 2015) and (Press, 2015).
Tools such as scikit-learn1, Weka or Tableau provide a very high level access to some
of the required tools data scientists require, easing the learning curve and widening the pool of available data scientists. However these tools either require coding, focus on just preprocessing tasks (cleaning of the data) or provide a very limited interface.
Persimmon aims to provide a visual interface for scikit-learn, giving the ability to create pipelines without a single line of code, thus giving most of the power of hand coding the pipelines with a helpful visual representation.
In order to accomplish this the project explores the following topics,
• Dataflow Programming. This paradigm presents programs as a directed acyclic graph, pioneered on the 60 at MIT and Bell labs (Kelly et al., 1961). It models programs as a stream of data that is run through a pipeline of instructions rather than a set of instructions that operates on external data, i.e. the instructions are flowing through data, not the other way around. This results in parallel programs by default, closer to the functional paradigm than imperative programming and the Von Neumann architecture, as mentioned in functional programming seminal paper (Backus, 1978).
1Scikit-learn is a python library that aims to bring machine learning to a more general public, by providing a high-level API that allows the ease of use and interchange of different estimators.
• Visual Programming. The natural fit for a dataflow representation is a visual interface, as we can present the graph visually (Shu, 1988). Further improvements include type-checking at write time, i.e. when connecting the blocks only allow for connections that are type safe.
• User Experience. The project is driven by the users’ feedback and engagement with the prototype. The interface needs to convey the intended course of action, and give the user hints in order to ease the difficulty curve.
• Software Engineering. Interfacing with previous existing code, laying well-defined interfaces and organizing code though object-oriented techniques.
• Machine Learning. Although there is no writing implementation of new algorithms extensive knowledge of current implementations is needed in order to surface all the available options, as sklearn provides many ways to modify their configuration through parameters (Varoquaux et al., 2015).
• Data Wrangling. Some preconditions about the data have to be assumed or the user has to be provided with the tools to perform the transformation.
• Compilers. The graphical form of a workflow involving several steps is compiled down to Python source code (Transcompilation).
The hypothesis of the project is that the visual representation of the workflow and the associated concepts can help to both learn and use Machine Learning techniques and to accelerate early exploratory datascience work.
This hypothesis converges with the spirit of sklearn, (see Varoquaux et al., 2015, pp29) that also tries to bring the Machine Learning techniques out of PhD dissertations and niche libraries into the mainstream, providing high-level, easy to use access to those resources. This strategy seems to have worked for sklearn, becoming one of the most important open source machine learning libraries in the process, with over 16000 stars onGithub, and is being used on companies such as Spotify, Facebook or Evernote (scikit-learn, 2016).
Motivation
After learning about Machine Learning at university last year I got an internship on an algorithmic trading company as part of the quant team.
My main task was helping moving the existing codebase from MATLAB to Python, and during that process I observed how some of my co-workers were struggling with the language switch.
They all came from backgrounds such as Maths, Physics, Electric Engineering, Statistics or Aerospace Engineering. But there were no Computer Scientists even though their
role as quants requires, apart from maths and stats knowledge, a very good level of programming expertise.
Experts from these fields tend to have weaker programming skills, as they mostly work with scientific computing oriented languages such asMATLAB,RorJulia, and moving to a general purpose language such asPythoninvolves learning about a plethora of additional topics, such as Object Oriented Programming, custom complex Data structures or cache optimization.
The situation is even more complex for newcomers to Machine Learning, as they not only have to deal with the programming barrier but also have to overcome the difficulties of learning the algorithms themselves.
Objectives
Feasibility: The project has to explore the space of possible solutions on visual machine
learning approaches, trying different estrategies for both the front and backend of the application (Flow based programming, Dataflow programming, etc).
Design and Usability: The system has to be designed in accordance to requirements, both
in terms of making it easy to progress through the milestones, as well as producing usable software at each stage. In all cases it must balance complexity against expresivity, trying to provide the user with a powerful tool while avoiding complex and unusable interface.
Evaluation: The software will be evaluated by participants that belong to the intended
audience of the system, a form must be prepared detailing the task they will have to perform, as well as how their data will be treated.
Learning Tool: The software will help both with the programming barrier, easing the
learning curve of Machine Learning as to allow the learner to focus on the connec-tions, intuitions and mathematical basis of the algorithms and not on the imple-mentation details and the quirks of the language.
Faster Exploratory Work: By providing an easy to use, drag and drop interface the user
can try a plethora of different estimators and adjusting the hyper-parameters as they see fit faster, and without writing a single line of code.
Implementation: There are some non-functional requirements, such as the project
running on the desktop platform, being able to pack it into a executable (to make evaluation easier for participants), have a framerate good enough for pleasant use (minimum 30 FPS), or support multithreading (as to not block the main/UI thread
What the project is not
The project is not concerned with the following:
• General Data Cleaning/Wrangling. Although there is some data manipulation that is necesary and included on sklearn it is outside the scope of the project, Persimmon only works with clean data. This is done because it is very hard to translate code-based data manipulation into a visual representation.
• Data Visualization. Since this kind of work is very hard to represent without requiring explict coding on a case by case basis, as it is highly dependent on the characteristics of the data to visualize.
• General Purpose Visual Programming. Since focusing on Machine Learning allows Persimmon to make assumptions about the possible programs that enable features such as type simplification (check type chapter) or removing explicit flow manage-ment (more on the literature review chapter).
Project Structure
The project structure follows closely the development timeline of the system. Firstly the literature review is introduced. On the following chapter the project milestones are explained, including a Gantt chart. Following is the risk analysis table as well as the development methodology.
The implementation chapter explains the iterative process on each of the iterations of the project, some interesting technical problems, and the immediate representation of Persimmon.
After this, the important concept of workflows is explained, and the interface design, including the sketches or the color palette. The type checking sections introduces a lot of theory from functional programming and type theory. The final section before the post-mortem explains the evaluation process and results. On the final post mortem sections the conclusions of the project are laid down, as well a recap of what went wrong, what went right, what was achieved, and the potential future improvements.
3. Focus
Here is where we thought about contacting the “e-learning UCM” research group at Complutense University because we saw an opportunity to bring the power of the data-science to the educational world, in this case via the educative games.
We thought this would be a good stress test for the software, and giving investigators that may not be datascience experts the ability to measure if serious games were achieving their purposes, meaning if they are really helping to teach their users what they are supposed to.
It was an obvious decision to make it Open Source, many of the tools we use are Open source, and it was the ability to engage with them the reason that we have become Computer Scientist.
This helps many educational games do not have a big budget and in this way our program would be accessible to all of them and they can even tweak some parts of the software if they really need to.
Here is where we started thinking about which technology to use and Python was the obvious choice in order to keep all the project on the same language.
So after looking for several Python UI libraries kivy seemed the most appropriate UI framework.
4. Literature Review
On this chapter the main sources used for the project are explained as well as some of the learning needed in order to build the project.
On Machine Learning
Although the project aims to provide a very high-level tool for machine learning without needing to get too deep into the algorithms, it is necessary to understand the library that is used for performing the actual machine learning (from here onwards referred as ml).
While from the conception of the project python was set as the main language, a parison between ml libraries was done in order to evaluate scikit-learn against the com-petitors. There comparison over different solutions (Ryan, 2016), but they mostly look at deep learning frameworks. In fact, while deep learning is going through a golden age right now (no doubt helped by the push from companies such as Google or Facebook) it is a bleeding edge field (Gschwind, 2017). Neural networks with many layers and complex connections between them are also very difficult to visually represent compared to traditional statistical methods that can be represented as functions more easily, and whole frameworks are dedicated just to represent them such as Tensorflow (Abadi et al., 2016).
On the other hand, traditional machine learning libraries are either embedded on purpose-specific languages (such as R, Matlab, Julia) or have less users than others (Torch has only 7k Github starts).
And finally, cluster-oriented computing frameworks like Spark or Hadoop are usually in compiled languages likeJava orC++ for performance reasons.
Persimmon main tool is scikit-learn (Varoquaux et al., 2015), scikit-learn (also known as sklearn) is based on Numpy (a n-dimensional array for Python (Walt et al., 2011)) and scipy (a scientific computing framework (Jones et al., 2014)). Persimmon also uses pandas (McKinney and others, 2010) for input and output handling.
Others papers related to the pitfalls of machine learning that proved useful when ana-lyzing workflows were (Hughes, 1968), (Khabaza, 2005).
On Dataflow Programming
After reviewing dataflow seminal paper Kelly et al. (1961), and Sousa (2012) it was clear the fundamental step to have a working system was writing a compilation algorithm from the visual representation topython code.
There are different ways to implement dataflow programming compilers, for now let’s just consider the language representation as formed by blocks that have pins. Pins on the left side of a block are called input pins and each must come from a single output pin. Pins on the right side are called output pins and one can be connected to multiple input pins.
This results in what is effectively a directed acyclic graph, in order to compile and run the program (actually it is theoretically possible to have multiple parallel programs on the same blackboard) the graph has to be explored, checking the dependencies of each block, executing them if necessary, executing the function and adding the next blocks to be executed until there is no block left to be executed.
Require: G is a Directed Acyclic Graph that does not break type safety on all the relationships. 1: functionexecute(G:Graph)
2: queue←Queue() 3: seen←M ap()
4: queue.put(G.get input blocks()) ▷We can start in a random vertex 5: while¬queue.empty()do
6: queue, seen← explore(queue.get(), queue, seen) 7:
8: functionexplore(current:V ertex, queue:Queue, seen:M ap)→ Queue, M ap
9: for allin pin∈current.get in pins() do
10: corresponding←in pin.origin.uid
11: if ¬seen.has(corresponding) then
12: dependency←corresponding.block
13: if dependency∈queuethen ▷Remove if already in queue 14: queue.remove(dependency)
15: queue,seen←explore(dependency, queue, seen) 16: in pin.value←seen.get(corresponding)
17: current.f unction() ▷function uses in pins and sets out pins 18: for allout pin∈current.get out pins() do
19: seen.put(out pin, out pin.value) 20: queue.add(pin.destinations) 21: returnqueue,seen
Figure 4.1.: Graph Execution algorithm
The algorithm looks each input pin on the block. If the corresponding value has already been computed (i.e. is already on a hashtable) it is assigned, else that block is processed first and then the execution of the current block resumes. Then the function inside the
block is executed and after that the value of each output pin is saved on the hashtable. There is an alternative way of doing the compilation without needing to check depen-dencies when compiling/executing. Through a topological sort on the graph the graph can be processed “forward only”, no recursive step is needed, both approaches areO(N), more closely they are O(n∗m) where n is the number of blocks and m the number of pins.
On Visual Programming
For designing the interface many notes were taken from Shu (1988), but most importantly from the blueprint system (Shah, 2014) and Azure ML studio web interface (Barga et al., 2015), all these influences are discussed on the state of the art section, and the interface design itself along with the sketches can be seen on the Interface Design chapter.
State of the art
Before implementing the system it was necessary to look at existing solutions on the field of visual programming and visual Machine Learning for inspiration and avoiding common pitfalls.
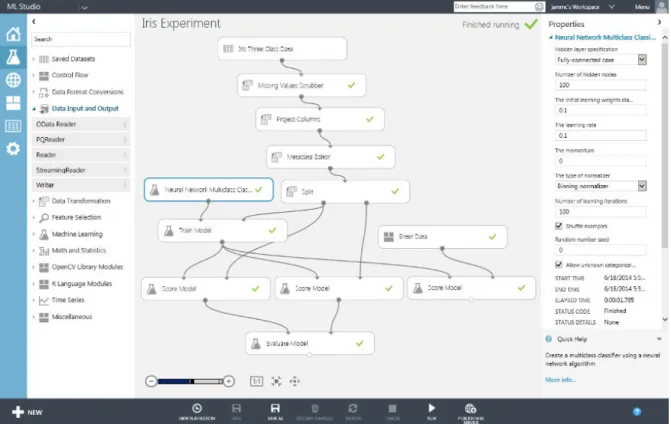
Microsoft Azure ML Studio (Barga et al., 2015) is one of the most direct inspirations for this project; it is a Microsoft cloud-based platform for creating predictive analytic solutions on data using a drag and drop interface.
There is plenty to like, lots of different pre-processing steps, multitude of estimators, runs on the cloud, and a web interface that runs on any platform. However, some of these features are also shortcomings, the web interface feels basic, especially on the classificators parameters view, lack of native support means that dragging and dropping do not feel as smooth as they should. Cloud support is very good, as it integrates with the rest of Microsoft’s Azure platform, but for sensitive data such as financial or medical records a self hosted version is a must.
The variety of algorithms is interesting, but the limited ability to extend them is a shortcoming, azure is written on compiled languages (Ericsson et al., 2017), unlike most ml that is written on either R or Python (Puget, 2017), and running custom code is very limited, as scripts are treated as black boxes. This in turns severely handicaps the extensibility of the given primitives in any meaningful way.
Weka (Hall et al., 2009) is a popular machine learning suite, written in Javaand devel-oped at the University of Waikato. It provides both a command line interface and a graphical interface.
Figure 4.2.: Azure ML Studio web interface
However it is starting to show its age, the interface feels dated and the composition of algorithms through graphical means is very restricted. Because it is written on Java it also means that it need the JVM1, which is a bit of a disadvantage, especially in
production servers where dependencies bring a long and arduous process of review and approval (Zmud, 1980).
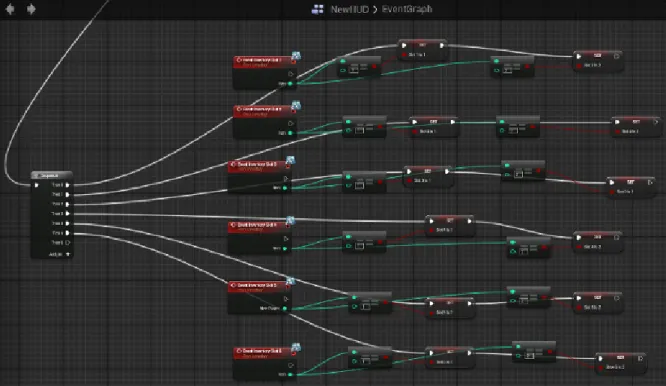
Epic’s Unreal Engine 4 (Shah, 2014) introduced Blueprints as an alternative toC++ pro-gramming. It represents all the programming structures as blocks that can be connected, for example an“and” is a block that takes to inputs and returns one output. Because it provides what is essentially a general-purpose programming language it has constructs to represent state, because of this it also needs a explicit flow mechanism, meaning that blocks do not only need to be connected through data but also by execution order, this is necessary because the order in which side-effects are performed is important, and many procedures do not return meaningful values. With this knowledge, it is clear that in order to not have an explicit flow line the visual language represented must be pure, con-straining side effects to either the start or the end of a pipeline (McBride and Paterson, 2008).
1The Java Virtual Machine is the underlying platform where the Java language is usually run on top of. It provides a single platform in which is abstracted of the underlying hardware architecture at the cost of paying some performance overhead.
Figure 4.3.: Unreal Engine 4 Blueprint system
Blueprints provides an intuitive interface, when one cable is dragged from a block and a prompt appears with only the blocks that make sense to be connected to the previous block. Another example is how different types are represented by different colors in both pins and cables, making it easier to predict whether a connection makes sense or not without even trying to create it.
5. Workflows
A workflow in the context of this project refers to the typical ML exploratory work analysis, i.e. the pipelines that are used early on the project when it is still not known what strategies will work best for the given data.
This concept is generalization of sklearnpipelines.
Simple
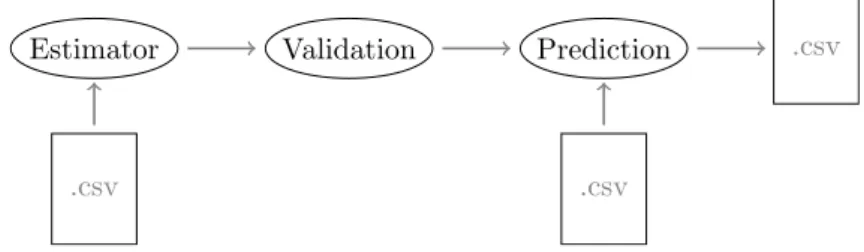
The simplest workflows are those that involve no pre-processing, no adjustment, and just either test how good the model works (validate) or predict using both the train file and another file without class feature.
.csv
Estimator Validation
Figure 5.1.: Just validation of the model
.csv
Estimator Validation Prediction
.csv
.csv
Figure 5.2.: Prediction using the whole dataset
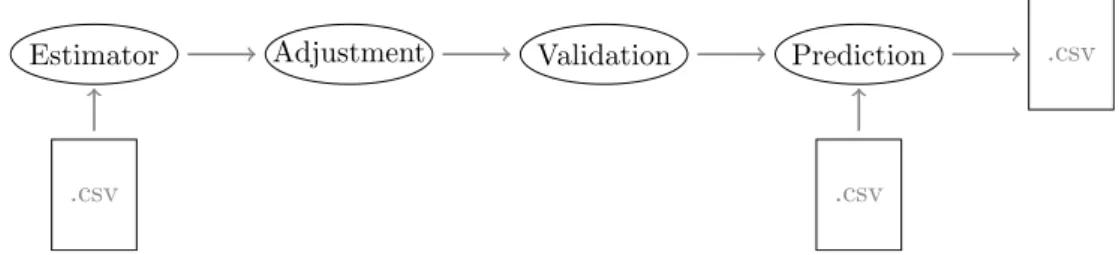
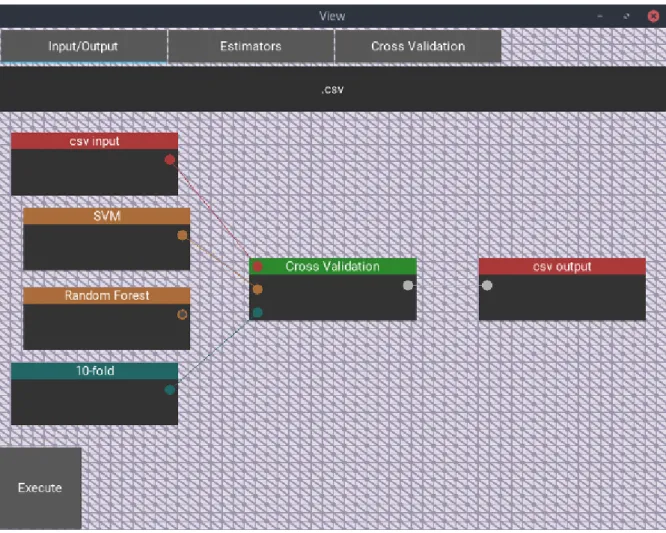
Regular
A more usual workflow involves also tunning the parameters of the selected hyper-parameters, this involves making a grid of the possible hyper-parameters and trying all
of them, resulting in finding the best possible value.
.csv
Estimator Adjustment Validation Prediction
.csv
.csv
Figure 5.3.: Adjustment of hyper parameters
Complex
More complex workflows involve pre-processing, or automating multiple classifiers hyper-parameter tuning at the same time through the use of pipelines, this varies widely on a case by case basis, and can often involve data cleaning, feature engineering (such as combining two features into one) or dimensionality reduction (like PCA).
However, there are even further examples of pipelines where the whole process is au-tomated to the maximum, even going as far as identifying the suitable data features, selecting classifiers for bagging, boosting and other meta-classifiers, etc… (Thakur, 2016). It should be noted that this kind of workflow is outside the scope of the project, as this is far away from exploratory work, and either requires manual data cleaning anyway or an extremely complex pipeline.
In fact, this kind of use case would result unwieldy and messy on a visual form, vi-sual programming gets too bloated when representing programs that are too complex. On Dalke (2003) some workarounds are proposed, such as modules, different shapes for different kinds of blocks, etc… But even with these techniques visual programming languages never truly fulfilled their promises and gained mainstream adoption (Simões, 2015).
However, visual languages managed to become relevant in small niches such as PLCs design (Minas and Frey, 2002) or music composition (Twells, 2016). Presumably because the complexity can be predicted and accounted for when the number of actions is limited, this is the basis for the project programming interface being limited on the number of blocks, as not to allow the graphs to become inscrutable, and as mentioned on the introduction this also allows making assumptions about the interface which reduce the complexity such as not needing an explicit flow line, more on the explicit flow line can be read in theimplementation chapter.
6. Milestones
In order to guarantee the delivery of the software an incremental approach has been chosen, this implies breaking down the objectives into smaller milestones that can be accomplished more easily, so in case the last milestone is not reached there is still a substantial product to submit.
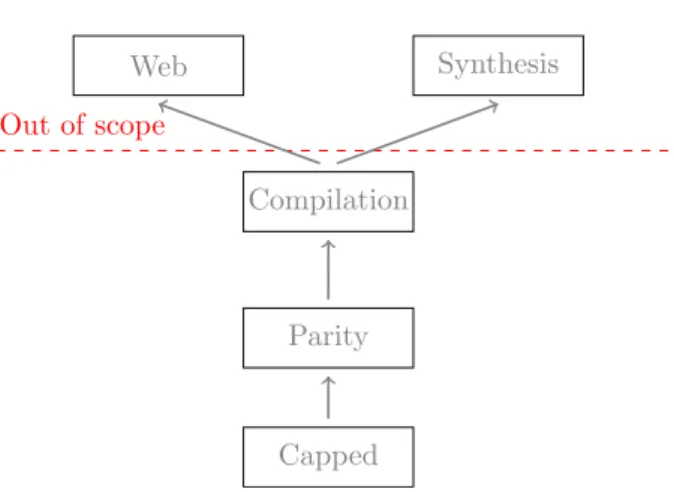
Tree
Capped Parity Compilation Out of scope Web SynthesisFigure 6.1.: Milestones Tree
Capped is more than a minimum viable product, a extensive proof-of-concept, with a few limited algorithms and the ability of inputing .csv files, with a restricted interface in which algorithms are not dragged and dropped but merely selected through buttons.
Paritymeans a more or less complete parity in terms of features and visual interaction. It is not very important to have the same number of underlying algorithms because that’s not the focus of the project, and creating new blocks having the underlying algorithm is easy.
And the final milestone is Compilation, the ability to get the python source code from the visual representation, also improving the interface to have a better flow, more akin to Unreal Engine, as discussed on the literature review chapter, state of the art section. This milestone would bring Persimmon utility beyond the realm of learning tool, as it would be a convenient tool for the exploratory work of any ML solution (business case,
a Kaggle1 competition, etc…).
Out of scope, but possible further applications of the system areweb/junyper integra-tion, which would mean the system would be accessible from a website interface, and script synthesization, which is the opposite of compilation, in other words the ability to translate a python source file to the Persimmon visual representation.
Gantt Chart
With the defined milestones a Gantt chart of the project development was drawn.
2016 2017
October November December January February March April
Distil Idea Planning Implementation Iteration 1 Capped Iteration 2 Parity Iteration 3 Compilation
Report Building Refinement
Development Methodology
The chosen methodology is based on agile methodologies such as Scrum or Extreme Programming, meaning that there is not a complete model of the desired system like in model driven development (Selic, 2003), nor a complete planning of every develop-ment detail at the start of developdevelop-ment, such as on Waterfall (Petersen et al., 2009), instead there are continuous iterations, faster and smaller than traditional development iterations that allow for more opportunity to react and adapt to change (Beck et al., 2001). These iterations last two weeks and are called sprints, and a board is used to keep track of all current and future tasks.
On a traditional Scrum methodology, the product owner puts uses cases (items) into the product backlog. Each sprint the scrum master and the development team have a meeting called Sprint Planning event (Schwaber and Beedle, 2002), where items the current sprint items from the product backlog to be done are decided and broken down into tasks to be done. Items can also be pushed back into the backlog if they are not achievable or have a lower priority.
However, this methodology does not really fit the development of this project, since there is no team, there is no need for superfluous and unnecessary processes. There is no retrospective after each sprint and there is no specific weight or cost assigned to each task. During a sprint the next sprint tasks are moved from the product backlog into the sprint planning column and broken down further if necessary.
Task are defined by use cases and can be broken down further by using checklists on the tasks.
If a task is not fully completed it can be moved back onto the product backlog. The planning board can be found at https://trello.com/b/JmG3xy0U/persimmon
Source Code
The source code for this project is hosted on https://github.com/AlvarBer/Persimmon, the organization of the code follows the feature branch workflow (Atlassian, 2014), it can be described in terms of its branches.
Master branch. The master is the main branch, meaning that it is the default on the
remote web interface, and the only branch where deployments happen, there is no actual development apart from hotfixes, insetead it merges commits from dev, forming a release on each merge.
Dev branch. The dev branch represents the most recent commits, commits are made
usually direct to this branch. Test are run when commits from this branch are pushed to the repo, but not deployment.
Feature-specific branches Sometimes feature specific branches are done in order to test
whether the feature is feasible or not. This branches are usually short lived, and if it is decides to merge that code it must be to dev.
Continuous Integration runs on travis CI, more on that on the Appendix How was this document made?
7. Risk Analysis
Since there is a significant number of different stakeholders with different interests on the project it is necessary to lay down the risk associated and planning for the biggest and more probable risks.
Stakeholders
I. Project author.
II. Academic Reviewers (Project Supervisor, Moderator…). III. Users.
On the case of the project author is the main stakeholder, his aim being developing a satisfactory project.
The academic reviewers play a support role on the project, they are concerned with ensuring the report follows the university guidelines and making sure the development stays on course.
Prevention & Mitigation
Using Boehm (1991) let’s create a table of risks ordered by impact and risk factor. Take into account all risks presented on the table are probable.
Risk Factor Low Impact Medium Impact High Impact Project Ethics Denial Project Denial Requirements Not defined enough Change at late stage Unreachable goal Technology Performance issues Interoperability Major errors
Starting with Project Risks the denial of the proposed hypothesis would be fatal. In order to mitigate this mistake a solid report skeleton has to be made early on, and getting in contact with suitable project supervisors in order to start morphing the project as soon as possible if required.
would have to be the main tool to measure user engagement.
If a requirements is not defined enough a break by user goals and use case diagrams can help make clear what the requirement details are. If a requirement change appears at a late stage the impact is mitigated by the employment of an agile methodology that allows working on smalls sprints and refocus on ever-changing requirements.
In the case of an unreachable goal partial objectives could established that would be easier to archive, splitting the main goal into several smaller goals, making it easier to at least accomplish some, if not all. This is explored on themilestones chapter.
Performance issues can be countered reducing the data used for processing, making it more of a proof of concept while retaining the validity of the project claims. Another solution is caching the results of the bottlenecks (expensive operations) and using those results in the final application. On the other hand there is no easy solution for interop-erability issues, besides changing development platform/core language there is not a lot that could be done.
Same goes for major errors on the used platform, some alternatives were considered but in case of a major failure later down the line the only real solution is rewriting those parts. For preventing these issues a technical analysis of the capabilities of the platform must be carried out before starting the project, identifying possible faults and providing possible solutions and or alternatives.
8. Interface Design
The main way users interact with the system is through the visual interface, and as such is very important that all the information and operations available are easily accessible on an intuitive manner, removing the need for extensive training with the software.
Sketches
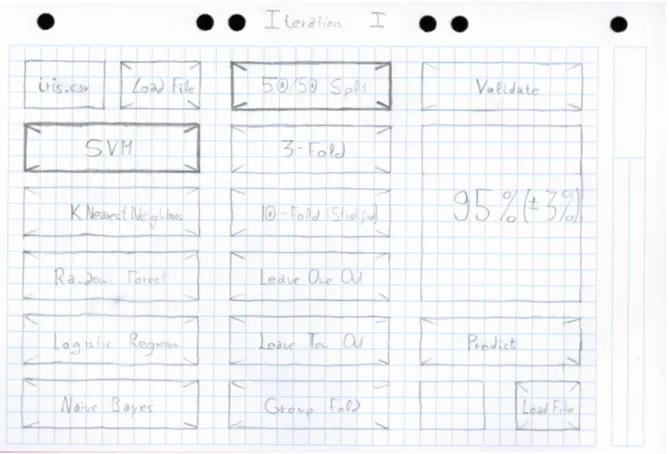
Figure 8.1.: Sketch of the first interface
On the first interface, there was a focus on getting a prototype done as soon as possible. For this reason, the interface had to be easy to implement and easy to use, with the few navigations steps required to perform all possible actions as to allow for quick debugging. This meant sacrificing flexibility in favour of usability, because the algorithms implement
were so few the button-based interface worked as intended for this prototype. No special considerations were taken for color palettes, shapes or any other kind of visual aid.
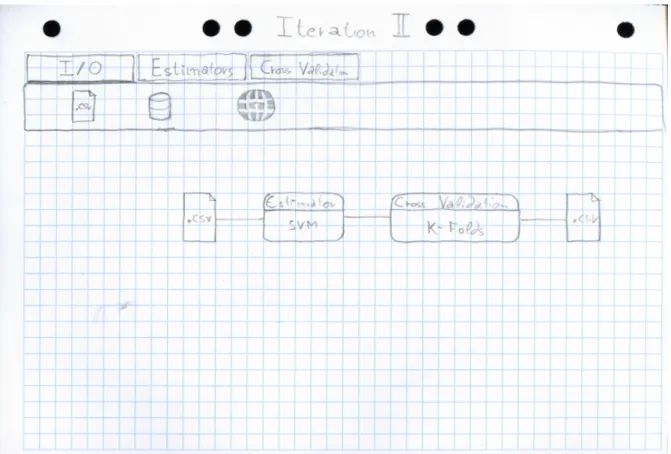
Figure 8.2.: Sketch of the second interface
For the second iteration, however, the extensibility had to be present, meaning the old interface was not reusable for the new functionality. The block based interface gives a lot more of control to the final user, still some underlying mechanisms such as optional parameters or saving into file were not present.
Finally, on the third iteration the proposed improvements to the interface were:
• Adding a smart bubble1 that shows the blocks that make sense to spawn according
to the connection. • Optional parameters. • Hide/Toggle parameters.
• Data transfer visualization, meaning that the connection between two blocks starts signalling when data from one is moved onto the other.
• Type safety indicator while dragging a connection, such as turning the connection cable to a bright red to signal that if the cursor is unpressed at that location a connection will not form.
• Make connections bézier curves instead of straight lines.
Some of these points are not realistic goals to be achieved during the short development time, but they are possible further improvements of the interface.
Colour Palette
One of the most important parts of the system where colour played a vital role was connections, symbolizing types with colours. The relations go as far as each types has a colour associated with it on code, meaning that pins are not coloured, their type is specified and their colour is derived from the type.
The color palette is based on (Staníček, n.d.), on a tetrad (4-colours) scheme plus addi-tional primary colours for representing addiaddi-tional types, the Any colour is represented as almost white to symbolize it is consistent with any other type.
Dataf rame Classif icator CrossV alidator State Any
Figure 8.3.: Types colors
Typography
The default font for kivy is Roboto, and for a good reason, as one of Kivy targets is Android, which has Roboto as the most commonly used font. Roboto is a neo-grotesque sans-serif with a modern robotic feel, it really feels at home on mobile screens, and it is also used on other Google’s products and websites. However on the desktop it feels a bit too cold and ubiquitous, as John Gruber calls it “Google’s Arial’. The better solution would be platform-dependent, but since Mac default choice, Helvetica, has trouble rendering in some Window and Linux desktop environments, Roboto was left as the choice for font rendering.
9. Implementation
On this chapter the implementation of the system is detailed, explained what was done in each iteration. After the iterations Persimmon intermediate representation is explained. Finally, some of the most complex technical problems along their respective solutions are detailed.
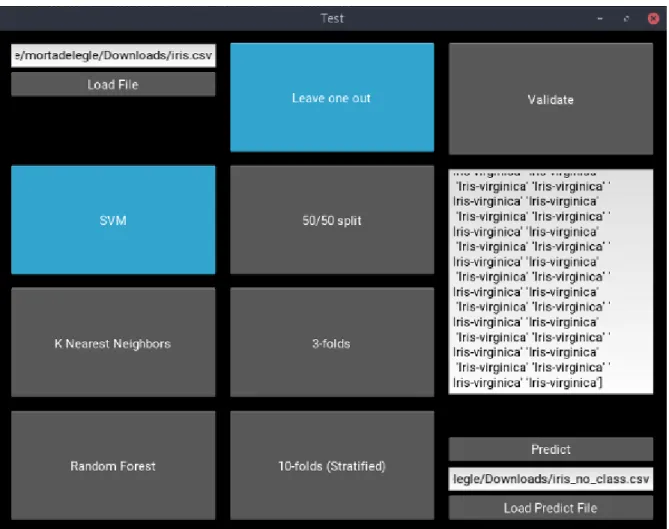
First Iteration
For the first iteration, the priority was to get a proof of concept in order to see where the difficulties can appear, with a few simple classifiers and cross-validation techniques. As such a button-based interface with very limited workflow creation was chosen. The chosen classifiers were simple and well-understood methods such as K-Nearest Neigh-bors, Logistic Regression, Naive Bayes, Support Vector Machines and Random Forest, which a slightly more complex method that involves ensemble of Decision Trees, but gives good results in wide variety of problems.
All these classifiers have few parameters on their respective sklearn implementations, and for this prototype the interface did not allow modifying any of them, as the it would have cluttered and it was not a necessary feature. Also, all of them are classifiers, as it simplifies the interface, since regression and clustering have some incompatibilities. Apart from the temporary interface the backend had to be built. Since the workflow was fixed the backend simply received the node as arguments and executed those, meaning the previously explained execution algorithm was not needed for this iteration.
Second Iteration
For the second iteration the drag and drop feel was the main priority. As such after developing the tab panel draggable boxes were developed, these boxes needed to be connected through pins. The logic behind the pins and the blocks is quite heavy, as there is a tight coupling between the blackboard1, blocks and the pins on them, as all of
these parts relay information to each other while the user is dragging a cable between two pins, this is further explained on the “Making a connection” section.
This tight coupling means there is a noticeable lag when moving the cable too fast on low-end computers, there are several solutions to this, but the most convenient is optimizing the method. If more optimization is needed for this particular function tools such as Numba2 orCython could be used.
Third Iteration
For the third and final iteration, the focus was on improving the visual aspect, adding helpful aids to the user experience. The main addition being adding a notification systems that gives feedback to the user about the outcome of their actions and the type systems that prevents creating malformed pipelines. Other minor improvements to the system were the addition of a warning when the intended connection is not possible, by
1Blackboard is where the blocks and connections reside.
2Numba is a python library that allows the compilation and jitting of functions into both the CPU and the GPUhttp://numba.pydata.org/
changing the color line to red, and a warning showing up when a block has only some of their inputs connected.
Figure 9.3.: Third iteration interface showing a warning
Model View Controller
Since the beginning of development separation of logic and presentation has been a pri-ority. For this reason, the Model View Controller3 pattern has been applied, separating
Model (represented by the subpackage backend), View (represented by the .pyfiles on view subpackage) and Controller (corresponding to the .kv files on view subpackage). This way coupling is kept as minimal as possible, enabling swapping the current kivy framework for another one by just changed the view, no modifications to the backend needed.
In order to avoid repetition extensive use of classes coupled with reusable custom kivy Widgets were used. This for example meant that each individual pin on each block is a class, this proved useful for defining matching pins in different blocks (like when connection a pin that sends data to a pin that receives it).
For more information about internal package distribution check appendix A.
Making a Connection
One of the most complex parts of the system is starting, reconnecting and deleting a connection between blocks, it involves several actors, asynchronous callbacks and a very strong coupling between all elements.
Blackboard
Block
OutPin
Connection Block
InPin
Figure 9.4.: Widget Tree
In order to understand how connections are made it is necessary to understand how
Kivy handles input. At surface level Kivy follows the traditional event-based input management, with the event propagating downwards from the root. However, while traditionally inputs events are only passed down to components that are on the event positionKivypasses the events to almost all children by default, this is done because in phones (one ofKivytargets is Android) gestures tend to start outside the actual widget they intend to affect.
On Kivy there are three main inputs events, on_touch_down that gets called when a key is is pressed, on_touch_move that is notified when the touch is moved, i.e. a finger moves across the screen, or on this cases when the mouse moves, andon_touch_upthat is fired when the touch is released.
Let’s represent the possible actions as use cases, the outer * represents on_touch_down, - represents on_touch_move, and the inner *on_touch_up:
• (On pin) Start a connection.
• (On connection) Modify a connection.
– Follow cursor.
* (Elsewhere) Remove connection.
Logic is split in two big cases, creating a connection and modifying an existing one. Creating a connection involves creating one end of the connection, both visually and logically and preparing the line that will follow the cursor. On the other hand, modifying a connection means removing the end that is being touched. These two cases can be handled by different classes, pin on the first case and connection for the last. Moving and finishing the connection use the same code for both.
Connection Block OutPin end Block InPin start
Figure 9.5.: Connections between elements
Without getting too deep into implementation details, ends cannot just be removed, there are visual binds that have to be unbinded and removed from the canvas, and when a connection is destroyed (this only happens inside on_touch_up, but it can be either the pins or the blackboardon_touch_updepending if the connection is destroyed because the pin violates type safety or there is no pin under the cursor respectively) it has to unbind the logical connections of the pins themselves. For this reason, connection has high-level functions that do the unbind, rebind and deletion of ends, as long as the necessary elements are passed (dependency injection pattern).
This is the reconnecting logic, notice how the reconnecting is forward or backwards
depending on which edge the touch has happened, of course if neither has been touched the touch event is not handled.
def on_touch_down(self, touch):
""" On touch down on connection means we are modifying an already existing connection, not creating a new one. """
if self.start.collide_point(*touch.pos): self.forward = False
self.unbind_pin(self.start) self.uncircle_pin(self.start)
self.start.on_connection_delete(self) touch.ud['cur_line'] = self
self.start = None return True elif self.end.collide_point(*touch.pos): self.forward = True self.unbind_pin(self.end) self.uncircle_pin(self.end) self.end.on_connection_delete(self)
touch.ud['cur_line'] = self self.end = None
return True
else:
return False
Figure 9.6.: Connection modification handling
Visualizing the Data Flow
One of the latest features that made it into Persimmon is the visualization of the data flowing through the cables between blocks, this was an interesting technical problem, since it involving relaying data back from the backend into the frontend (previously the communication between front and backend was unidirectional). But in order to preserve the decoupling between both the backend IR had to remain untouched. For this reason it was decided that the backend has an event where it announces it has finished executing a block and the frontend has to subscribe to it.
But the frontend does not receive the block, only the hash, since that is all the backend has, and it has to compare with all block hashes to find the actual block.
After this, the backend has to make the outgoing connections of that block pulse, mean-ing for example changmean-ing the value of the width of the line between certain values, a function that works well for this is the sin function. The tricky part is that each time the function is called it has to remember the previous value in order to grow or decrease the width accordingly, this cannot be done on a regular function since using sleep would freeze the entire application, and the best way to maintain state between executions is using a generator (also known as semi-coroutines).
But what happens when coroutine needs to be stopped from being called? Kivy has a mechanism where if the scheduled function returnsFalse it will stop calling, by default our coroutine does not return any meaningful value, but it is possible to yield a final
False that will stop the calls. But how is that yield triggered? The proper solution solution is using a full coroutine (either a generator-based one of the newer asyncio ones), but then concurrency issues appears, such that since the coroutine is being called 20 times per second if the coroutine is called while it is executing the scheduled interval it will ignore the second call.
The solutions comes from executions, similar to a fast interrupt in hardware it is possible to throw a execution on a coroutine that (maybe) is running, this also mean that the throwing hijacks the current execution, leading to two different returns needed, one for the interrupt execution and another for the previous running execution (if it was running,
With the throw solution there is no need for a full coroutine anymore, and a generator can be used again.
def pulse(self):
self.it = self._change_width() # Create iterator
Clock.schedule_interval(lambda _: next(self.it), 0.05) # 20 FPS
def stop_pulse(self):
self.it.throw(StopIteration) # Hijacking execution
def _change_width(self):
try:
for value in self._width_gen(): self.lin.width = value
yield
except StopIteration:
self.lin.width = 2 # Return width back to default yield # This yield is for the hijacking execution yield False # And this for the regular execution
def _width_gen(self):
""" Infinity oscillating generator (between 2 and 6) """
val = 0 while True:
yield 2 * np.sin(val) + 4
val += pi / 20
Binary Distribution
The interpretative nature of Python does not make creating an executable binary easy, particularly cPythonthe standard implementation and reference provides no tooling to create an executable binary.
For this task PyInstallerwas chosen, the process of creating a binary is mostly auto-mated, given a script it tries to read the imports and include them, finally it embeds a small interpreter to run this code. The problem with this approach is that Python allows for alternative ways of importing, it also breaks resource loading at execution time (since it has to create a temporary folder). This results in manually specifying hidden dependencies and non python files (on this case mostly kv files).
Unfortunately, this process has to be done on a windows system, and as such cannot be done on the CI4 server, to see how Persimmon utilizes CI check the appendix B.
10. Type Checking
Although Python has no robust type checking step it is possible for our visual language to have hard guarantees of correctness at write time, meaning that the building of incorrect pipelines can be avoiding altogether.
Gradual Typing
Python allows for gradual typing since 2014 (Rossum et al., 2014), meaning that function parameters can be specified and tools such asmypywill check for possible type errors, if some parameter or function type is not specified the tool will simply ignore the associated checks.
These tools provide a useful tool to introduce type checking in current and new python code, however they run outside the python execution (i.e. they run on the non-existent python compile time) and Persimmon needs run time type checking for dynamic block connections.
Nevertheless, this is a useful tool for improving the code quality, specially for the backend code, because it is much pure that the frontend. It is also a reference for Persimmon type system.
Write Time
On the previous section runtime type checking was mentioned, this is because on the Python side the type checks have to be done at runtime due to blocks being spawned and connected dynamically. But from the visual language perspective the checks are done even before compile time (on the literature referred as write time).
The two languages
As seen on the previous sections and theimplementation chapterPython and Persimmon are essentially two different languages, but just how different are they?
Python Persimmon Paradigm Imperative Functional (Dataflow) Dynamic or Static Dynamic Static
Strong or Weak Weak (Duck typing) Strong Evaluation strategy Eager Non-strict
• Paradigm. Although Python is multi-paradigm (it supports OOP, Module pro-gramming) and it even has some functional tools (map/filter/functool) they are very weak compared to a truly functional language, even Python creator Guido van Rossum has hesitations with the current state of functional programming in Python (Biancuzzi and others, 2009). On the other hand Persimmon is functional, as there is no asignment, nor statements, there is only functions.
• Dynamic or Static. Static types refer to the notion of the language using the type information to check for type safety on compilation time/before runtime. The only close thing Python has to this is type hinting, but it is still a relative young addition to the language, most of the existing codebases have not been annotated yet, and the community debates whether it is necessary or not. Persimmon on the other hand checks the type safety of the relations on write time, meaning before execution. Dynamic types is the oposite concept, where type information is used at run time, this can be useful for concepts such as dynamic dispatch.
• Strong or Weak. This refer to the notion of the language coercing the types or certain expressions without the explicit command of the programmer. On some languages this is done only where the type conversion is always safe (most common example is converting an integer to a float) and it is known as upcasting. A very strong language does not perform implicit type coercions [madsen1990strong]. • Evaluation strategy. Most imperative languages have eager evaluation, meaning
that expressions and statements are evaluated as soon as encountered. It is also possible to have a non-strict evaluation, meaning that expressions are evaluated at a latter time. When exactly depends on the exact strategy, optimistic evaluation for example tries to run statements early only if they are fast, if they fail to complete before a certain time they are pushed to a later time (Ennals and Jones, 2003). In fact the extreme version of non-strictness is lazy evaluation, that evaluates only at the last possible time (and only if needed) (Launchbury, 1993).
Actual Types
As explained before the type checks must be done before the execution of the pipeline. However the actual types of the python code underlying functions and parameters do not support this, as duck typing makes interfaces not defined on explicit manners but on the methods used by the underlying code. For example, most algorithms accept
implements __get__ in a manner Numpy understands, but there is no actual interface that can be used to know which objects will run without crashing unless the code is executed.
Any
Classif icator Dataf rame State CrossV alidator . . . ⊥
Figure 10.1.: Type hierarchy
Because of this, types had to be invented, sometimes they correspond to underlying duck typing based interfaces, but sometimes they do not have a direct equivalent on Python. Types on Persimmon follow a simple tree structure, checking whether a connection is safe on the notion of the types having a is-consistent-with relation, this is based on Rossum and Levkivskyi (2014). A is-consistent-with notion extends the more typically used is-subtype-of relation used in type theory, with Any representing the notion of a type that is-consistent-with every type (meaning that it is not a subtype of other types but all types are consistent with any and vice versa). Adding to this blocks of the respective edges of a connection must be different, one of the pins must be anInputPin
and the other anOutputPin, and the InputPin must have no connection already. These are all the rules used for checking if a connection is safe, it is a primitive type system, with further improvements ranging from the ability to define arbitrary subtypes to type classes.
Intermediate Representation
The visual blocks represent a visual-dataflow language, however the backend uses a simpler representation of the relations between the blocks, this in turn helps decoupling backend and frontend.
The frontend blocks are translated on function to_ir, which aparts from translating the blocks it avoids considering orphaned blocks to achieve the desired intermediate representation. Runs onO(n) with n being the number of pins.
Let’s represent the types on a more strongly typed language than Python.
type Id = Int -- The hash is an integer
data Inputs = Inputs {origin :: Id, block :: Id}
data Blocks = Blocks {inputs :: [Id], function :: IO a -> IO a,
outputs :: [Id]}
data IR = IR {inputs :: Map Id Inputs, blocks :: Map Id Blocks,
outputs :: Map Id Outputs}
Figure 10.2.: IR definition on Haskell
As we seen on figure 8.2 the intermediation representation is just three Maps1, one
for blocks, one for input pins and one for output pins. But the maps do not contain pins themselves, merely unique hashes (Int on this case). This reflects the fact that pins model only relationships, not state. The only non-hash value on IR are the blocks functions. These functions are indeed impure2, but earlier on the literature review it
was established that dataflow programming was mainly side-effect free, so why do they involve side effects3?.
There are two reasons, first on the actual python programs this types do not exist, at least not on an enforceable way, so when translating them to Haskell thefunctionfield represents the “worst case”, that is to say only a few functions will actually end up producing side-effects. The second and more important reason is that blocks actually execute themselves, meaning the block function does not has parameters, it relays on getting the values from the pins values and sets the values of the output values, leaving us with the work of setting those input pins and retrieving results from the output pins. This goes against the previously stated “pins represent relationships, not state”, in fact an alternative implementation was created in which the function returned a tuple of results, and it is the compiler job to now associate the output pins to each of the elements on the tuple. This was done using the same current mechanism, saving into a dictionary, the difference being that while currently the values appear on the output pins and have to be moved into the dictionary (or otherwise a reference to the pin itself must be kept on the dictionary) on this case the values were fed directly to the algorithm. However, this proved limiting, as code became more complex since more checks have to be done, there was no obvious advantage and side-effects did not disappeared but merely were harder to do.
With this kind of language it is possible to create arbitrary functions as a composition of functions, all the inputs are either omitted if they are connected through the blocks, else they are promoted to the output of the new function. This works as long as side effects blocks do not depend on each other, this only happens when having both“entry”
and “exit” blocks.
1A Map is Haskell is called a dictionary in Python and Hashtable in other languages. It represents a data structure in which keys are used to retrieve values in a very efficient manner (on hashmap
O(1)).
2The term purity here refers to the absence of side effects on a function, so a impure function is a function that performs side effects,
11. Evaluation
From the conception of the project it was intended to be tested by participants, evalu-ating the usability of the prototype. This chapter explains that evaluation process, how the survey was designed, and the analysis of the results.
The evaluation corresponding to this system has been subjected to ethics approval by the
SCIENCE & TECHNOLOGY ECDAwith protocol number COM/UG/UH/02090, and titled ‘An Evaluation of Persimmon’ at date 22/02/17, amended by theHEALTH SCIENCES ENGINEERING & TECHNOLOGY ECDAat date 20/04/2017.
Method
The method for conducting the evaluation is based on conducting a series of increasingly difficult closed tasks that consist of creating workflows and giving feedback on each of them, as well as some free forms questions at the end of the form. The complete form can be seen at appendix C.
The questionnaire selected is the Single Ease Question as explained in Sauro (2012). It based on of asking how difficult a task was on a seven point scale after it has been performed. Research shows that it provides equal or greater accuracy than more difficult measures of task-difficulty (Sauro and Dumas, 2009).
Along this questions, the participant knowledge and familiarity with Data Mining and Machine Learning is saved, as well as any additional feedback about the system.
Proposed Tasks
The evaluation consists of three different closed tasks. The task are defined as to grad-ually introduce more complex concepts, following the seen workflows on the workflow chapter, being introduced to the concepts of modifying an existing connection and com-plex block that require more interaction from the user.
• First task is the creation of a simple workflow, the objective of this task being to introduce Persimmon to the participants in the simplest terms. Using the iris dataset they perform a cross validation evaluation of their chosen classificator.
• Second task is modifying the previous workflow to create a more complex worflow that fits and predicts using an estimator and two sources of files. It is only slightly more complex than the previous one, but it introduces the concept of re-cabling to the participants.
• Third task and final task. This one involves adding hyper-parameter tunning, which in turns means providing a dictionary with desired parameters.
To see the complete form please check Appendix C.
Evaluation Results
At time of submission the population of the evaluation is n = 3.
All participants showed a good level of familiarity with the subject, defining themselves as quite familiar in the fields of Machine Learning, Data mining and Visual Machine Learning/Data Mining tools (76%, 71.4% and 57.14% average score respectively).
Figure 11.1.: Participants familiarity
com-point scale). This means that the participants found the tasks relatively easy, they also performed the tasks on schedule (30’ or less).
The tasks standard deviation were quite uniform, with σequal to 1, 1.15 and 0 for tasks one, two and three respectively. This indicates that the population largely agrees, with no visible outliers.
Figure 11.2.: Task score per task per participant
While these are good indicators that the interface of the system succeeded on its inten-tions, the most important data from the evaluation is perhaps the free form quesinten-tions, where participants unanimously agreed on the need for the ability to delete blocks. Ano