Institut für
Höchstleistungsrechnen
Mathias Nachtmann
MODEL-CENTRIC TASK DEBUGGING
AT SCALE
FORSCHUNGS- UND ENTWICKLUNGSBERICHTE
MODEL-CENTRIC TASK DEBUGGING
AT SCALE
Höchstleistungsrechenzentrum Universität Stuttgart
Prof. Dr.-Ing. Dr. h.c. Dr. h.c. Prof. E.h. M. Resch Nobelstrasse 19 - 70569 Stuttgart
Institut für Höchstleistungsrechnen
von der Fakultät Energie-, Verfahrens- und Biotechnik
der Universität Stuttgart zur Erlangung der Würde eines
Doktor-Ingenieurs (Dr.-Ing.) genehmigte Abhandlung
vorgelegt von
Mathias Nachtmann
aus Backnang
Hauptberichter:
Prof. Dr.- Ing. Dr. h.c. Dr. h.c. Prof. E.h.
Michael M. Resch
Mitberichter:
Prof. Jesùs Labarta
Tag der Einreichung:
19.06.2017
Tag der mündlichen Prüfung: 14.05.2018
CR-Klassifikation:
I.3.2, I.6.6
ISSN 0941 - 4665
2017
HLRS-17
Abstract
Chapter 1, Introduction, presents state of the art debugging techniques in high-performance computing. The lack of information out of the programming model, these traditional debugging tools suffer, motivated the model-centric debugging approach. Chapter 2, Technical Background: Parallel Programming Models & Tools, exemplifies the programming models used in the scope of my work. The differences between those models are illustrated, and for the most popular pro-gramming models in HPC, examples are attached in this chapter. The chapter also describes Temanejo, the toolchain’s front-end, which supports the applica-tion developer during his acapplica-tions. In the following chapter (Chapter 4), Design: Events & Requests in Ayudame, the theory of “task” and “dependency”
repre-sentation is stated. The chapter includes the design of different information types, which are later on used for the communication between a programming model and the model-centric debugging approach. In chapter5,Design: Communication Back-end Ayudame, the design of the back-end tool infrastructure is described in detail. This also includes the problems occurring during the design process and their specific solutions. The concept of a multi- process environment and the us-age of different programming models at the same time is also part of this chapter. The following chapter (Chapter 6), Instrumentation of Runtime Systems, briefly describes the information exchange between a programming model and the model-centric debugging approach. The different ways of monitoring and controlling an application through its programming model are illustrated. In chapter 7, Case Study: Performance Debugging, the model-centric debugging approach is used for optimising an application. All necessary optimisation steps are described in detail, with the help of mock-ups. Additionally a description of the different optimised versions is included in this chapter. The evaluation, done on different hardware architectures, is presented and discussed. This includes not only the behaviour of the versions on different platform, but also architecture specific issues.
Zusammenfassung
Kapitel 1, Introduction, behandelt aktuelle Debugging Technologien im HPC-Umfeld. Der Mangel an Information aus dem Programmiermodell, den diese Werkzeuge aufweisen, motiviert den modell-zentrischen Debugging-Ansatz. Kapi-tel 2, Technical Background: Parallel Programming Models & Tools, erl¨autert die verschiedenen Programmiermodelle, welche im Rahmen dieser Arbeit einge-setzt wurden. Die Unterschiede zwischen den verschiedenen Programmiermodell-ans¨atzen werden aufgezeigt und Beispiele f¨ur die g¨angigsten Programmiermod-elle werden aufgef¨uhrt. Desweiterem wird Temanejo dargelegt, das Front-End des entworfenen Tools, welches den Anwender w¨ahrend der Softwareentwicklung unterst¨utzt. Im folgenden Kapitel (Kapitel 4), Design: Events & Requests in
Ayudame, werden die Konzepte von “Tasks” und “Abh¨angigkeiten” spezifiziert.
Das Kapitel zeigt zus¨atzlich das Design der verschiedenen Informationstypen, welche sp¨ater f¨ur die Kommunikation zwischen einem beliebigen Programmier-modell und dem Programmier-modell-zentrischen Debugging-Ansatz ben¨otigt werden auf. In Kapitel 5, Design: Communication Back-end Ayudame, wird das Design der
Back-End Infrastruktur detailliert beschrieben. Zus¨atzlich beinhaltet dieses Kapi-tel Analysen der Probleme, die w¨ahrend des Designprozesses aufgetreten sind. Hi-erf¨ur wurden problemspezifischen L¨osungen entwickelt und detailliert beschrieben. Außerdem behandelt das Kapitel den Einsatz von modell-zentrischem Debugging in einer Multi-Prozess Umgebung, bei zeitgleicher Benutzung von verschiedenen Programmiermodellen. Das folgende Kapitel (Kapitel6),Instrumentation of Run-time Systems, beschreibt in k¨urze den Informationsaustausch zwischen einem Pro-grammiermodell und dem modell-zentrischen Debugging-Ansatz. Die verschieden M¨oglichkeiten eine Anwendung durch ein Programmiermodell zu ¨uberwachen und zu kontrollieren werden ebenfalls aufgezeigt. In Kapitel 7, Case Study: Perfor-mance Debugging, wird der modell-zentrische Ansatz zur Optimierung einer An-wendung eingesetzt. Alle notwendigen Optimierungsschritte werden unter Zuhil-fenahme von Mock-ups detailliert aufgezeigt. Die drei optimierte Versionen der Anwendung werden in Detail beschrieben. Die Auswertung der drei Versionen wird auf verschiedenen Hardware-Architekturen ausgef¨uhrt und anschließend diskutiert. Dies beinhaltet nicht nur das Verhalten der Versionen auf verschiedenen Plattfor-men, sondern auch Architekturen-spezifische Probleme.
Acknowledgements/Danksagung
An erster Stelle danke ich meinen Eltern, die mich w¨ahrend meiner schulischen und universit¨aren Ausbildung stets unterst¨utzten und somit diese Promotion ¨uberhaupt erst erm¨oglicht haben.
An zweiter Stelle geht besonderen Dank an Dr. Jos´e Gracia, der mir vor f¨unf Jahren am Bundesh¨ochstleistungsrechenzentrum Stuttgart (HLRS) als Wiss. Mi-tarbeiter die Chance zur Promotion gab. Seine Ratschl¨age und Hilfe jeglicher Art, aber auch die Freiheit die er mir f¨ur meine wissenschaftlichen T¨atigkeiten einr¨aumte, erm¨oglichte die in dieser Arbeit pr¨asentierten Ergebnisse.
Ebenso danke ich Herrn Prof. Dr.-Ing. Dr. h.c. Dr. h.c. Hon.-Prof. Michael M. Resch, f¨ur die M¨oglichkeit als Wissenschaftlicher Mitarbeiter am HLRS arbeiten zu d¨urfen.
Auch m¨ochte ich mich bei allen Projektpartern des Mont-Blanc Projekts bedanken. Viele Ideen und Konzepte sind erst durch Diskussionen innerhalb des Projektes entstanden. Besonderer Dank gilt hier Prof. Jes´us Labarta der durch seine Ex-pertise im Bereich Performanceoptimierung stets die richtigen Fragen stellte.
Ebenso m¨ochte ich mich an dieser Stelle auch bei B.Sc. Jutta Wieland, die mich tatkr¨aftig unterst¨utzte, und bei Dipl.-Phys. Claudius Weimann, ohne den ich sicherlich nicht diesen Weg der Promotion eingeschlagen h¨atte, bedanken.
Herzlichen Dank gilt nat¨urlich auch allen Freunden, Bekannten und Kollegen.
Mathias Nachtmann Stuttgart Juni 2017
Contents
Abstract iii Zusammenfassung iv Acknowledgements v Contents vii List of Figures xi Abbreviations xv 1 Introduction 11.1 Motivation and Goal. . . 2
1.2 Programming Model . . . 3
1.3 Traditional versus Model-Centric Debugging . . . 5
1.4 Model-Centric Debugging for Task-Based Programming Models . . . 7
1.5 Performance Relevance for Model-Centric Debugging . . . 8
1.6 Performance Debugging as Case Study . . . 9
1.7 Outline of the Thesis . . . 12
2 Technical Background: Parallel Programming Models & Tools 13 2.1 Programming Model Overview. . . 13
2.2 OpenMP: Open Multi-Processing . . . 14
2.3 OmpSs: OpenMP SuperScalar . . . 16
2.4 StarPU . . . 19
2.5 MPI: Message Passing Interface . . . 20
2.6 Hybrid Programming Models. . . 23
2.7 Temanejo . . . 23
3 Related Work 25 3.1 Ayudame . . . 25
Contents viii
3.2 Traditional Debugging tools . . . 26
3.2.1 DDT . . . 26
3.2.2 Totalview . . . 26
3.3 Programming-Model-Centric Debugging for multicore embedded sys-tems . . . 26
4 Design: Events & Requests in Ayudame 29 4.1 Introduction . . . 29
4.2 Events in Ayudame . . . 29
4.2.1 Mandatory Information . . . 30
4.2.2 Additional Information . . . 31
4.2.3 Interfaces for C and C++ . . . 33
4.3 Requests inAyudame . . . 35
5 Design: Communication Back-end Ayudame 37 5.1 Introduction . . . 37
5.2 Motivation. . . 39
5.3 Runtime Monitoring and Controlling . . . 40
5.4 Ayudame internals . . . 42
5.4.1 Event Handler for specific programming models . . . 44
5.4.2 Connect Handler. . . 45
5.4.3 Ayu Socket . . . 45
5.4.4 Intern Event . . . 46
5.5 Multi process node environment . . . 46
5.5.1 Connection tree . . . 47
5.6 Identification and Information routing . . . 50
5.6.1 Routing events and requests . . . 50
5.6.2 Unique ID . . . 52
5.7 MPI Matcher . . . 53
6 Instrumentation of Runtime Systems 55 6.1 Introduction . . . 55
6.2 Monitoring. . . 56
6.2.1 OmpSs instrumentation . . . 56
6.2.2 OpenMP Tools Application Programming Interfaces for Per-formance Analysis and Debugging - OMPT . . . 61
6.3 Controlling . . . 62
6.3.1 Tasking Control API - TCA . . . 62
6.4 Simple Stepper . . . 70
7 Case Study: Performance Debugging 71 7.1 Introduction . . . 71
7.2 Optimization . . . 73
7.2.1 Fork Join . . . 75
Contents ix
7.2.3 Communication Overlap . . . 80
7.2.4 Iteration Overlap . . . 82
7.3 Performance Evaluation . . . 83
7.3.1 Evaluation Platform . . . 84
7.3.2 Tuning of number of OmpSs workers and process placement 84 7.3.3 Benchmark on Hazel Hen . . . 86
7.3.4 Benchmark on the Mont-Blanc prototype . . . 86
7.3.5 Comparing the Cavium ThunderX with the Cray XC40 . . . 87
7.4 Use Case Conclusion. . . 89
8 Conclusions & Open research topics 91 8.1 Discussion . . . 91
8.1.1 Evaluation of the design . . . 92
8.2 Open research topics. . . 93
A Appendix 95 A.1 Hardware Technology . . . 95
A.1.1 Non-uniform memory access . . . 95
A.1.2 Memory layers . . . 98
A.1.3 Distributed memory. . . 99
A.1.4 Heterogeneous systems . . . 99
A.1.5 Knights Landing. . . 99
List of Figures
1.1 HPC systems placed in the TOP500 (November 2016) including
their node and core number. . . 2
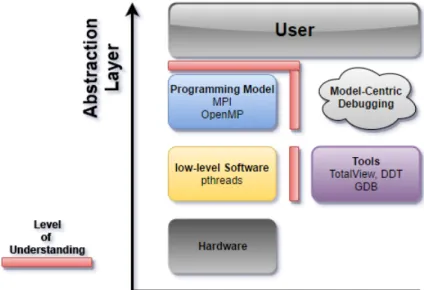
1.2 shows different abstraction layers. The level of understanding is placed between theUser and theProgramming Model. . . 4
1.3 shows the different abstraction layers, in addition the Tools are placed at the same abstraction level as the low-level Software. . . 6
1.4 shows the different abstraction layers, including theModel-Centric Debugging approach (located at the same abstraction level as the Programming Model). . . 7
1.5 shows a two level domain decomposition. The coarse grained de-composition can be used for distributed memory programming mod-els and the fine grained decomposition can be used for taskification. 10
1.6 shows a domain decomposition with marked neighbour tasks. For example: The blue task(4,3) has its neighbours marked in light blue(tasks: (3,3), (5,3), (4,2), (4,4)). . . 11
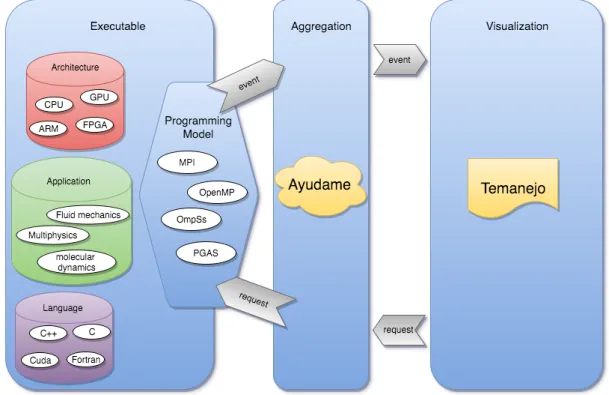
2.1 shows the most relevant programming models for HPC . . . 14
2.2 shows a listing of an “OpenMP parallel for” example. Every itera-tion can be executed by a different thread independently.. . . 15
2.3 shows a listing of an “OpenMP section” example. Every section can be executed by a different thread. . . 15
2.4 shows a listing of an “OpenMP task” example. Both foo tasks can be executed in parallel. The bar task depends on the foo tasks. . . . 15
2.5 shows a listing of an “OmpSs task” example including dependencies between the tasks. According to the dependencies the tasks can be executed.. . . 17
2.6 shows the task-dependency graph of the listing in Figure 2.5. Ac-cording to the dependencies the tasks 4,5 and 6,7 can be executed in parallel. . . 18
2.7 shows a listing of an StarPU example code. . . 20
2.8 shows a listing of an MPI ring example. . . 21
List of Figures xii
2.9 displays a MPI ring application. The dependency graph is
gen-erated with Temanejo. Each colour in the dependency graph
represents a different MPI rank. The different MPI operations are represented with different shapes (square: MPI Init, trapezoid: MPI Send, turned trapezoid: MPI Recv, turned square: MPI Finalize). The red lines represent the data transfer between MPI ranks, the blue marked dependencies arises from the program order of the MPI
calls within a process. . . 22
4.1 The runtime informs Ayudame about any relevant changes. The events are forwarded to Temanejo. . . 30
4.2 shows examples for task and dependency properties.. . . 32
4.3 C interface of Ayudame . . . 33
4.4 C++ interface of Ayudame . . . 34
4.5 C interface of the Ayudame userdata event. . . 34
4.6 Temanejocontrols the runtime/application viaAyudameby send-ing request. Requests are forwarded to the runtime. . . 35
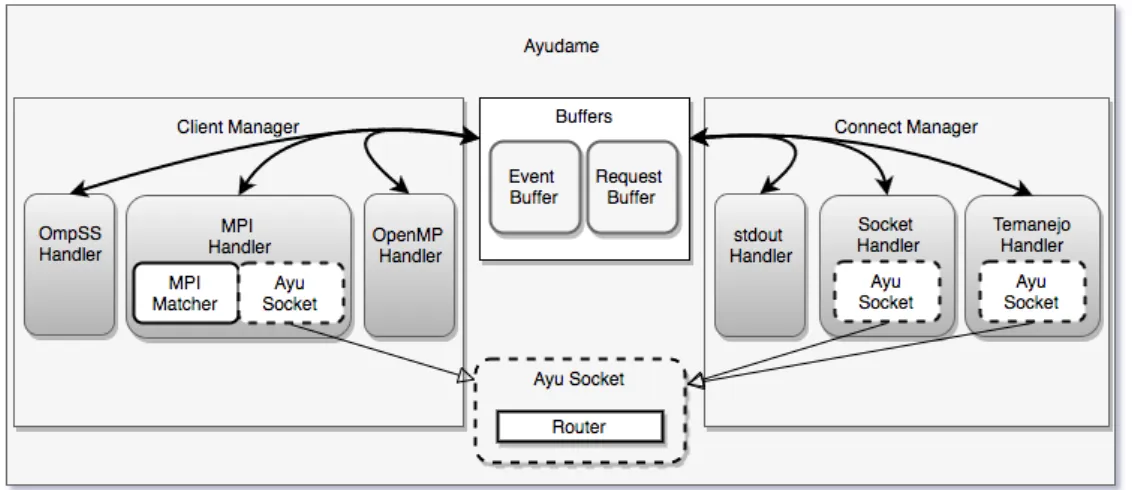
5.1 Modules and their functionality used in Ayudame. The data ex-change inside anAyudameis accomplished by the internal “Buffers”. The inter process data exchange is done by socket communication. . 38
5.2 shows the overall control and request flow inside an Ayudame in-stance. . . 41
5.3 shows an example of attaching Ayudame to a programming model. 41 5.4 shows multiple runtimes (in one process) attached toAyudame. In addition, the possible outputs of Ayudameare also illustrated. . . . 43
5.5 One Process at a node is connected to Temanejo. . . 47
5.6 Multiple Process at a node are connected to Temanejo . . . 48
5.7 Multiple Process at multiple nodes are connected to Temanejo. The communication is spanned up in a “All to one” fashion.. . . 49
5.8 Multiple Process at multiple nodes are connected to Temanejo. The communication is spanned up as a “Communication Tree”, e.g. the messages are routed through Ayudame instances. . . 50
5.9 shows the algorithm spanning up the“Communication Tree”. . . 51
5.10 shows the “Communication Tree” used for multi-process debugging. 51 5.11 The function set master id shifts the master id into the m id, the second function returns the master id out of the m id . . . 53
5.12 The function set proc id shifts the procc id into the m id, the second function returns the procc id out of the m id . . . 53
5.13 The function set client id shifts the client id into the m id, the sec-ond function returns the client id out of the m id . . . 54
6.1 shows the different possibleAyudameinstrumentations. Some pro-gramming models need an InCode instrumentation, others can be accessed through an API. . . 56
List of Figures xiii
6.2 shows the “addEventList” code part, used for instrumenting OmpSs. The function splits the different runtime events into “addTask”,
“addDependency”, etc. . . 57
6.3 shows the “addResumeTask” code part, used for instrumenting OmpSs. The function detects the tasks states and generates an Ayudame event. . . 58
6.4 shows the “addTask” code part, used for instrumenting OmpSs. The function generates anAyudame task creation event. . . 59
6.5 shows the “addDependency” code part, used for instrumenting OmpSs. The function generates anAyudame dependency creation event. . . 60
6.6 Stage one of the OMPT initialization. . . 61
6.7 Stage two of the OMPT initialization. . . 62
6.8 Interaction of Temanejo with a runtime system through TCA . . . 63
6.9 Interaction between the runtime and the tool, through TCA . . . 66
6.10 shows the tca initialize implementation inside the tool. . . 68
6.11 shows the lookup implementation inside the runtime. . . 68
6.12 shows tca initialize process inside the runtime. . . 69
7.1 default code structure . . . 72
7.2 Task colouring and their meaning. . . 74
7.3 Fork/Join code structure.. . . 76
7.4 Fork/Join dependency graph . . . 76
7.5 Fork/Join timeline without compute task differentiation . . . 77
7.6 Fork/Join timeline with compute task differentiation . . . 77
7.7 Comm hiding code structure. . . 78
7.8 Comm hiding dependency graph with differentiation in inner and outer tasks. . . 78
7.9 Comm hiding timeline with normal behaviour. . . 79
7.10 Comm hiding timeline with delay in the MPI communication. . . 79
7.11 Comm overlap timeline with runtime aware MPI task behaviour. . . 81
7.12 Iteration overlap dependency graph. The necessary dependencies are getting complex. . . 82
7.13 Iteration overlap timeline. . . 83
7.14 timeline of combied Iteration overlap and Comm hiding . . . 83
7.15 shows the performance as a function of MPI processes and OmpSs worker threads per node. . . 85
7.16 show the performance comparison of the different LBC versions (strong scaling experiment). These results were generated on the Hazel Hen.. . . 86
7.17 shows the comparison of two OmpSs versions with the pure-MPI implementation of LBC(weak scaling experiment). These results were generated on the Mont-Blanc prototype . . . 87
7.18 shows a weak scaling experiment running on the target systems. . . 88
7.19 sets the MLUPs in relation to the peak performance of the system (Cavium: 345 GFLOPs, XC40: 960 GFLOPs). . . 88
List of Figures xiv
7.20 sets the MLUPs in relation to the measurable memory bandwidth
(Cavium: 70 GBs, XC40: 113 GBs). . . 88
7.21 shows the fraction of peak performance the application reaches on the target platform. . . 89
A.1 Ring . . . 95
A.2 Cross link . . . 95
A.3 Memory bandwidth 4 socket system with 4 cores per socket. In this system no cross link available and therefore a second stage performance drop is measurable . . . 96
A.4 Memory bandwidth 4 socket system with 6 cores per socket. In this system a cross link available and therefore no second stage performance drop is measurable . . . 96
A.5 Non-Uniform Memory Systems @ HLRS . . . 97
A.6 Two socket architecture. Each socket has its own Memory . . . 97
A.7 Interlagos architecture. . . 98
Abbreviations
HPC High Performance Computing
LBC Lattice-Boltzmann Code
MPI Message Parsing Interface
BEST Boltzmann Equation Solver Tool
SIMD Single Instruction, MultipleData
TCA Tasking Control API
OMPT OpenMP Tools Application Programming
PGAS Partitioned Global Address Space
DAG DirectedAcyclic Graph
DAC UnifiedParallel C
NUMA Non-Uniform Memmory Access
UMA Uniform Memmory Access
HBM High Bandwidth Memory
HMC Hybrid Memory Cube
NVM NonVolotileMemory
POSIX PortableOperating System Interface
PGAS Partitioned Global Address Space
GDB The GNU ProjectDebugger
This thesis is dedicated to my parents
and friends
Chapter 1
Introduction
This thesis addresses the problems during the application developing process, es-pecially the issues occurring due to parallelisation. In complex applications, de-bugging tools and supporting frameworks are essential for the high-performance computing (HPC) area. Information out of the parallelisation strategy can be used to give the application developer necessary hints. Temanejo, a task-based debugger, converts this information and supports the developer in his activities. This work is highly motivated by the problems appearing during the parallelisation process of a traditional engineering application. Therefore, this thesis is located as an interdisciplinary field of engineering and informatics (software development).
Chapter Introduction briefly describes the context the work is placed in. The sectionMotivation and Goalissues the increasing complexity of hardware and the resulting software complexity. This technological progress leads to a need for tools supporting computer scientists and engineers. On the one hand, there are state of the art debugging tools. On the other hand, there is a lack of tools trying to include the means out of the parallelisation technique into the debugging process. This lack of tools is targeted by the work presented in my thesis. Therefore, Te-manejo, which is a framework capable of extracting the available programming model specific information, is introduced. Furthermore in this chapter the term
Model-Centric Debugging is defined, by trying to distinguish it from the tradi-tional debugging approach. The Model-Centric Debugging approach is inevitable due to the increasing hardware complexity. The penultimate section Performance
Chapter 1. Introduction 2
Debugging as Case Study gives a brief example for an application optimisation use-case. The thesis outline finalises this chapter.
1.1
Motivation and Goal
In the past decade, the ecosystem complexity of parallel computing has increased massively. Coming from single core architectures, the system design has evolved dramatically. The present-day’s computer systems are usually multi-core based. The cores in these multi-core systems are located in disjointed physical processors (central processing unit/CPU). Therefore, technologies like non-uniform memory access, hyper threading, caching and much more, are necessary to operate these systems efficiently. The systems used in high-performance computing today, scale up to thousands of nodes comprising millions of independent cores.
System Cores Nodes
Sunway TaihuLight 10.649.600 40.960 Tianhe-2 (MilkyWay-2) 3.120.000 16.000 Titan - Cray XK7 560.640 18.688 Hazel Hen - Cray XC40 185,088 7712
Figure 1.1: HPC systems placed in the TOP500 (November 2016) including
their node and core number.
The table in Figure 1.1 shows the first three systems on the TOP500[1] list in November 2016. Also listed is the supercomputer Hazel Hen located in Stuttgart. The huge amount of nodes and cores has the need for a well-designed network infrastructure, e.g. network bottlenecks. The most important factors which limit the enlargement of these systems to exascale are cooling and immense power con-sumption. The work of my thesis is integrated into the hard-and software ecosys-tem, by introducing several abstraction layers. On the hardware side, there are technology concepts like 1)non-uniform memory access, 2)memory layers, 3) dis-tributed memory and 4) heterogeneous systems. The detailed information about the listed technologies can be found in Appendix A. On the software side, the hardware trend caused an evolving software environment. This includes different
parallel programming concepts and their parallelization strategies for shared and distributed memory (Chapter2.1) systems. Theseconcepts (programming models
chapter1.2) attempt to simplify the application development process, by giving the user a framework for application parallelisation. The outcome are highly complex
Chapter 1. Introduction 3
applications, which use different programming models and techniques to achieve the best performance on a given hardware. The application complexity is hidden from the application developer by the programming model. Developing and espe-cially debugging such an application requires fundamental knowledge about hard-and software. Therefore, tools have to be designed hard-and developed to support the application developer, by simplifying the development or debugging process.
The objective of this thesis was to design a debugging tool for task-based pro-gramming models. The tool has to be capable of extracting and processing pro-gramming model relevant information and assist the application developer in his actions. During the execution of a parallel application, the most pertinent infor-mation, supporting the developer, is generated by the programming model itself. This information can be extracted by a debugging tool and could be visualised in a programming model specific language. Due to the specific environment in HPC systems, the debugging tool has to deal withHybrid Programming Models (Chap-ter 2.6), which are normally realised using shared and distributed programming models simultaneously. Therefore, the attention of the presented work is paid to the design of the debugging tool’s back-end. The quality of the designed tool is evaluated by the performance improvement of a given application; e.g. Case Study: Performance Debugging (Chapter 7).
1.2
Programming Model
This chapter briefly introduces the termprogramming model. In the chapter Tech-nical Background: Parallel Programming Models & Tools(Chapter2) the parallel programming models used in the scope of my thesis are described in detail. Addi-tionally, chapter 2 classifies the different models and gives examples for the most common ones.
In the literature, there are a few clear definitions for programming model, but one is done by Skillicorn and Talia ’98:
Models that abstract from parallelism completely. Such models de-scribe only the purpose of a program and not how it is to achieve this Parallel Computation 135 ACM Computing Surveys, Vol. 30, No. 2, June 1998 purpose. Software developers do not even need to know
Chapter 1. Introduction 4
Figure 1.2: shows different abstraction layers. The level of understanding is
placed between theUser and theProgramming Model.
if the program they build will execute in parallel. Such models are necessarily abstract and relatively simple, since programs need be no more complex than sequential ones. [2]
A programming model is a model of an abstract machine, which provides certain operations to the programming 1) level above and requires for each of these oper-ations an implementation on all 2) architectures below. As previously mentioned, the increasing complexity in hardware results in a growing complexity of the soft-ware used for programming these systems. Programming models try to hide the hardware architectures from the application developer. Therefore, they introduce an abstraction layer called level of understanding, shown in Figure 1.2, between the hardware and the application developer.
1) In Figure1.2, thelevel above is represented by thelevel of understanding and is used by the application developer. Thislevel of understanding is used for parallelis-ing an application. The parallelisparallelis-ing technique can be API-based calls like MPI: Message Passing Interface (Chapter 2.5) or pragma-based like OpenMP: Open Multi-Processing (Chapter 2.2).
2) Thearchitecture below is represented by the low-level software layer, e.g. POSIX threads (PThreads [3]). For MPI, this low-level software layer could be a specific network architecture.
OpenMP and OmpSs: OpenMP SuperScalar (Chapter 2.3), for example, use the low-level Software PThreads to enable multithreading support in applications.
Chapter 1. Introduction 5
MPI is used for data exchange between different processes or nodes, hiding the communication structure (InfiniBand, extol, ethernet, Cray XC40 aries).
1.3
Traditional versus Model-Centric Debugging
Debugging is a significant part of any software development process. However, what does debugger or debugging mean? Most practical definitions of debugging would probably include the following three aspects: 1) the ability to control the program execution, in particular, the ability to suspend and resume the program execution, 2) the possibility to inspect the program state e.g. print a variable’s current value and 3) optional, the potential to change the program’s state, e.g. set a variable’s value or set the point where the execution will be resumed. The traditional debugging process is specific for a programming language. In contrast, the Model-Centric[4]approach is specific for a programming model. For instance, pydb is a debugger for Python, while GDB is a debugger for C (C++, Fortran, etc.). All these debuggers are reasoning about the application at the lowest level, which is accessible by the programming language. In case of a single threaded C application, a debugger is reasoning at instruction level or statement level (static variable, pointers, function). The value of every single variable or pointer can be accessed, and the whole debugging process is related to the behaviour und execution on the hardware level. In case of a shared or distributed environment, the debugger has to reason across different thread or process states. In such a multi-threaded environment every PThread can have locally allocated variables, but can also access memory areas simultaneously with other threads. In a multi-threaded environment the application developer has often to deal with concurrency and their undefined side effects.Starting a debugging process, the application developer has to switch from his high-level programming model abstraction layer to the low-level software layer or even to the hardware layer below, which is used in the traditional debug-ging process. In Figure 1.3 the ”level of understanding” is added between the low-level software layer and the tools, presenting traditional debuggers like To-talView (Chapter 3.2.2), DTT (Chapter 3.2.1) or GDB. At the low-level software or the hardware layer the application developer has to care about: instruction breakpoints, memory watchpoints, event catch points, step-by-step (function, line or instruction granularity) execution and memory or processor inspection. All
Chapter 1. Introduction 6
Figure 1.3: shows the different abstraction layers, in addition the Tools are
placed at the same abstraction level as thelow-level Software.
these traditional techniques are not taking the overall programming model related information into account. Debuggers, such as GDB, still perceive an OpenMP application as a collection of low-level threads but without any further semantics.
Other debuggers, in particular, those used in HPC such as DDT and Totalview, have some awareness of the parallel programming model and allow for instance to step all threads in a parallel region at the same time. However, Temanejo (Chapter 2.7), including its back-end Ayudame (Chapter 5), follows a strong Model-Centric approach and abstracts the application regarding a task dependency graph, i.e. a directed acyclic graph consisting of tasks and data-dependencies as node and edges respectively. The user may inspect task inputs and outputs or con-trol the runtime system to step through the application task-wise or even modify task dependencies. Temanejo uses for visualisation the same abstraction level and vocabulary as during application development. This kind of debugging or ap-plication development (Model-Centric approach) is a supplement to the traditional debugging process and is using the programming model specific representation.
Today, however, the programming language is just a small part of the program-mer’s development environment: an application developer relies on third-party libraries, frameworks or whole programming models. In the ideal case, debuggers are aware of the development environment as a whole and operate on suitable
abstraction layers, use the appropriate vocabulary, and interact with the runtime system. This debugging process is called Model-Centricdebugging and is opposed
Chapter 1. Introduction 7
Figure 1.4: shows the different abstraction layers, including theModel-Centric
Debugging approach (located at the same abstraction level as theProgramming Model).
to the traditional debugging process. The application developers’ mental represen-tation differs from the actual execution on the underlying hardware. In Figure1.4
the Model-Centric Debugging cloud is placed at the same abstraction layer as the programming model is located.
The objective of my thesis was to provide the application developers with means for better understanding the state and behaviour of their high-level applications and let them control the application execution from a Model-Centric perspective. The enhancement of the hardware and the used software and programming model also needs a strengthening of tools, e.g. including semantic information into the debugging process.
1.4
Model-Centric Debugging for Task-Based
Pro-gramming Models
Integrating theprogramming model concepts into the debugging process gives the programmer additional information and hints of the overall application execution. This extracted information could be a specific task, a function execution, a par-allel loop region/iteration, relationships between entities, code blocks or the data transfer between two nodes. Monitoring their different states gives a detailed view
Chapter 1. Introduction 8
of the actual application execution, e.g. which tasks are executed, is the scheduling algorithm (longest path, depths first) working correctly? etc. It is also possible to interact with the application during execution and influence the application execution behaviour, e.g. blocking of specific tasks or step-by-step (task-by-task) execution.
Model-Centric Debugging allows illustrating communication between tasks for syn-chronous and asynsyn-chronous communication and their different communication pat-terns one-to-one, one-to-many, many-to-one and many-to-many. This allows to detect deadlocks and bottlenecks in task-based programming models and message-passing models. Most of these programming models rely on a non-static program-ming model. That means, the execution of tasks is not necessarily always in the same order, but through relationships between tasks, the result remains the same. Interacting and monitoring dynamic application behaviour, depending on the used
programming model, is challenging and needs a structured concept. In most cases, the high-level programming model concept can be mapped into a graph structure, representing the application execution. Drawing such a graph illustrates the nat-ural execution order or behaviour of a given application and gives the application developer a general view of the application execution.
1.5
Performance Relevance for Model-Centric
De-bugging
Looking at application performance as a functional debugging requirement, Model-Centric Debugging means to check, verify and debug the correctness of an appli-cation and additionally to analyse performance relevant issues. It is possible, that the programming model serialises the application execution, but however the ap-plication produces correct results. Not exploiting today’s multi-core or multi-node systems, can also be seen as a bug in the application execution. The necessary in-formation for finding bottlenecks and performance relevant issues can be extracted and illustrated in a dependency graph. This technique is used in the visualisation framework Temanejo (Chapter 2.7). The task placement and its memory access pattern are influencing the application performance. It is more efficient to execute tasks on cores located close to each other, because these cores are sharing the same cache or memory. The necessary tasks data should be placed as close as possible
Chapter 1. Introduction 9
to the thread executing the task. Temanejo is capable visualising the mapping of tasks to the cores, the tasks are executed on. It is also possible to analyse the mapping of task to the corresponding NUMA domain.
Model-Centric Debugging comes to a point where not only the process of find-ing and resolvfind-ing bugs or detectfind-ing incorrect operations, in traditional debuggfind-ing techniques, but also the correct usage of the programming model has to be taken into account. The correct usage includes the accordance of the dependency graph, the application developer has in mind, with the dependency graph generated by the programming model, but also the correctness in case of locality and other performance-relevant facts.
The gathered information allows the user to access theprogramming model internal representation. This concept extends the debugging process not only with semantic information but also with sources of error, having a performance relevant aspect. This can, for example, be the width of a given graph representing the parallelism of the application. Some possible examples solving these questionings are 1) Are there too few tasks for a 24 core system? Does the application reach the maximum parallelism? 2) How many cores are necessary to get the maximum performance in case of parallelism out of the application? 3) Are there bottlenecks inside the MPI communication? Is MPI communication serialised? 3) Are tasks placed on a wrong NUMA domain and is, therefore, data locality not given? Most of these problems can be visualised in a graph-based format, which is the most suitable representation for the user.
1.6
Performance Debugging as Case Study
For any application using multipleprogramming modelsto express the best-optimised parallelisation, the underlying dependency graph gets extremely complex. In chap-ter Case Study: Performance Debugging(Chapter 7) the complete task-based op-timisation workflow is shown with all intermediate steps. However, even there, the sequence and dependency diagrams have to be replaced with mock-ups. This section only explains the workflow on a fictive, well-optimised problem, which can be used as a concept for a future application developing process. The same tech-niques and domain decomposition have been applied to the application explained in chapter7. For simplification, the concept is only explained in a two-dimensional
Chapter 1. Introduction 10
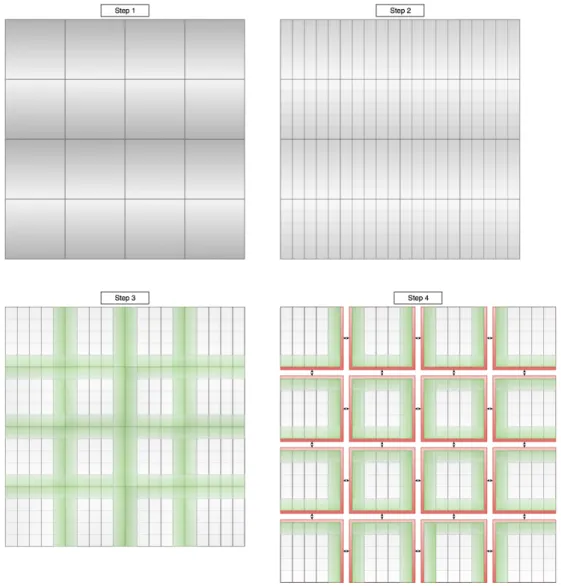
Figure 1.5: shows a two level domain decomposition. The coarse grained
decomposition can be used for distributed memory programming models and the fine grained decomposition can be used for taskification.
domain. The following example is based on an arbitrary stencil code, which re-quires values for next-neighbours only. The value introduced into the domain at a given spot, diffuses over time through the domain. Solving such a problem in a hybrid application approach using MPI and a task-based programming model
(OmpSs) has serval design, implementation and parallelisation steps.
Figure1.5Step 1: Divide the domain into a subdomain for each MPI process. Figure1.5 Step 2: Divide the subdomain into tasks for OpenMP/Ompss. Figure1.5Step 3: Split the tasks into tasks needed for communication(green)
Chapter 1. Introduction 11
Figure 1.6: shows a domain decomposition with marked neighbour tasks. For
example: The blue task(4,3) has its neighbours marked in light blue(tasks: (3,3), (5,3), (4,2), (4,4)).
Figure 1.5 Step 4: Generate one task (red) per process handling the MPI communication with all neighbouring domains. This task can be executed as soon as all communication relevant tasks (green) of the same iteration have been finished.
Implementing these steps and defining the correct dependencies between the tasks will allow the runtime to schedule tasks in an efficient way. Using this technique and giving the runtime the hint of prioritising the execution of the green and red tasks automatically overlaps computation and communication. With double buffering or multi-buffering (keeping several copies of the domain, one for every iteration) it is also possible to overlap multiple iterations. In the example the domain is only divided into inner and outer tasks, this separation can also be seen as a coarse-grained stencil. A finer-grained definition of the stencil is also possible. Therefore the dependencies for every task can be built up only on the relevant neighbouring tasks. This leads to a complex dependency graph expressing the real data dependencies. Figure 1.6 shows a simple example of a fine-grained stencil. Task (4,3) for example depends on the previous execution iteration (iteration n-1) of the task (4,3) itself and the neighbour tasks ((3,3), (5,3), (4,2), (4,4)). Every green task also depends on the MPI communication task (red) of the previous iteration.
Even without this overlapping of multiple iterations and without fine-grained sten-cils the generated dependency graph is getting huge and complex. Without any tool supporting the application developer in the design, implementation, and par-allelisation workflow it is a difficult job.
Chapter 1. Introduction 12
1.7
Outline of the Thesis
Concluding this chapter, I briefly summarise: The thesis addresses the lack of in-formation flow between theprogramming model (Chapter Technical Background: Parallel Programming Models & Tools) and the application developer. The work shown in my thesis tackles this gap by providing a tool for Model-Centric De-bugging. The infrastructure is implemented in the in Ayudame & Temanejo toolchain. Chapter Design: Events & Requests in Ayudame contains the de-sign of events and requests, which are necessary for monitoring and controlling a runtime, respectively. The design and the issues during the tool development are present in the chapter Design: Communication Back-end Ayudame. The
interface between theprogramming model and Ayudameis discussed in the chap-ter Instrumentation of Runtime Systems. Chapter Case Study: Performance De-bugging demonstrates the tool usage at an application parallelisation process and gives, also, a performance evaluation of different optimised versions.
Chapter 2
Technical Background: Parallel
Programming Models & Tools
This chapter gives a brief overview of today’s parallel programming models used in high-performance computing (HPC). In addition, the chapter contains a sec-tion aboutTemanejo the front-end of the designed toolchain. The programming
models are classified into shared and distributed memory programming models (Chapter 2.1). The most commonly used programming models are MPI for dis-tributed applications and OpenMP for shared memory applications. Besides these two traditional models, there is a growing trend and usage of different paralleliza-tion concepts. The programming models named in the listing of Figure 2.1 are commonly used in today’s HPC and engineering applications and separated into shared and distributed programming models. Therefore, I selected them as the foundation for the evaluation and design process. In the sections below there are three examples for shared memory programming models (OpenMP chapter 2.2, the StarSs family Chapter 2.3and StarPU chapter 2.4). The chapter 2.5 Message Passing Interface (MPI) includes an example of a distributed memory program-ming model.
2.1
Programming Model Overview
In today’s computer architecture there is a differentiation between shared and dis-tributed memory systems and their respective programming models. In disdis-tributed memory systems, each process has its private memory and can only operate on
Chapter 2. Technical Background: Parallel Programming Models & Tools 14
its local data. Multiple processes communicate and exchange data through some kind of network or process interconnect. In shared memory systems, all threads share the same memory, and they have to care about concurrent data access and race conditions. A shared memory application can be seen as a single process ap-plication. As soon as the application uses more than one process, the application uses a distributed memory architecture. The processes in a distributed memory could be placed on the same node, but the operation system separates the virtual memory. The shared memory concept can be extended across the process border; a framework (PGAS) is handling the data transfer between processes or nodes. This results in an easy to use unified memory space for the application developers.
Shared Memory
– OpenMP [5] [6]
– StarSs family (OmpSs, SmpSs) [7] [8] [9] [10]
– StarPU [11] [12] [13]
– fastflow [14]
– Cilk
– Threading Building Blocks
– CUDA
Distributed Memory
– Message Passing Interface (MPI)
– Partitioned Global Address Space (PGAS)
* Global Address Space Programming Interface (GASPI) * Dash
Figure 2.1: shows the most relevant programming models for HPC
Traditionally shared memory programming models are used for on node level par-allelisation. Distributed memory models are used for the interconnection between different nodes.
2.2
OpenMP: Open Multi-Processing
In high-performance computing, the standard programming model for shared-memory systems is OpenMP[5, 6]. Until recently, the programming model was
Chapter 2. Technical Background: Parallel Programming Models & Tools 15
1 #pragma omp p a r a l l e l f o r 2 f o r ( i = 0 ; i < N ; i ++) { 3 a [ i ]= 2 * i ;
4 }
Figure 2.2: shows a listing of an “OpenMP parallel for” example. Every
iteration can be executed by a different thread independently.
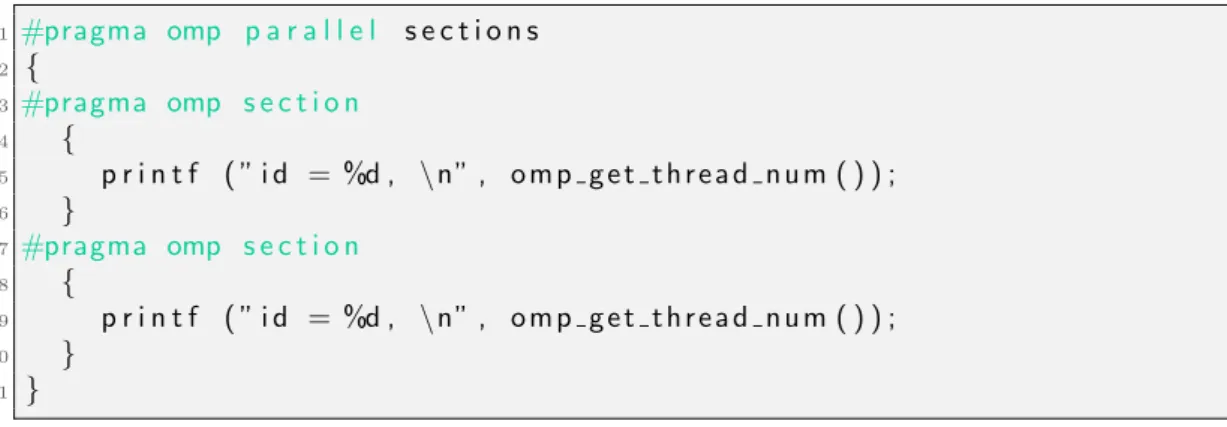
1 #pragma omp p a r a l l e l s e c t i o n s 2 { 3 #pragma omp s e c t i o n 4 { 5 p r i n t f ( ” i d = %d , \n ” , o m p g e t t h r e a d n u m ( ) ) ; 6 } 7 #pragma omp s e c t i o n 8 { 9 p r i n t f ( ” i d = %d , \n ” , o m p g e t t h r e a d n u m ( ) ) ; 10 } 11 }
Figure 2.3: shows a listing of an “OpenMP section” example. Every section
can be executed by a different thread.
1 i n t x , y , z , k ; 2 #pragma omp t a s k d e p e n d ( i n : x ) d e p e n d ( o u t : y ) 3 f o o ( x , y ) ; 4 #pragma omp t a s k d e p e n d ( i n : z ) d e p e n d ( o u t : k ) 5 f o o ( z , k ) ; 6 #pragma omp t a s k d e p e n d ( i n : y ) d e p e n d ( i n : k ) 7 b a r ( y , k ) ; 8 #pragma omp t a s k w a i t
Figure 2.4: shows a listing of an “OpenMP task” example. Both foo tasks
can be executed in parallel. The bar task depends on the foo tasks.
a relatively simple flavour of the fork-join model: independent tasks were grouped in so-called parallel regions. All tasks within a region could be executed concur-rently on OpenMP threads, while different regions were synchronised according to the program order. In fact, the term task did not play a major role in the OpenMP specification. Starting with version 3.0, however, concepts such as explicit and un-tied task, data-dependency between asynchronous tasks, and execution target for offloading of tasks have successively enriched the OpenMP programming model. With all these changes and the widely usage also the need for an OpenMP Tools Application Programming (OMPT 6.2.2) came along.
OpenMP is a pragma-based shared memory programming model for C/C++ and Fortran. The parallel programming model has various parallelisation approaches
Chapter 2. Technical Background: Parallel Programming Models & Tools 16
1) level parallelism, 2) parallel sections and 3) task parallelism. The loop-level (listing in Figure 2.2) approach is often called fine-grained parallelism. This technique parallelises individual loops. Each thread is working on a unique range of loop indexes. The second approach (listing in Figure 2.3) is often used for coarse-grained parallelisation: a code sections can be parallelised, not just individual loops. OpenMP 3.0 introduces the concept of tasks; e.g. a task is a self-contained unit of work. With the OpenMP 4.0 standard, tasks also can have dependencies between each other (listing in Figure 2.4), this concept is heading in the direction of the SmpSs family.
In the first and second approaches, the application developer has to care about the synchronisation between the different parallel regions. Additionally, the data used in each region can be declared asshared orprivate. Depending on this declaration the data is copied in (private) or used as a reference (shared), meaning other threads can access the data at the same time. If the data is declared as shared, the application developer has to care about race conditions and may have to access the variables in an atomic way. In the third approach, the synchronisation between tasks is given through the dependency graph. The data scoping between tasks is by default shared, and the access to the parameter is regulated through the dependency graph. Two tasks, both having the same parameter as input dependency, are not allowed to run in parallel. The one instantiated first, will be executed first. The task and dependency concept in OpenMP is similar to the OmpSs dependency concept and explained in chapter 2.3.
2.3
OmpSs: OpenMP SuperScalar
OmpSs, belongs to the StarSs family and is developed at BSC in Barcelona. In the StarSs family (but also in OpenMP), the programmer needs to identify suitable units of work. In general these are functions designated as tasks. This is identi-fication, done through pragma-based code annotations. In addition to OpenMP the programming model has a stronger concept of tasks and dependencies. In con-trast to OpenMP, the StarSs programming model infers the synchronisation from the data dependencies in the program. In an OpenMP or PThread application the synchronisation has to be specified by the programmer explicitly. Dependen-cies between tasks are generated automatically from the pragma directives, given by the user, to distinguish between input, output and input-output arguments.
Chapter 2. Technical Background: Parallel Programming Models & Tools 17
Tracking the memory addresses of these task parameters allows the programming model to synchronise data dependencies. At runtime, this information is used to generate a dynamic task dependency graph. In the simplest case, tasks are exe-cuted sequentially in the same order as they have been added to the graph. This is equal to a serial code execution. In most cases, the task graph can expose concur-rency and independent tasks or tasks with fulfilled dependencies can be executed in parallel on the available compute cores. The data dependencies ensure that no task is scheduled before any tasks that modifies the task’s input parameters has finished its execution.
1 i n t main ( ) 2 { 3 s i z e t SIZE =8; 4 d o u b l e *a1 = new d o u b l e [ SIZE ] ; 5 d o u b l e *a2 = new d o u b l e [ SIZE ] ; 6 7 #pragma omp t a s k o u t ( a1 , a2 ) l a b e l ( f i l l ) 8 f i l l ( a1 , a2 , SIZE ) ;
9 #pragma omp t a s k i n o u t ( a1 ) l a b e l ( add )
10 add ( a1 , 1 3 , SIZE ) ;
11#pragma omp t a s k i n o u t ( a2 ) l a b e l ( add )
12 add ( a2 , 5 , SIZE ) ;
13#pragma omp t a s k i n o u t ( a1 ) l a b e l ( m u l t i p l y ) 14 m u l t i p l y ( a1 , 3 , SIZE ) ;
15#pragma omp t a s k i n o u t ( a2 ) l a b e l ( m u l t i p l y ) 16 m u l t i p l y ( a2 , 7 , SIZE ) ;
17#pragma omp t a s k i n o u t ( a1 , a2 ) l a b e l ( add )
18 add ( a1 , a2 , SIZE ) ;
19#pragma omp t a s k i n ( a1 ) l a b e l ( dump ) 20 dump ( a1 , SIZE ) ; 21 22#pragma omp t a s k w a i t 23 f r e e ( a1 ) ; 24 f r e e ( a2 ) ; 25 }
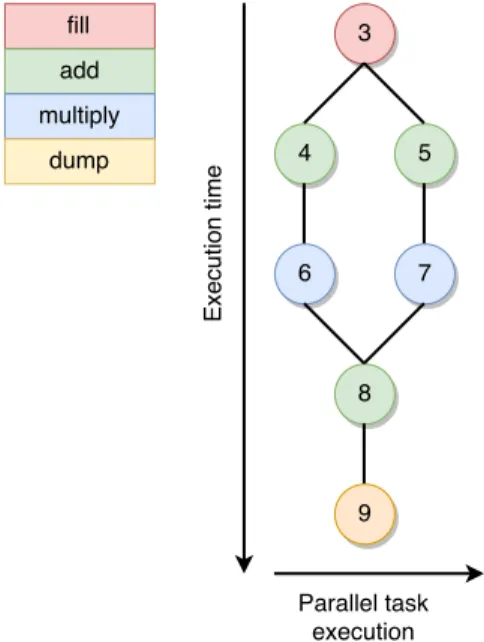
Figure 2.5: shows a listing of an “OmpSs task” example including
depen-dencies between the tasks. According to the dependepen-dencies the tasks can be executed.
The example (listing in Figure 2.5) shows the above-explained code concept, and Figure2.6 shows the associated dependency graph. The dependency graph shown was generated by using Ayudame & Temanejo.
In the line four and five in the listing of Figure2.5, two arrays get allocated. These arrays are filled inside the fill function. This task exhibits as output dependency
Chapter 2. Technical Background: Parallel Programming Models & Tools 18
Figure 2.6: shows the task-dependency graph of the listing in Figure 2.5.
According to the dependencies the tasks 4,5 and 6,7 can be executed in parallel.
a1 and a2. Each of these arguments is used at the add function as inout depen-dency. This allows both add functions being executed independently from each other. Because the add function is using a1 or a2 as an inout dependency, the following multiply function can only be performed after the previousadd function
in the dependency graph has been finished. The thirdadd function consumes both dependencies a1 and a2, which were produced by the multiply functions. The last function inside the dependency graph consumes the inout dependency from the third add function. Before freeing the memory, the application needs to wait for all tasks to be finished; this is related to the synchronisation between tasks and the master thread accessing memory, which is touched inside a task.
This programming model allows writing code without any explicit synchronisation. Synchronisation is only needed if the master thread is touching memory which is used inside a task; e.g synchronisation is only necessary between the sequential code and code executed inside tasks, but not between tasks. This behaviour can be avoided by taskifiying all relevant parts of the application.
The StarSs programming model has several advantages compared to other shared memory programming models, which either use parallel loops, static dependen-cies or explicit synchronisation. A dynamic scheduling process allows an efficient parallelisation, even for different input data sets. With a bunch of tasks and au-tomatic load balancing inside the application, such a concept helps to overcome scalability problems.
Chapter 2. Technical Background: Parallel Programming Models & Tools 19
Some key features give the developer high flexibility:
The programming models takes care of synchronisation between tasks; the synchronisation is given through the task-dependency graph.
The whole process is a dynamic process. It allows efficient parallelisation even for different input data sets. Every execution has its dynamically gen-erated graph.
As the entire process is dynamic, the application can easily handle load imbalances and adapt its execution.
Taskifying MPI communication allows the overlapping of communication and computation in a more simple and efficient way than a hand-written code, which uses non-blocking MPI communications. Furthermore, the runtime can be aware or can detect whether the MPI communication has finished, before rescheduling the task.
2.4
StarPU
The StarPU programming model was developed by the French national research institute INRIA. The StarPU programming model is a task-based library for hybrid architectures. The concept is similar to the OmpSs concept, and they also have an OpenMP 4 compatibility interface. StarPU uses a combination of pragma-based annotation and library calls. A task has to be declared with attribute ((task)).
The key features of the StarPU programming model are: 1) Portability 2) Depen-dencies; Dependencies provide the programmer with a flexible way of programming and designing applications. 3) Heterogeneous Scheduling; Clusters migrate tasks to different nodes. The communication is done through MPI and the communica-tion is automatically combined and overlapped with the intra-node data transfer and the task execution. 4) Out of Order execution 5) Extension to the C lan-guage with an OpenMP 4 compatible interface. The listing in Figure 2.7 shows an StarPU example published in the “StarPU Handbook” [15]. In line 16 the StarPu runtime is initialised. After this a task is asynchronously executed. Before the runtime is shutting down (line 22) the application has to wait for all tasks to finish (line 20).
Chapter 2. Technical Background: Parallel Programming Models & Tools 20 1 // h t t p : / / s t a r p u . g f o r g e . i n r i a . f r / doc / s t a r p u . p d f 2 // C h a p t e r 3 3 // B a s i c E x a m p l e s 4 #i n c l u d e <s t d i o . h> 5 6 // Task d e c l a r a t i o n . 7 s t a t i c v o i d m y t a s k (i n t x ) a t t r i b u t e ( (t a s k) ) ; 8 9 // D e f i n i t i o n o f t h e CPU i m p l e m e n t a t i o n o f ” m y t a s k ” . 10 s t a t i c v o i d m y t a s k (i n t x ){ 11 p r i n t f ( ” H e l l o , w o r l d ! With x = %d\n ” , x ) ; 12 } 13 14 i n t main ( ){ 15 // I n i t i a l i z e StarPU . 16#pragma s t a r p u i n i t i a l i z e 17 // Do an a s y n c h r o n o u s c a l l t o ” m y t a s k ” . 18 m y t a s k ( 4 2 ) ; 19 // Wait f o r t h e c a l l t o c o m p l e t e . 20#pragma s t a r p u w a i t 21 // T e r m i n a t e . 22#pragma s t a r p u s h u t d o w n 23 r e t u r n 0 ; 24 } 25 26 }
Figure 2.7: shows a listing of an StarPU example code.
2.5
MPI: Message Passing Interface
The Message Passing Interface (MPI) is a standard, which describes the data exchange between nodes in a parallel distributed memory application. The API defines different communication and exchange patterns, which are necessary for sharing information inside a distributed application. Normally an MPI application consists of multiple processes which communicate with each other. Usually, these communication patterns can be classified into 1) one-to-one, 2) one-to-many, 3)
many-to-one and 4) many-to-many.
1) One-to-one is used, for example, to exchange ghost cell information between neighbours (MPI Send,MPI Recv). 2) One-to-many can be used, for example, to transfer a global or local density, calculated by one process, to all or a bunch of other MPI ranks (MPI Scatter,MPI Bcast) 3)Many-to-one operation can be seen as a reduction. One process has to calculate the global or local density. Therefore the process needs the density of all or a bunch of processes (MPI Gather). 4) The last communication pattern is themany-to-manyoperation. In this operation each process is sending and receiving values from all other processes (MPI Alltoall).
Chapter 2. Technical Background: Parallel Programming Models & Tools 21
The one-to-one communications are also known as point-to-point communication; the other three (one-to-many, many-to-one, many-to-many) communication pat-terns are namedcollective communication. In addition there is theMPI one-sided
operation, which was introduce in the MPI-2 standard. The MPI one-sided oper-ations can directly access remote memory. (MPI Put, MPI Get).
The implementation of this standard is done by different vendors (OpenMPI, MPICH, Cray-MPICH) and is adapted to their underlying network (InfiniBand, Ethernet, Cray-Aries). The MPI standard is giving a defined interface abstracting the communication from the application developer.
1 #i n c l u d e <mpi . h> 2 #i n c l u d e <s t d i o . h> 3 #i n c l u d e <s t d l i b . h> 4 5 i n t main (i n t a r g c , c h a r** a r g v ) { 6 i n t r a n k , s i z e , t o k e n ; 7 8 M P I I n i t (& a r g c , &a r g v ) ;
9 MPI Comm rank (MPI COMM WORLD, &w o r l d r a n k ) ; 10 MPI Comm size (MPI COMM WORLD, & s i z e ) ;
11
12 i f ( w o r l d r a n k != 0 ){
13 MPI Recv (& t o k e n , 1 , MPI INT , w o r l d r a n k − 1 , 0 , MPI COMM WORLD,
14 MPI STATUS IGNORE ) ;
15 }e l s e{
16 t o k e n = −1;
17 }
18 MPI Send(& t o k e n , 1 , MPI INT , ( w o r l d r a n k + 1)% s i z e , 0 ,
19 MPI COMM WORLD ) ;
20 i f ( w o r l d r a n k == 0 ){
21 MPI Recv (& t o k e n , 1 , MPI INT , s i z e − 1 , 0 , MPI COMM WORLD,
22 MPI STATUS IGNORE ) ;
23 }
24 M P I F i n a l i z e ( ) ; 25 }
Figure 2.8: shows a listing of an MPI ring example.
In course of my thesis, MPI is handled as a task-based programming model. All the patterns described above can be composed of simple send-recv events. For example, in case of a broadcast, one node is executing a send to every other node. Accordingly all other nodes are receiving this message. Looking at thesesends and
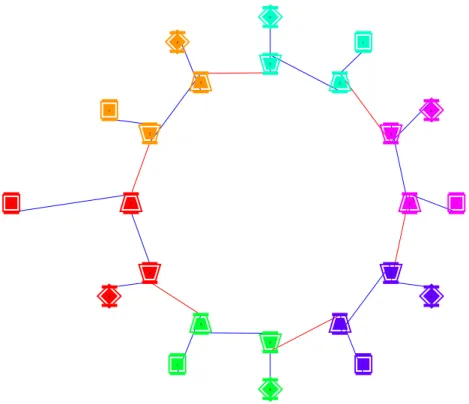
receivesin a task based-view, a visualisation framework (Temanejo) can generate a dependency graph out of the extracted information. The dependencies between the nodes in the dependency graph are the data transfers between the different MPI ranks. Figure2.9shows an MPI ring application (listing of Figure2.8), which
Chapter 2. Technical Background: Parallel Programming Models & Tools 22 0 1 2 3 1 0 1 0 1 2 0 1 0 0 4 1 2 3 4 3 2 4 2 3 3 4 3 4 2 4
Figure 2.9: displays a MPI ring application. The dependency graph is
gen-erated with Temanejo. Each colour in the dependency graph represents a different MPI rank. The different MPI operations are represented with different shapes (square: MPI Init, trapezoid: MPI Send, turned trapezoid: MPI Recv, turned square: MPI Finalize). The red lines represent the data transfer be-tween MPI ranks, the blue marked dependencies arises from the program order
of the MPI calls within a process.
usesTemanejofor visualisation. Each colour in the dependency graph represents a different MPI rank. The shapes represents theMPI Init, MPI Send, MPI Recv, and MPI Finalize, respectively. The red lines represent the data transfer between two MPI ranks. The data transfer dependency is generated between theMPI Send
and MPI Recv. At this point, the real data transfer is happening. In addition, there are blue marked dependencies between the MPI calls on each rank; these dependencies arise from the sequential MPI call order. The order of the appear-ance of the MPI operation inside the application, e.g. MPI Init → MPI Recv → MPI Send → MPI Finalize. Rank 0 (coloured orange) in the ring example calls first MPI Send and then MPI Recv.
Chapter 2. Technical Background: Parallel Programming Models & Tools 23
2.6
Hybrid Programming Models
In today’s high-performance compution applications, MPI is widely used and could also be seen as a standard. Actually, MPI is a distributed memory parallelisation scheme, but it is also commonly used on shared memory systems, as for exam-ple today’s multi-core CPUs. On such multi-core systems, the usage of a shared memory parallelisation schemes as for instance OpenMP can lead to a more ef-ficient utilisation of the hardware. In particular, the communication overhead is reduced, and computation and communication can be overlapped. The successful usage of hybrid parallelisation models, consisting of a distributed memory part (communication through messages between the nodes) and a shared memory part exploiting all available cores on a node, has been shown. Nevertheless, most ap-plications are still based on pure MPI implementations and are not benefitting from a second parallelisation scheme. The classic MPI approach is challenged by today’s prevalence of multicore and many-core systems. Usually pure MPI applica-tions can’t efficiently scale with the increasing amount of cores and nodes. Hybrid applications, however, only have to scale with the number of nodes. Assuming the MPI-scalability is caused by the growing amount of MPI-ranks, the applica-tion developer has the opportunity by annotating his applicaapplica-tion with pragmas to go hybrid. Going hybrid means, in general, to redesign and rewrite parts of the application. For some well-structured applications, having a second domain decomposition besides the MPI domain decomposition, dividing the subdomain of each MPI-rank into smaller work packages pragmas can be used to enable shared memory parallelisation.
The scaling effect mostly happens for strong scaling experiments, due to changing the ratio between computation and communication. The domain stays the same but is decomposed into several sub domains, one for every MPI process. The amount of computation for every process decreases, but the total amount of needed MPI communication increases.
2.7
Temanejo
Temanejo is a graphical debugger for task-based programming models. Strictly speaking,Temanejois the front-end of the debugger. It is drawing and analysing
Chapter 2. Technical Background: Parallel Programming Models & Tools 24
the dependency graph and handles user’s interactions. Temanejo is connected to its back-end library Ayudame by socket communication.
Temanejois written in Python, using QT as graphical user interface. The socket communication and the marshalling unmarshaling library is written in C++ and swigged (Swig [16]) into Temanejo and was formerly developed for Ayudame. The same library is used for inter-node inter-process communication. Marshalling means to transform an object or structured data into an easily transportable for-mat. The counterpart is unmarshaling rebuilding the object or structured data out of the format used for transportation. Every object has the capability to transform itself into a byte stream/sequence. Furthermore, every object can be constructed out of a correctly structured byte stream. These objects can either be events or requests. In practice, the objects are transformed into an XML-based format and back into objects.
Chapter 3
Related Work
3.1
Ayudame
Referring toAyudamein my thesis I always meanAyudame 2.0. Ayudame 1.0 [17] [18] [19] is not developed by me and is, therefore, part of the related work. The concept used in both libraries is the same. They are both gathering and ex-changing information between a programming model and Temanejo. But that is almost everything they have in common. With the design and implementation of Ayudame 2.0, there was also the need for a new design and implementation of Temanejo (called Temanjeo 2.0). Coming from a very static and fixed event & request system inAyudame 1.0,Ayudame 2.0 is using a flexible and generic event & request system to allow different programming models to be easily inte-grated. Ayudame 1.0was strictly linked and implemented to support SmpSs and its successor OmpSs. Ayudame 2.0supports the usage of hybrid applications us-ing multiple programmus-ing models (MPI+OmpSs). From a sus-ingle node and a sus-ingle process supporting Ayudame 1.0, Ayudame 2.0 moved to a library running on several processes/nodes and is also capable of scaling with the application.
Chapter 3. Related Work 26
3.2
Traditional Debugging tools
3.2.1
DDT
Allinea DDT [20] (based on GNU [21])is one of the leading parallel debuggers used in HPC. The debugger supports a wide range of parallel architectures even besides the today’s HPC systems (ARM32, ARM64) and parallel programming models, including MPI, UPC [22], CUDA and OpenMP. The newest version Allinea Forge, combines Allinea DDT and Allinea MAP. Allinea MAP is a low-overhead and line-based profiler for MPI, OpenMP and scalar programs. Allinea DDT is ca-pable of debugging: 1) single process and multithreaded software, 2) OpenMP parallel applications, 3) applications using MPI, 4) heterogeneous applications us-ing GPUs, 5) hybrid applications combinus-ing different programmus-ing models and 6) Allinea DDT is capable of debugging multi-process applications. The tool sup-ports the mainstream languages (C, C++, Fortran90, CUDA) used in HPC and also the most common programming models (MPI, OpenMP, UPC, Co-array For-tran, etc.). As back-end the debugger uses a modified gdb version.
3.2.2
Totalview
Totalview [23] is the sophisticated software debugger from Rogue Wave Software, Inc. The debugger is used for debugging and analysing both, serial and parallel programs. Like DDT the software is also designed for the usage with complex multi-process and multi-threaded applications. Totalview supports the major HPC platforms in the U.S., in addition, there are also parts for NEC, etc. available from 3rd-party sources. The tool supports the mainstream languages (C, C++, Fortran90, Assembler) used in HPC and the most common programming models (MPI, OpenMP) as well.
3.3
Programming-Model-Centric Debugging for
multicore embedded systems
This paragraph is related to the work Kevin Pouget did during his PhD thesis [24] and explains shortly the solution he has chosen. For a short remark, the work I did
Chapter 3. Related Work 27
is directly connected to the programming model. Ayudame monitors and inter-acts with the runtime. Kevin Pouget has chosen another way for monitoring and interacting. He developed a Python-based library, interacting with the gdb de-bugger, called mcgdb. Therefore, he has to detect the low-level instructions of the runtime and translate this information into programming model behaviour, e.g. 1) instruction x means task creation, 2) instruction y means task execution, etc. Looking again at the Figure 1.4 his approach is vertical translating from a lower abstraction layer to a higher layer, while the approach I chose is horizontal, trans-lating directly from the programming model into the Model-Centric Debugging
approach. Kevin Pouget is using the Temanejo &Ayudame tool infrastructure to transfer and display the information extracted by mcgdb. He also introduced a new graphical representation in Temanejo, using sequence diagrams in addition to the dependency graph representation.
Chapter 4
Design: Events & Requests in
Ayudame
4.1
Introduction
Communicating messages between an application (Chapter1.6) and a visualisation front-end (Temanejo chapter 2.7) require a generic interface. This interface is designed to exchange defined message types in a standardised way. Two major goals have to be fulfilled: The support of 1) hybrid programming models and 2) distributed applications. The hybrid programming models are located in the same process, e.g. MPI+OpenMP, but in a distributed application there could be multiple of these processes, located on different nodes. Information monitored by the instrumentation of a given programming model are called events (Section4.2). Events are always passed from the application towards Temanejo or any user interface. Messages coming from the visualisation and transferred towards the programming model are called requests (Section 4.3). These requests can control the runtime behaviour.
4.2
Events in Ayudame
Events in Ayudame and Temanejo are messages originating from the different instances of the application. They need to be passed towards the visualisation front-end. The box in Figure 4.1 shows a brief example of the different event
Chapter 4. Design: Events & Requests in Ayudame 30
Events Monitoring
Task
Parameters: task ID, scope ID, task label Dependencies (synchronisation between tasks)
Parameters: dependency ID, from task ID, to task ID, dependency label
Properties (tasks or dependency characteristic)
Parameters: property ID, property key, property value
– task state
– priority
– function name
– ...
Figure 4.1: The runtime informs Ayudameabout any relevant changes. The
events are forwarded toTemanejo
types, and also the necessary parameters for every event are listed. Events can be split up into mandatory information (Section 4.2.1), like tasks and dependencies, and optional or additional information (Section 4.2.2), containing properties and payload. For building a dependency graph only the mandatory information is necessary. The additional information is optional and can be used to add task or dependency characteristics to the graph.
4.2.1
Mandatory Information
Mandatory information is needed to build up the dependency graph inTemanejo. The two events needed are tasks (Section 4.2.1), representing the nodes in the dependency graph, and dependencies (Section4.2.1), the edges between the nodes. In a dependency graph each task can have several predecessors and only if all of the predecessors have been executed the task is allowed to run. After the execution of the task, all successor dependencies are resolved. Tasks with resolved dependencies can be executed. The dependency graph is represented through a directed acyclic graph (DAG).
Tasks are the nodes in the dependency graph. With this graph representation
Chapter 4. Design: Events & Requests in Ayudame 31
a unique identifier (Section 5.6.2) and a scope identifier. This means one task in the parallel programming model will only be executed once. There can be multiple task instances from a given code region, but their parameters may be different. Thescope identifier tells the tool if the task is generated from inside


![Crystal structure and Hirshfeld surface analysis of (E) 4 {[2 (4 hydroxybenzoyl)hydrazin 1 ylidene]methyl}pyridin 1 ium nitrate](data:image/gif;base64,R0lGODlhAQABAIAAAP///wAAACH5BAEAAAAALAAAAAABAAEAAAICRAEAOw==)