A Four-Year Study
of Boston’s
Pilot High Schools
Strong Results,
High Demand:
November 2007
Center for
Collaborative
A Four-Year Study
of Boston’s
Pilot High Schools
Strong Results,
High Demand:
November 2007
Center for
Collaborative
Education
The views, fi ndings, and opinions of the authors do not
necessarily refl ect those held by the Boston Public Schools.
Design and production: Blue Skies Design
Printing by: Allegra Printing
Contents
EXECUTIVE SUMMARY ...iv
INTRODUCTION ...1
DATA COLLECTION AND METHODS ...4
FINDINGS ...6
I. HOW ARE BOSTON PILOT HIGH SCHOOL STUDENTS FARING? ...6
Student Engagement ... Student Engagement ... Student Engagement 6 Attendance ...6
Out-of-School Suspensions ...7
Yearly Transfers Within the District, Transfers Out of the District, and Annual Dropouts ...8
Student Performance ...10
Grade-Level Retentions ...10
Grade Nine Promotions ...11
MCAS Exam Pass Rates ...11
Changes in Math MCAS Exam Pass Rates ...12
Four-Year Cohort Graduation Rates, Class of 2006 ...13
II. WHOM DO PILOT HIGH SCHOOLS SERVE? ...15
Pilot High Schools Are Largely Representative of BPS Enrollment, with a Few Exceptions ...15
Pilot High Schools Serve Students with Risk Factors at Lower Levels than BPS ...17
III. HOW ARE STUDENTS WITH RISK FACTORS PERFORMING IN PILOT HIGH SCHOOLS? ...20
IV. HOW ARE STUDENTS IN DIFFERENT DEMOGRAPHIC SUBGROUPS PERFORMING IN PILOT HIGH SCHOOLS? ...22
Diff erences in MCAS Pass Rates by Racial Subgroup Have Narrowed over Time ...22
Diff erences in MCAS Pass Rates by Income-Level Subgroup Fluctuate over Time ...24
MCAS Pass Rates for Other Demographic Subgroups ...25
MCAS Outcomes for English-Profi cient Students Only ...25
MCAS Outcomes for Students in Regular Education and Mainstream Special Education Only ...26
V. HOW DOES LOTTERY ASSIGNMENT OR APPLICATION FOR ADMISSION AFFECT PILOT HIGH SCHOOL ENROLLMENT? ...29
DISCUSSION OF FINDINGS ...33
PILOT HIGH SCHOOLS ARE SERVING STUDENTS WELL ...33
WHAT MAKES PILOT HIGH SCHOOLS DIFFERENT? ...34
FAMILIES AND STUDENTS SEEK HIGH-PERFORMING HIGH SCHOOLS ...35
POLICY IMPLICATIONS ...37
APPENDICES 1 PILOT SCHOOLS/HORACE MANN NETWORK VISION, MISSION, AND PRINCIPLES AND PRACTICES ...40
2 PILOT HIGH SCHOOL INFORMATION ...41
3 GROUP SIZES FOR ANALYSES ...42
4 DETAILED METHODS AND LIMITATIONS ...48
5 2004–05 SUBGROUP DEMOGRAPHICS BY PILOT HIGH SCHOOL ...51
REFERENCES ...52
Ex
ecutiv
e
Summar
y
Executive Summary
November 2007
New research from the Center for Collaborative Education fi nds that students in Boston’s Pilot high schools outperform students from other non-exam Boston Public Schools on every standard measure of engagement and performance. Th is level of achievement holds for every racial, economic, and academic subgroup examined. Pilot high school students show better MCAS scores, higher attendance rates, higher promotion rates—and the four-year graduation rate for 2006 was more than 23 percentage points higher than the rate for BPS students, 75.7% as compared with 52.2% for BPS. (“BPS” in this report refers to non-Pilot, non-exam schools.)
Th e study found that Pilot high schools refl ect the BPS demographics in terms of race, income, and mainstream special needs students. Th e report also identifi es some areas in which Pilot School demographics fall short of the goal of representing the student population of the Boston school district. Pilot high schools have proportionately fewer students designated as Limited English Profi cient and fewer students with moderate to severe special needs.
In addition, proportionately fewer students arrive with certain other warning signs of “risk,” such as low grade 8 math MCAS scores and poor attendance records in eighth grade. It is not possible to isolate how much diff erences in populations, in addition to the Pilot features of schools, aff ected diff erences in performance outcomes.
However, the news from the report is that Pilot high school students in every category—including students with risk factors—performed better than their counterparts in the Boston school district.
Th e present study off ers a review of Pilot high school student performance over the course of four years, looking at overall outcomes. It then parses the data to identify how diff erent populations of students are being served by the Pilot Schools.
D
EFINING
P
ILOT
S
CHOOLS
Pilot Schools were fi rst created in Boston in 1995 through a unique partnership that included the mayor, the offi ce of the school superintendent, the school committee and the teachers union. An essential characteristic of Pilot Schools is that they are freed from district mandates and union work rules to have greater control over budget, staffi ng, curriculum, governance, and schedule in order to provide better education for their students. Pilots are designed to serve the
Ex
ecutiv
e
Summar
y
same student population as the district schools, and have several additional defi ning characteristics:
• Pilots are accountable: Pilot Schools and the district have developed a set of consistent benchmarks, against which performance is evaluated every fi ve years.
• Pilots are small and personalized: Pilot Schools place great emphasis on creating a nurturing school culture in which teachers can attend closely to each student’s learning needs.
• Pilots are vision driven: Every Pilot School has created a vision focused on equity and the fundamental belief in each child’s potential. Pilot Schools have the power to hire teachers and staff to support the culture and vision of each individual school.
A S
UMMARY
OF
THE
FINDINGS
Among the highlights of the report’s fi ndings are results that demonstrate the power of the Pilot School model. Th ese include the following:
• Pilot high schools serve students well on every outcome in a wide range of measurable performance and engagement criteria.
• Th e four-year Pilot high school graduation rate for the most recent year was 23 percentage points higher for Pilots (75.7%) than for BPS (52.2%).
• Pilot high schools have attracted students that represent the district’s racial, economic, and mainstream special education subgroups. • Pilot high schools enroll a lower percentage of
students with risk factors, independent of the student assignment process, suggesting that a disproportionate number of students without risk factors who are seeking high-performing schools choose to apply to Pilot Schools. • Students with risk factors perform better in
Pilot high schools than in district schools. • Comparisons of the MCAS scores of students in
Pilot high schools with those of like students in all subgroups in district schools show stronger performance among Pilot high school students.
S
COPE
OF
THIS
STUDY
Th is is the most comprehensive examination of Pilot high school performance to date, using data provided by the Boston School Department to examine Boston’s closely watched Pilot high schools over a four-year period (2001–05).
Taken together,
the student
engage-ment and
performance fi
nd-ings show that Pilot
high school students
are outperforming
the district average
on a range of
indicators of
behavior and
Ex
ecutiv
e
Summar
y
In addition to aggregate analyses, the report breaks down the numbers to discover who is attending Pilot high schools and how subgroups of the Boston student population are faring in Pilot high schools.
L
OOKING
AT
DEMOGRAPHIC
SUB
-
GROUPS
Th e report fi nds that Pilot high school students as a group are doing substantially better on all measures of academic success than their peers in the district. It then breaks down the larger group into subgroups by racial, economic, and academic designations to answer two important questions:
• How comparable is Boston’s Pilot high school population to the district high school population?
• How well do the specifi c subgroups fare in Pilot high schools in comparison to similar groupings in the district as a whole? Th e study looks at grade 10 MCAS results for the three larger racial groups— Black, Latino, and White—and fi nds that for each group over four years the pass rates are substantially higher for Pilot School students than BPS students in both math and English language arts (ELA). Black and Latino Pilot students had higher pass rates in seven out of the eight administered tests, while White Pilot students passed at higher rates in all eight tests.
Th e achievement gaps—between White and Black students, and between White and Latino students—as measured by MCAS scores continued to be a problem within both Pilot and BPS schools in all four years, on both ELA and math tests. However, there is promising news for Pilot Schools: at the beginning of the period tracked in the study, the gaps were greater in the Pilot Schools; at the end they were smaller in Pilots than in BPS schools.
Looking at economic variables, the study fi nds comparable enrollment in Pilot and BPS schools: 68.4% of Pilot students and 69.8% of BPS students were eligible for free/reduced-price lunch, a common proxy for low-income students. In each year and on both grade 10 MCAS tests, low-income Pilot School students passed at a higher rate than their BPS counterparts—by more than 20 percentage points on fi ve of the eight tests.
Th e study examines the academic history of Pilot students to see whether students with risk factors—namely, low eighth-grade attendance rates; having received a warning grade on their grade 8 math MCAS exam; or being over-age fi rst-time ninth graders—are represented proportionately to BPS schools, and
Ex
ecutiv
e
Summar
y
how such students fare in Pilot high schools. Th e data show that, while there are substantial numbers of students with risk factors entering Pilot high schools, the proportion is lower than in BPS schools. However, Pilot ninth graders who received a warning on their grade 8 math MCAS performed substantially better than corresponding BPS ninth graders. Th ey had higher ninth-grade attendance rates, higher promotion rates to tenth grade, and higher passing rates on both grade 10 MCAS exams.
Th e study also fi nds that, while Pilot high schools serve similar percentages of mainstream special education students to BPS schools, they serve
proportionately fewer students designated as Limited English Profi cient and students who have moderate to severe special needs, although the gap has been closing in recent years for the special needs population. While the numbers for these Pilot populations were too small to analyze comparative results, the study found that the aggregate diff erences in MCAS pass rates between Pilot and BPS schools were not aff ected by the disproportionate representation of these students.
I
MPACT
OF
ADMISSIONS
POLICIES
ON
P
ILOT
HIGH
SCHOOL
ENROLLMENT
Th e ten Pilot high schools have a variety of admissions processes that often diff er from BPS schools. Two admit strictly by lottery (like district schools); two accept only over-age students; one is a performing arts school with
academically blind auditions; one is a pathway school that admits students from its feeder school; one is a Horace Mann School with a state-mandated lottery and application process; and three ask students to complete an application to evaluate the match between student and school.
Th e study fi nds that Pilot Schools with diff erent kinds of admissions processes, including both application and lottery processes, end up with a lower percentage of students with risk factors than are found in BPS schools. Even though in the fi rst year studied lottery schools had students with some risk factors in proportions that were equivalent to BPS schools, as demand shifted, the percentages of students with risk factors decreased each succeeding year. Th e study
concludes that good schools attract the interest of a disproportionately high number of college-bound students, which would suggest a correspondingly smaller proportion of students with risk factors.
K
EY
POLICY
RECOMMENDATIONS
Analysis of the data in this four-year study supports the following courses of action:
• Create more Pilot Schools. Pilot Schools are more eff ective for students from all backgrounds and of all levels of achievement and are being chosen by more students than they can currently serve. While the Boston Public Schools’ student population has been declining, the demand for enrollment in Pilot high schools has remained beyond capacity.
• Revisit and strengthen the Boston Public Schools student
assignment process to encourage informed choices of high schools by all students. Students need information about the schools they are choosing so they can make informed, intentional choices. Informed students will lead to increased positive matches between students and schools. A likely outcome will be increased engagement and performance across the district’s high schools.
• Enroll representative proportions of students who are
designated Limited English Profi cient, as well as students with moderate to severe special needs, in Pilot Schools. As much as possible, these schools should represent the BPS population.
• Share the lessons of Pilot Schools. Th is has always been the intent of the Pilot program—to help Boston improve education throughout the district.
As district public schools that were created to serve as laboratories of innovation, Pilot high schools are in high demand and have strong results. Th ey are achieving the goals of equity and excellence within the public school district. Th e experiment in innovation that the Boston Public Schools and the Boston Teachers Union created 12 years ago has demonstrated results that
suggest that the Boston Public Schools need look no further than their own Pilot Schools for examples of high-performing high schools. Families across race and income lines, and students with risk factors all seek high-performing schools. Th e logic presented in the creation of Boston’s Pilot Schools in 1995 still holds. Demand for quality high schools exceeds supply. Th e challenge of the district and the teachers union is to respond by working together to create more quality school choices for Boston families.
Ex
ecutiv
e
Summar
Introduction
Until 2006, Boston Public Schools was the only district in the country with Pilot Schools, which were granted autonomy over school design and were created to serve as research and development sites for the district. Because Pilot Schools have innovative practices and have demonstrated a capacity to improve student learning, the public and the education community look with interest upon these schools as models for urban school reform. For the fi rst time, available data allow an in-depth longitudinal examination of Pilot School student performance. Because of the recent national and district attention to high school reform, this paper focuses on Boston’s ten Pilot high schools. Th rough examination of multiple subgroups and cohorts of students from 2001 through 2005, the report seeks to understand the enrollment patterns and outcomes of Boston students in Pilot high schools in comparison to other district high schools. Boston Pilot Schools, currently a network of 20 schools within the Boston Public School district, were created in 1994 through an agreement among the city’s mayor, school committee, and teachers union.1 At that time, the district was concerned about the
potential loss of Boston students to newly opening charter schools, and proactively created the Pilot model. Th rough this agreement, Pilot Schools were granted autonomy over fi ve key areas of school design and operations:
• Budget • Staffi ng • Governance
• Curriculum, instruction, and assessment • Schedule
In addition to being autonomous, Pilot Schools place high priority on being:
• Accountable: Pilot Schools are held to high standards of performance through
a high-stakes school quality review process every fi ve years, using a set of benchmarks that articulate the criteria for high-performing schools.
• Small: Pilot Schools enroll 450 students or fewer, enabling adults to know
students well. Every school places great emphasis on creating a nurturing school culture in which staff pay close attention to each student’s learning needs.
• Vision driven: Every Pilot School has an articulated vision of educating all of its
students, with teaching and learning at the vision’s core. Pilot Schools have the latitude to hire staff members who are committed to fulfi lling the school’s vision.
• Focused on equity: Pilot Schools embrace as a core belief the potential of every
student to achieve academic success and graduate from college, regardless of his or her background and past educational experience.
Pilot Schools belong to a Network convened by the Center for Collaborative Education, a nonprofi t education organization that provides coaching, professional development,
1 Two of the 20—Boston Day and Evening Academy and Health Careers Academy—are Horace Mann charter schools in
addition to being part of the Pilot School Network. Horace Mann charters are granted autonomy by the state department of education while also remaining part of the district and the teachers union.
In
tr
oduc
In
tr
oduc
tion
advocacy, and research for the schools. Together, they commit to Network principles of high expectations, personalized teaching and learning, and family involvement (Appendix 1).
Since their inception, Pilot Schools have received increasing attention for their innovative practices and strong outcomes (CCE, 2001a; CCE, 2004a; Tung, Ouimette, and Rugen, 2006). Th is paper focuses on the ten Boston Pilot and Horace Mann high schools within the Network, which served about 13.5% of Boston public high school students in 2004–05. Th e ten Pilot high schools are diverse by mission, theme, and instructional focus. Th ey are listed in the following table (additional information in Appendix 2).
Table 1: Boston’s Pilot High Schools
School Name Grades Served Enrollment in 2005 How Became Pilot School Focus
Another Course to College 9 to 12 248 Conversion from a
program College prep Boston Arts Academy 9 to 12 406 Start-up and performing arts College prep, visual
focus Boston Community Leadership Academy 9 to 12 442 Conversion from regular status College prep, leadership focus Boston Day and Evening
Academy
(Horace Mann Charter) ungraded 392 Start-up
Over-age, college prep Fenway High School 9 to 12 275 Conversion from a
program College prep Greater Egleston
Community High School 10 to 12 104
Conversion from a program
Over-age, college prep Health Careers Academy
(Horace Mann Charter) 9 to 12 209 Start-up College prep,health focus Josiah Quincy Upper
School 6 to 12 433 Start-up feeder K–5 schoolCollege prep,
New Mission High School 9 to 12 244 Start-up College prep TechBoston Academy 9 to 12 236 Start-up technology focusCollege prep, Subsequent to the creation of Pilot Schools, the Boston Public School (BPS) district has instituted several other signifi cant changes in the choices off ered to Boston high-school-age residents. In 2001, in addition to the Pilot high schools, BPS had 9 large, comprehensive high schools, 3 exam schools, 1 career and technical school, and 2 small schools. Over the course of several years, 4 of the 9 large, comprehensive high schools have been transformed into 12 small schools in educational complexes. Th e remaining
In
tr
oduc
tion
5 large, comprehensive high schools each contain multiple small learning communities. Four other large high schools remain: 3 examination schools and 1 career and technical education school. Th us, BPS’s high school reform strategy evolved to embrace a
“managed portfolio” approach that allows students and families to choose from the following diff erent types of public high schools:
• Large, comprehensive high school with small learning communities (5)
• Examination school (3)
• Career and technical education school (1)
• Small school housed in education complex (12)
• Small free-standing school (2) • Pilot School (10)
School choice has been a policy that many urban districts have adopted in recent years with mixed support and mixed results (Goldhaber, 1999; Powers and Cookson, 1999). Given that Boston high school students have the multiple public school choice options listed above, the public and the district may ask about the outcomes and consequences of the choice policy: Does choice lead to better educational outcomes for students, and if so, for which school types?
With the recent changes in high school off erings and increased availability of student-level data, questions about Pilot high school outcomes in engagement and performance in comparison with the district’s non-Pilot schools may be answered in more depth than in the past. Th is paper expands on results reported in an earlier one-year study (Tung, Ouimette, and Rugen, 2006), using a four-year, student-level database (2001–02 to 2004–05) to understand outcomes across Boston’s high schools. Specifi cally, the following research questions guide an analysis of educational outcomes and student enrollment in Pilot high schools as compared with other BPS high schools:
I.
How do Pilot high school students perform in comparison
with other district high schools across a range of
engagement and performance indicators?
II. Whom do Pilot high schools serve?
III. How are students with risk factors performing in Pilot
high schools?
IV. How are students in diff erent demographic subgroups
performing in Pilot high schools?
V. How does lottery assignment or application for admission
aff ect Pilot high school enrollment?
Da
ta C
ollec
tion
Data Collection and Methods
Th e data analyzed in this paper were obtained from the Boston Public Schools (BPS) and represent all students enrolled at any point in time in BPS high schools, grades 9–12, for each of the four school years: 2001–02, 2002–03, 2003–04, and 2004–05. Th e indicators that BPS provided to the Center for Collaborative Education (CCE) are the same that it provides to the Massachusetts Department of Education’s Student Information Management System (SIMS) database. BPS also provided the Massachusetts Comprehensive Assessment System (MCAS) results that were obtained from the Massachusetts Department of Education.
All data were received at the individual student level. All four years of SIMS and MCAS data fi les were cleaned of duplicate lines of data, inconsistent data was reconciled and new variables were created as needed, without loss of any raw data. Each year’s fi les were then merged into one database. Analyses were performed using both SPSS and Excel. Each analysis excluded students who were enrolled in the district for only one day and/or attended zero days in a year as well as students attending schools serving special populations.2 Students were aggregated into three school types:
• Boston Public Schools (BPS): all high school students enrolled in Boston Public Schools who attended schools that did not have Pilot or exam status.
• BPS Pilot high schools: all high school students enrolled in Boston Public Schools that have been granted Pilot status by the district.
• Exam schools: all high school students enrolled in the three Boston high schools that admit students based on entrance examination results and prior academic achievement.
In addition to the schools mentioned above, schools predominantly or exclusively serving over-age students3 were excluded from the analysis of grade-level retentions, grade-level promotions, and the four-year graduation rate.
Because admissions processes diff er by school type, experimental methods could not be used to study Pilot high schools (Betts and Hill, 2006). Of the nonexperimental, observational methods suggested by Betts and Hill (2006), this paper uses student-level analyses of trends in outcomes over time that control for certain individual student characteristics, such as race, socioeconomic level, and being a member of a risk factor group. Th e three fi rst-time-ninth-grader risk factors studied in this paper are: low attendance in eighth grade, warning on grade 8 math MCAS exam, and being more than two years over age.
All indicators, except for attendance rates, represent the proportion of students within each school type who refl ect that measure. For example, in terms of out-of-school suspensions, the numbers represent the percentage of students within each school type
2 Students attending the following BPS schools were excluded from the analysis: Carter Center, Community Academy,
Expulsion Alternative Program, Horace Mann, McKinley Schools, Middle School Academy, and Young Adult Center.
3 Th e following schools serve over-age students: Boston Adult Technical Academy (BPS), Boston Day and Evening
Da
ta C
ollec
tion
who were suspended in each school year. Median attendance rates were calculated as the days students attended divided by days of membership for each school type each year. Pilot School group sizes are smaller than BPS and exam schools (Appendix 3 contains group sizes for each analysis). Th erefore, small changes in the data could result in large fl uctuations by proportion. Multiple hypotheses were tested to understand fl uctuations from year to year in Pilot School outcomes, including school openings and closings, school size changes, feeder patterns, etc.
Because the database includes the entire population (students in Boston Public Schools from 2001–2005) rather than a random, representative sample, sampling error is eliminated and statistical signifi cance testing is not appropriate. Statistical signifi cance refers to how certain one can be that a diff erence seen in a sample can be generalized to a population. We use a series of non-parametric tests to make comparisons between school types. In addition, in order to determine the strength of the relationship or magnitude of diff erence between the variables in each analysis, eff ect sizes using the Pearson rrr family of values are reported. Eff ect sizes can range from -1.0 to +1.0. Th e family of values are reported. Eff ect sizes can range from -1.0 to +1.0. Th e interpretation of eff ect sizes in the Pearson rrr family used the general guidelines of 0.10 family used the general guidelines of 0.10 as small, 0.30 as medium, and 0.50 as large (Cohen, 1988). Any eff ect size is statistically meaningful, whether small, medium, or large.
Th e Mann-Whitney UUU test was used to compare BPS and Pilot high schools when the test was used to compare BPS and Pilot high schools when the dependent variable was ordinal or nonnormally distributed, such as attendance rates, out-of-school suspensions, and MCAS exam pass rates. Eff ect sizes were calculated using the formula r = z/√N. Chi square was used to compare BPS and Pilot high schools when the variables were both nominal, such as retention rates, promotion rates, and proportion of students with the risk factor of warning on grade 8 math MCAS exam. When chi square was used, phi or Cramer’s VVV provided information about eff ect sizes. provided information about eff ect sizes. More specifi c methods and descriptions of each indicator, as well as some limitations of the study, are included in Appendix 4.
Findings
Findings
I. H
OWA
REB
OSTONP
ILOTH
IGHS
CHOOLS
TUDENTSF
ARING?
Over four years, Pilot high school students on the whole outperform the district average on all indicators of student engagement and achievement.
Because no one indicator can accurately describe a school’s eff ectiveness, data on school and student outcomes cover a range of indicators of student engagement and performance. For every indicator examined, Pilot high school outcomes are higher on average than non-Pilot, non-exam school outcomes, and diff erences are statistically meaningful. For brevity and clarity, the non-Pilot, non-exam school type is referred to as “BPS” throughout this paper. Th e analyses in this paper build on those reported previously (Tung, Ouimette, and Rugen, 2006) and add new indicators made possible by multiple years of data.
Student Engagement
Student engagement in high school is refl ected in multiple ways, both in academics and in behavior (Janosz et al., 2000). Several indicators available for analysis of student engagement include:
• Attendance rate
• Out-of-school suspension rate
• Rate of transfers out of the school to another school in the district • Rate of transfers out of the school to another district
• Annual drop-out rate
Attendance
Attendance rates are an indicator of school eff ectiveness and correlate with high school completion rates (Binkley and Hooper, 1989; Bryk and Th um, 1989; Sween et al., 1987). Pilot high school students have consistently high median attendance rates over the four years studied, around 94%. Th e diff erence between Pilot and BPS attendance rates in 2004–05 corresponds to almost two weeks of school. Mann-Whitney UUU tests were tests were performed to compare school types. In all four years, Pilot high schools had higher attendance rates than BPS schools, with rrr ranging from 0.11 to 0.19. ranging from 0.11 to 0.19.4
4 Where diff erence or association has been established through statistical testing, the eff ect size gives an indication of
the magnitude of the diff erence (or association) between variables, in this case, school type and median attendance rates. Th roughout this study, the interpretation of eff ect sizes in the Pearson r family uses the general guidelines of 0.10 as small, 0.30 as medium, and 0.50 as large (Cohen, 1988). Any eff ect size is statistically meaningful, whether small, medium, or large.
Findings
���� ���� ���� ���� ���� ���� ���� ���� ���� ���� ���� ���� �� �� �� �� �� �� �� �� �� ��� ���� ���� ���� ���� �� �� �� � ��� ��������� ���� Out-of-School SuspensionsOut-of-school suspensions result when students’ behaviors are considered to be
disruptive. One result of this form of discipline is that the students who are suspended are excluded from learning (Cotton, 1995; Pinnell, 1985). Low out-of-school suspension rates indicate higher student engagement and positive school climate (Cotton, 1990). Over four years, Pilot high schools have had consistently lower suspension rates than BPS schools. Th ese rates have also steadily declined over the past two years. Cramer’s V
tests were performed to compare school types. In all four years, Pilot high schools had lower suspension rates than BPS schools, with eff ect sizes ranging from 0.12 to 0.13.
��� ��������� ���� ��� ���� ��� ��� ��� ��� ��� ��� ��� ��� ��� ��� � � � � � �� �� �� �� ���� ���� ���� ���� �� �� �� �
Figure 2: Suspension Rates by School Type (in percent)
Figure 1: Median Attendance Rates by School Type (in percent)5
5In all fi gures with these terms, “BPS” denotes high school students enrolled in Boston Public Schools who attended
schools that did not have Pilot or exam status; “BPS Pilot” denotes high school students enrolled in Boston Public Schools that have been granted Pilot status by the district; and “Exam” denotes high school students enrolled in the three Boston high schools that admit students based on entrance examination results and prior academic achievement.
Findings
Yearly Transfers within the District, Transfers out of the District, and Annual Dropouts
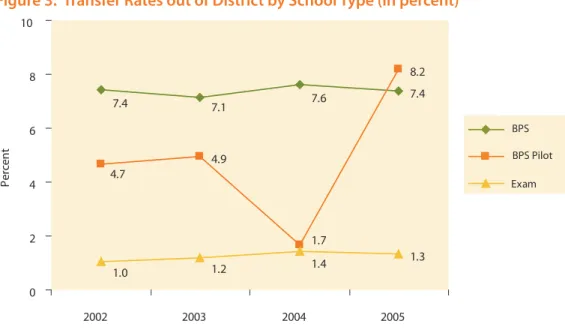
Th ese indicators are proxies for a school’s mobility rate. High mobility rates indicate that the schools are not “holding” students (Rumberger and Th omas, 2000; State University of New York, 1992). Students who transfer from a Boston school to a school outside of the district and inform the district of the move are categorized as transfers out. Pilot transfer-out rates were lower than BPS transfer-out rates for the fi rst three years of analysis; however, the rate increased to slightly above BPS rates in the last year of analysis. ��� ��� ��� ��� ��� ��� ��� ��� ��� ��� ��� ��� � � � � � �� ���� ���� ���� ���� �� �� �� � ���� ��� ��������� Figure 3: Transfer Rates out of District by School Type (in percent)
An analysis of transfers out of one Boston school to another Boston school showed that Pilot high school in-district transfer rates were the same as BPS high schools for the most recent two school years. In-district transfer rates are uniformly low, likely because of the district’s voluntary transfer policy, which at the high school level allows only one transfer, except for safety and programmatic reasons, during a student’s high school career.
Table 2: In-District Transfer Rates by School Type (in percent)6
2002–03 2003–04 2004–05
BPS 4.3 5.5 5.9
BPS Pilot 6.7 4.6 5.9
Exam 3.2 3.0 3.1
6In all tables with these terms, “BPS” denotes high school students enrolled in Boston Public Schools who attended
schools that did not have Pilot or exam status; “BPS Pilot” denotes high school students enrolled in Boston Public Schools that have been granted Pilot status by the district; and “Exam” denotes high school students enrolled in the three Boston high schools that admit students based on entrance examination results and prior academic achievement.
Findings
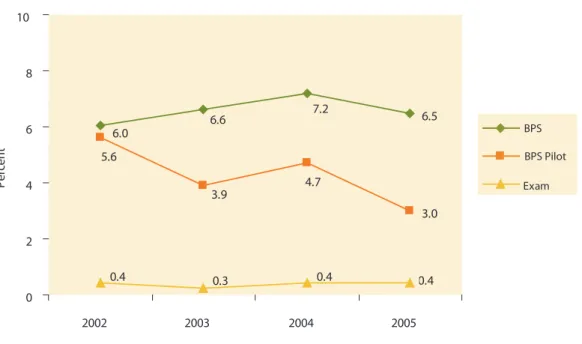
Annual drop-out rates are another component of mobility within a student population.7 Th e annual drop-out rate is the proportion of students each year who leave the BPS system without transferring and without a diploma. Th is indicator also includes those students for whom the district does not have information on their reason for leaving. Pilot high schools have lower annual drop-out rates than BPS each year of the study. Cramer’s VVV for transfers out of district and annual dropouts for the four years ranged for transfers out of district and annual dropouts for the four years ranged from 0.11 to 0.14. ��� ��� ��� ��� ��� ��� ��� ��� ��� ��� ��� ��� � � � � � �� ���� ���� ���� ���� �� �� �� � ���� ��� ���������
Figure 4: Annual Drop-Out Rates by School Type (in percent)
When out-of-district transfers, in-district transfers, and annual dropouts are added together, Pilot high schools have lower mobility rates (from 2.0 to 8.5 percentage points lower in each year) and higher holding power than other BPS high schools.
In summary, Pilot high school students had engagement outcomes that were consistent and stronger than BPS high school students in attendance, suspensions, and mobility as defi ned by transfers and yearly dropouts. Th ese positive Pilot high school results suggest that the schools are engaging students well and predict that their academic outcomes will also be positive.
7Annual drop-out rates diff er from four-year cohort drop-out rates. Four-year cohort drop-out rates are calculated by
Findings
Student Performance
Taken together, student performance indicators provide an explanation of how well students progress on time and meet state standards. Th ese academic outcomes are analyzed by school type for the district and add to the information that the student engagement indicators reveal about high schools in Boston. Th e indicators described in this section include:
• Grade-level retention rate
• Grade 9 promotion rate
• Pass rate in grade 10 ELA and math MCAS exam
• Changes in math MCAS pass rate from grade 8 to grade 10 • Four-year cohort graduation rate
Grade-Level Retentions
Students who are retained in a grade for an extra school year have an increased risk of continued low achievement and of dropping out of school (Jimerson, Anderson, and Whipple, 2002). While BPS high schools had high levels of grade retentions for grades 9–12 (one in four students), Pilot high schools had lower levels of grade retentions, although those levels rose in 2003–04 and 2004–05.
���� ���� ���� ���� ���� ���� ��� ��� ��� � � �� �� �� �� �� ������� ������� ������� �� �� �� � ���� ��� ���������
Figure 5: Grade Level Retention Rates by School Type (in percent)
To investigate whether BPS and Pilot high schools diff er on grade-level retentions in grades 9–12, a chi-square statistic was used and diff erences were found. Eff ect sizes for BPS and Pilot high schools’ grade-level retention rates for all three cohorts ranged from 0.19 to 0.21 (Cohen, 1988).
Findings
Grade Nine Promotions
Grade-level promotion is an indicator of the percent of students who are progressing academically at the expected rate. Various studies have shown that many schools are promoting ninth graders at lower rates, possibly due to the increased high-stakes testing in the tenth grade (Haney et al., 2004; Warren and Corl, 2007). Because of these observations, the promotion rates of ninth graders (as opposed to the previous indicator, which combines grades 9–12) were analyzed by school type. Pilot high school ninth-grade promotion rates were consistent at 92% across multiple years, approaching exam school rates, while BPS high school ninth-grade promotion rates were 16–22 percentage points lower. A chi-square statistic was used, and Cramer’s V ranged between 0.20 and 0.27 for the three cohorts.
Table 3: Grade 9 Promotion Rates by School Type (in percent)
2001–02 2002–03 2003–04
BPS 71.5 69.8 75.5
BPS Pilot 91.7 92.1 91.7
Exam 93.3 96.0 94.2
MCAS Exam Pass Rates
MCAS exam outcomes in English/Language Arts (ELA) and math were analyzed by pass rates (proportion of students performing in advanced, profi cient, and needs improvement categories) for four years. In ELA, Pilot students outperformed BPS students in each of the four years studied. Exam school students consistently passed at rates between 99% and 100% each year.
���� ���� ���� ���� ���� ���� ���� ���� ���� ���� ����� ���� � �� �� �� �� ��� ���� ���� ���� ���� �� �� �� � ���� ��� ���������
Findings
In math, Pilot students outperformed BPS students in three of the four years.
���� ���� ���� ���� ���� ���� ���� ���� ���� ���� ���� ���� � �� �� �� �� ��� ���� ���� ���� ���� �� ����� ��� ��������� ����
Figure 7: Grade 10 Math MCAS Exam Pass Rates by School Type (in percent)
Mann-Whitney UUU tests were performed to compare BPS and Pilot high schools. Pilot tests were performed to compare BPS and Pilot high schools. Pilot high schools had higher pass rates than BPS schools in all four years for ELA and in three out of four years for math. Measures of eff ect size rrr ranged from 0.19 to 0.22 for ranged from 0.19 to 0.22 for ELA and from 0.09 to 0.15 for math.
Changes in Math MCAS Exam Pass Rates
Students currently take the mathematics MCAS in grade 8, at the end of middle school, and grade 10, after two years of high school. Most students change schools from eighth grade to ninth grade, enabling a comparison of tenth-grade MCAS outcomes in one school to eighth-grade MCAS outcomes in the previous school two years before. Since the goal is to attribute the change in pass rates to the second school, schools that span middle and high school were fi ltered out of this analysis.8 Using a four-year database, it is possible to complete this analysis by school type for two cohorts. Th e table below shows the percentage point changes for two cohorts of students. For the fi rst cohort, the change in pass rates from eighth- to tenth-grade tests was higher for Pilot high school students than for BPS high school students. For the second cohort, there were similar changes in pass rates from the eighth-grade to the tenth-grade tests in BPS and Pilot high schools.9
8 Boston schools that span middle and high school grades are: the three examination schools and Josiah Quincy Upper
School (Pilot).
9An analogous analysis of changes in ELA MCAS exam pass rates was not possible. ELA MCAS exams were administered
in grades 7 and 10 during the years of this study, allowing analysis of only one cohort of students. In addition, changes in ELA pass rates could be attributed to the middle school (grade 8) and high school (grades 9 and 10).
Findings
Table 4: Changes in Math MCAS Exam Pass Rates from Grade 8 to Grade 10 by School Type (in percentage points)
Grade 8 in 2002 to grade 10 in 2004 Grade 8 in 2003 to grade 10 in 2005
BPS 28.8 27.6
BPS Pilot 36.4 28.0
Because data for only two cohorts were available, it is not possible to understand whether or not the diff erence in changes in pass rates is trend or anomaly.
Four-Year Cohort Graduation Rates, Class of 2006
Data used to calculate a four-year cohort graduation rate for the freshman class that started in September 2002 was downloaded from the Massachusetts Department of Education (DOE).10 A simple four-year cohort graduation rate was computed by school type. Students in BPS high schools had a four-year graduation rate of 52.2% in 2006, compared to 75.7% in Pilot high schools.11
���� ���� ���� � �� �� �� �� ��� ��� ��������� ���� �� �� �� �
Figure 8: Four-Year Cohort Graduation Rates by School Type (in percent)
Th e student performance indicators examined in this section show consistently strong
academic outcomes in the Pilot high schools in comparison to the BPS high schools. On almost every indicator for each cohort, Pilot students outperform BPS students, with small to medium eff ect sizes. While there are several data points that require further research, the overall picture of Pilot high school performance is that students in these schools progress on time and meet standards at a higher rate than students in BPS high schools.
10 Data can be found at http://profi les.doe.mass.edu/gradrates.aspx.
11 Th e data exclude schools dedicated to students with special needs and schools dedicated to over-age students in
Findings
Summary of
How Are Boston Pilot High School Students Faring?
Taken together, the student engagement and performance fi ndings show that Pilot high school students are outperforming the district average on a range of indicators of behavior and academics. Th ese fi ndings are consistent with previous studies of Pilot high school student engagement and performance (CCE, 2001a; CCE, 2004a; Tung, Ouimette, and Rugen, 2006).
Findings
II. W
HOMD
OP
ILOTH
IGHS
CHOOLSS
ERVE?
Pilot high schools are representative of BPS by race, income status, and mainstream special education status; they are underrepresented for students with moderate to severe special needs and students with limited English profi ciency. Pilot high schools serve signifi cant proportions of students with the risk factor of MCAS scores of warning in grade 8. However, they serve a smaller proportion of students with risk factors than do BPS high schools.
Th e Pilot high school student population can be compared to BPS in several ways: 1) By demographic subgroup, to determine representativeness compared with BPS; 2) By subgroups that predict future academic achievement, such as those that
have “risk” characteristics (Barrington and Hendricks, 1989);
3) By factors that are diffi cult to measure, like motivation and social capital, or by data that are diffi cult to obtain, like family education level (Zimmer and Buddin, 2005).
Using the data currently available, this report examines the student population of Pilot high schools for items 1 and 2 in the list above. Studying the factors in item 3 would require data that are currently not systematically collected. Following this analysis of whom Pilot high schools serve, the outcomes of these subgroups will be examined.
Pilot High Schools Are Largely Representative of BPS Enrollment,
with a Few Exceptions
By the measures of race and eligibility for free/reduced-price lunch, Pilot high school students have mirrored the district for all four years studied. In regard to mainstream special education, Pilot high school students in this subgroup have steadily increased in proportion, from 7.9% in 2002 to 9.7% in 2005, and are nearing the BPS average (10.5%).
Two factors that increase a student’s risk of dropping out of high school are: being an English language learner (as opposed to being a native English speaker); and having moderate to severe special needs that require substantially separate placement (Crawford, 2004; Echevarria and Graves, 2003; Genesse et al., 2005; Wagner et al., 1992). For both of these demographic subgroups, Pilot high schools serve a smaller proportion of students than BPS. While the BPS proportion of students with substantially separate special needs has hovered around 9–10%, Pilot high school proportions have risen from 0.2% to 4.3% in the four years of the study. Th is increase refl ects a district initiative, supported by the Pilot high schools, to increase the
proportion of students with moderate to severe special needs to be representative of the district demographics.
Limited English Profi cient (LEP) designation indicates that a student is not able to perform ordinary coursework in English.12 In both BPS and Pilot high schools, the
Findings
proportion of students who are designated as LEP has dropped in the four years of the study, likely due to state policy changes that abolished bilingual education in 2003, aff ecting the education of English language learners.13 BPS proportions dropped from 31% to 16%, while Pilot proportions dropped from 5% to 3.2%. Th e potential impact of Pilot high schools enrolling smaller proportions of students in substantially separate special education and of students with limited English profi ciency is addressed in section IV of this study.
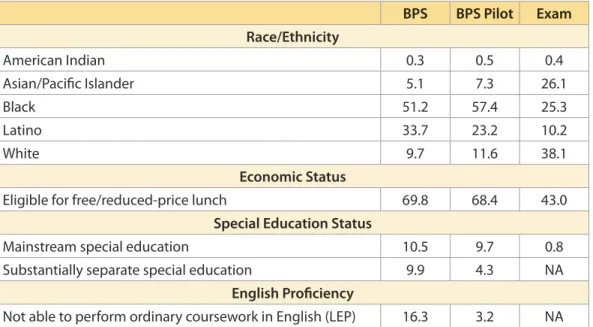
Th e table below shows, by school type, the proportion of each demographic subgroup detailed above for the most recent year of data available, school year 2004–05.
Table 5: Demographic Subgroup Representation by School Type for 2004–05 (in percent)
BPS BPS Pilot Exam Race/Ethnicity American Indian 0.3 0.5 0.4 Asian/Pacifi c Islander 5.1 7.3 26.1 Black 51.2 57.4 25.3 Latino 33.7 23.2 10.2 White 9.7 11.6 38.1 Economic Status
Eligible for free/reduced-price lunch 69.8 68.4 43.0
Special Education Status
Mainstream special education 10.5 9.7 0.8 Substantially separate special education 9.9 4.3 NA
English Profi ciency
Not able to perform ordinary coursework in English (LEP) 16.3 3.2 NA One diff erence between BPS and Pilot high school enrollment is the proportion of fi rst-time ninth graders who were not eighth graders in BPS schools the year before. Pilot high schools consistently enroll a greater proportion of non-BPS eighth graders in the ninth grade.
Table 6: Proportion of First-Time Ninth Graders Who Were Not BPS Students in Eighth Grade by School Type (in percent)
2003 2004 2005
BPS 18.4 16.2 15.9
BPS Pilot 29.7 25.3 25
12 Massachusetts Department of Education designates students both with LEP and with ELL program status. Defi nitions
can be found at: http://www.doe.mass.edu/infoservices/data/sims/DataHandbook.pdf.
13 Referendum Question 2 passed in November 2002. Th is act abolished transitional bilingual education (TBE) as the
primary program available in Massachusetts for children requiring language support. Th e act mandated that instruction be conducted primarily in English through Sheltered English Immersion (SEI) programs starting in the fall of 2003.
Findings
Pilot High Schools Serve Students with Risk Factors at Lower
Levels than BPS
Specifi c characteristics that are predictive of high school academic performance include the following commonly studied risk factors:
• Low eighth-grade attendance rates
• Warning on the grade 8 math MCAS
• Over-age fi rst-time ninth grader
Students in these three categories are typically less engaged in school, are not
progressing on time, and are at higher risk for academic failure and dropping out of high school (Balfanz and Byrnes, 2006; Neild and Balfanz, 2006a; Neild and Balfanz, 2006b). Figure 9 shows that the proportion of Pilot school ninth graders with low attendance (less than 80% attendance) in the eighth grade is lower than that of BPS ninth graders in all three years.14
��� ��� ��� ��� ��� ��� � � � � � � � � � � �� ���� ���� ���� �� �� �� � ��� ���������
Figure 9: Proportion of First-Time Ninth Graders with Low Eighth-Grade Attendance Rates by School Type (in percent)
Grade 8 math MCAS exam warning rates of ninth graders were examined by school type. BPS students had higher eighth-grade warning rates than Pilot high school students in each cohort studied. Forty-eight percent of Pilot ninth graders received warning on the grade 8 math MCAS exam, as compared with 58.5% of BPS ninth graders in 2005. Cramer’s VVV, which indicates the magnitude of the diff erence between , which indicates the magnitude of the diff erence between BPS and Pilot, showed eff ect sizes from 0.09 to 0.15 for the three cohorts (Cohen, 1988).
14 Th e analyses in this section exclude schools that do not use grade-level designations (BDEA and Egleston) and those
that span middle and high school (exam schools and Josiah Quincy Upper School), since their ninth graders are in the same school as grade 8.
Findings
15 Th e analysis excludes schools that serve exclusively over-age students: Boston Adult Technical Academy (BPS), Boston
Day and Evening Academy (Pilot), and Greater Egleston Community High School (Pilot).
���� ���� ���� ���� ���� ���� � �� �� �� �� ��� ���� ���� ���� �� �� �� � ��� ���������
Figure 10: Proportion of First-Time Ninth Graders Who Scored Warning on Grade 8 Math MCAS Exam by School Type (in percent)
Th ird, the proportion of fi rst-time ninth graders who were over-age each year was examined. Although the sample sizes are small for this indicator, BPS high schools had more than three times the Pilot proportion of over-age ninth graders—students who were at least two years over age as of the start of the school year.15
Table 7: Proportion of Over-age First-Time Ninth Graders by School Type (in percent)
2003 2004 2005
BPS 9.1 8.0 6.9
BPS Pilot 2.7 2.6 1.6
Th ese fi ndings show that for the three high-risk indicators examined, Pilot high schools serve a signifi cant proportion of students with the eighth-grade risk factor of warning on the math MCAS. Almost half of Pilot ninth graders scored warning on the grade 8 math MCAS, which is lower than the BPS rate. For the risk indicators of low eighth-grade attendance and being an over-age fi rst-time ninth eighth-grader, Pilot high schools enrolled lower proportions than BPS high schools.
Findings
Summary of
Whom Do Pilot High Schools Serve?
In summary, to answer the question of whom Pilot high schools serve, demographic subgroups and risk factor subgroups were examined by school type. Data on
demographic subgroups indicate that Pilot students refl ect BPS students by measures of race, eligibility for free/reduced price lunch, and mainstream special education status. Pilot high schools are intentionally increasing the proportion of students with moderate to severe special needs that they serve, with the goal of being representative of the district. Pilot high schools serve a smaller proportion of students who are English language learners.
In regard to risk factors for students entering high school, Pilot high schools serve a lower proportion of students who attended less than 80% of eighth grade and of students who are over age. Th ey serve a somewhat smaller proportion of students who scored warning on their grade 8 MCAS exams. Pilot high schools serve a signifi cant proportion of students with risk factors, but a lower proportion than the BPS average. Section I shows that Pilot high schools are serving students well by a range of
engagement and performance indicators, and that these students are outperforming their BPS counterparts on all indicators examined. Section II shows that by race, income, and mainstream special education status, Pilot high schools serve a largely representative population of students. However, they diff er from BPS high schools in the proportions of students designated as LEP and with moderate to severe special needs, as well as in the proportions of students with the three risk factors studied. A question emerges from these two sections of analysis: How much of the diff erence in engagement and performance outcomes is due to “Pilot-ness” and how much is due to diff erences in population? While we are limited in our ability to explore the impact of diff ering percentages of subgroups on the relative outcomes of school types, the remaining research questions ask how subgroups perform in each school type:
III. How are students with risk factors performing in Pilot
high schools?
IV. How are students in diff erent demographic subgroups
performing in Pilot high schools?
V. How does lottery assignment or application for admission
aff ect Pilot high school enrollment?
Findings
16 Th e research questions in sections III–V focus on BPS and Pilot high schools; exam schools are excluded from these
analyses.
III. H
OWA
RES
TUDENTS WITHR
ISKF
ACTORSP
ERFORMING INP
ILOTH
IGHS
CHOOLS?
While Pilot high schools serve a lower percentage of students with risk factors than do BPS high schools, Pilot students with risk factors fare better in high school than their BPS counterparts.
Th e prior analysis shows that Pilot high schools have a signifi cant proportion of students with risk factors, although this is lower than the BPS average. Almost half of Pilot ninth graders score warning on the grade 8 math MCAS exam. Examining gains over time of comparable groups of students in BPS and Pilot high schools is one way to understand diff erences in outcomes. How do students with the risk factor of warning on grade 8 MCAS do in Pilot high schools, as compared to BPS high schools?16 Four indicators of progress in high school, a subset of the indicators examined for the full school type aggregate analysis, were examined for students with this risk factor:
• Attendance in ninth grade
• On-time promotion from grade 9 to grade 10
• Passing grade 10 ELA MCAS exam
• Passing grade 10 math MCAS exam
First, these students’ ninth-grade mean attendance rates were calculated by school type. Pilot ninth graders who had scored warning on the grade 8 math MCAS exam consistently had higher mean attendance rates than BPS ninth graders who had scored warning on the grade 8 math MCAS exam, with a diff erence of 7–10 percentage points. If a school year is 180 days, one percentage point is 1.8 days of school; the diff erence translates to 13–18 days of school.
Table 8: Ninth-Grade Mean Attendance Rates of Students Who Scored Warning on Grade 8 Math MCAS Exam by School Type (in percent)
2003 2004 2005
BPS 83.7 83.5 82.1
BPS Pilot 93.4 91.0 88.8
Second, ninth graders who had scored warning on the grade 8 math MCAS exam were examined for on-time promotion to the tenth grade. Previously, it was shown that Pilot high schools had higher ninth-grade promotion rates overall. With this subgroup of ninth graders with the risk factor, Pilot high schools promoted students at a higher rate for the two cohorts shown. Phi was used as a measure of eff ect size in this analysis and was 0.12 for ninth graders in 2003 and 0.07 for ninth graders in 2004.
Findings
Table 9: Grade 9 Promotion Rates to Grade 10 of Students Who Scored Warning on Grade 8 Math MCAS Exam by School Type (in percent)
2003 2004
BPS 71.1 76.0
BPS Pilot 88.5 86.0
Two cohorts of high school students who had earned warning on the grade 8 math MCAS exam and took the grade 10 ELA and math MCAS exams two years later were studied. Th ese cohorts include only the students who were promoted on time. For these two cohorts of eighth graders, the proportion who passed the grade 10 MCAS exams two years later was calculated by school type. On average, Pilot high schools produced higher pass rates for students with this risk factor than BPS high schools, from 16 to 24 percentage points higher. Cramer’s V V V was used to compare pass rates in the two school was used to compare pass rates in the two school types. Eff ect sizes ranged from 0.14 to 0.19 for the ELA exam and from 0.13 to 0.14 for the math exam.
Table 10: Grade 10 ELA MCAS Exam Pass Rates of Students Who Scored Warning on Grade 8 Math MCAS Exam by School Type (in percent)
2004 2005
BPS 60.6 62.8
BPS Pilot 84.5 79.5
Table 11: Grade 10 Math MCAS Exam Pass Rates of Students Who Scored Warning on Grade 8 Math MCAS Exam by School Type (in percent)
2004 2005
BPS 52.8 50.7
BPS Pilot 72.9 70.4
Summary of
How Are Students with Risk Factors Performing in
Pilot High Schools?
In short, almost half of Pilot School ninth graders and more than half of the BPS ninth graders scored warning on the grade 8 math MCAS exam. An analysis of students with this risk factor shows that these students make greater progress in Pilot high schools than in BPS high schools on all four of the engagement and performance indicators studied.
Findings
IV. H
OWA
RES
TUDENTS IND
IFFERENTD
EMOGRAPHICS
UBGROUPSP
ERFORMING INP
ILOTH
IGHS
CHOOLS?
Overall, within each race and income subgroup, Pilot students outperform BPS students. For the diff erences that do exist between subgroups (such as White/Black and White/Latino), Pilot high school diff erences in racial subgroups have reduced over time, and by the end of the four-year period are smaller than BPS high school diff erences. Pilot high school diff erences in income- level subgroups have fl uctuated over time. Diff erences in BPS and Pilot high school MCAS pass rates could not be accounted for by greater proportions of English language learners and students with moderate to severe special needs enrolled in BPS high schools.
Pilot high schools are diverse, each school serving diff erent proportions of the demographic subgroups listed in Table 5 (see Appendix 5 for individual school proportions). However, as a Network, they serve the race and income demographic subgroups in similar proportions to BPS. Subgroup performance in Pilot high schools as compared to BPS high schools and diff erences in subgroup performance in each school type were analyzed.
Prior research has concluded that historically underserved groups fare more poorly than White students and those ineligible for free/reduced-price lunch in engagement and performance (Coleman et al., 1966; Lee, 2002). We examine three pairings in all school types: White/Black, White/Latino, ineligible/eligible for free or reduced-price lunch (Snipes, 2007). American Indians are underrepresented in some school types and therefore not included in the analysis; Asians in BPS consistently outperform the other racial subgroups on MCAS exams and therefore are also excluded.
Differences in MCAS Pass Rates by Racial Subgroup Have
Narrowed over Time
Th e four-year tables presented below show that all racial subgroups in Pilot high schools do better than their BPS counterparts for pass rates in 22 of the 24 data points over this period.
Diff erences were computed between Whites and Blacks/Latinos for both ELA and math MCAS exam pass rates. Diff erences exist between subgroups in both school types. Th e data for these four years show that White/Black and White/Latino diff erences in pass rates have narrowed in Pilot high schools, while almost all of those in BPS have stayed the same or increased. In the fi rst year of analysis, Pilot high school diff erences in pass rates between subgroups were greater than BPS high school diff erences. By the fi nal year of data available, the diff erences between subgroups in Pilot high schools are all smaller than the diff erences in BPS schools.
Findings
Table 12: White/Black Comparison in Grade 10 ELA MCAS Exam Pass Rates over Four Years (in percent)
Year BlackBPS BPS Pilot Black WhiteBPS BPS PilotWhite (White – Black)BPS Diff erence Diff erenceBPS Pilot (White – Black)
2002 49.7 78.7 64.8 97.9 15.1 19.2
2003 66.6 68.5 72.2 85.8 5.6 17.3
2004 56.6 77.5 71.7 88.4 15.1 10.9
2005 57.6 79.6 75.8 93 18.2 13.4
Table 13: White/Latino Comparison in Grade 10 ELA MCAS Exam Pass Rates over Four Years (in percent)
Year LatinoBPS BPS PilotLatino WhiteBPS BPS PilotWhite (White − Latino)BPS Diff erence Diff erenceBPS Pilot (White − Latino)
2002 50.2 74.4 64.8 97.9 14.6 23.5
2003 65.9 73.5 72.2 85.8 6.3 12.3
2004 55.2 80 71.7 88.4 16.5 8.4
2005 56.5 81.9 75.8 93 19.3 11.1
Table 14: White/Black Comparison in Grade 10 Math MCAS Exam Pass Rates over Four Years (in percent)
Year BlackBPS BPS PilotBlack WhiteBPS BPS PilotWhite (White − Black)BPS Diff erence Diff erenceBPS Pilot (White − Black)
2002 34.2 52 46.4 90 12.2 38
2003 58.4 53.4 64.5 72.8 6.1 19.4
2004 59 68.5 67.5 91 8.5 22.5
2005 46.7 67.1 61 75.5 14.3 8.4
Table 15: White/Latino Comparison in Grade 10 Math MCAS Exam Pass Rates over Four Years (in percent)
Year LatinoBPS BPS PilotLatino WhiteBPS BPS PilotWhite (White − Latino)BPS Diff erence Diff erenceBPS Pilot (White − Latino)
2002 35.2 55.6 46.4 90 11.2 34.4
2003 59.2 57.1 64.5 72.8 5.3 15.7
2004 59.6 69.2 67.5 91 7.9 21.8
Findings
Differences in MCAS Pass Rates by Income-Level Subgroup
Fluctuate over Time
Eligibility for free/reduced-price lunch is used as an indicator of household income level, even though this indicator does not take into account several important variables: the eff ect of concentrated poverty; the fact that some eligible families do not apply; and the wide range of family income among those eligible under federal guidelines (Kurki, Boyle, and Aladjem, 2005). Because other measures of socioeconomic status, such as neighborhood poverty level or level of concentrated poverty, are unavailable, eligibility for free/reduced-price lunch is used as a proxy. Among Pilot high school students, 68.4% are eligible for free/reduced-price lunch, compared with 69.8% of BPS high school students. Pilot high school students eligible for free/reduced-price lunch outperform those in BPS every year in both MCAS exams, except for 2003 math. Pilot students not eligible for free/reduced-price lunch outperform their counterparts in BPS every year on both MCAS exams.
Pilot students not eligible for free/reduced-price lunch outperform those who are eligible in both tests for all four years. Th ere persists a gap in both ELA and math that does not exist in BPS schools. Interestingly, BPS students who are eligible for free/reduced-price lunch almost always do better than those who are ineligible. Th is fi nding stands in contrast to many research studies that link poverty to poorer student achievement (Adams, 1994; Grinion, 1999) and should be further investigated.
Table 16: Ineligible/Eligible for Free/Reduced-Price Lunch Comparison in Grade 10 ELA MCAS Exam Pass Rates over Four Years (in percent)
ELA EligibleBPS BPS PilotEligible IneligibleBPS IneligibleBPS Pilot BPS Diff erence (Ineligible − Eligible BPS Pilot Diff erence (Ineligible − Eligible 2002 51.7 77 52.3 86.3 0.6 9.3 2003 68.9 70.4 64.9 76 -4.0 5.6 2004 57.9 79.5 57.1 79.9 -0.8 0.4 2005 60 80.3 58.4 87.8 -1.6 7.5
Table 17: Ineligible/Eligible for Free/Reduced-Price Lunch Comparison in Grade 10 Math MCAS Exam Pass Rates over Four Years (in percent)
Math EligibleBPS BPS PilotEligible IneligibleBPS IneligibleBPS Pilot BPS Diff erence (Ineligible − Eligible BPS Pilot Diff erence (Ineligible − Eligible 2002 39.2 55.3 34 63.2 -5.2 7.9 2003 61.5 56.7 57.1 59.8 -4.4 3.1 2004 62.2 70.7 58.2 75.9 -4.0 5.2 2005 53.6 69 48 74.1 -5.6 5.1