Performance Analysis of Dual Core, Core 2 Duo
and Core i3 Intel Processor
Taiwo O. Ojeyinka
Department of Computer Science, Adekunle Ajasin University, Akungba-AkokoOndo State, Nigeria.
Olusola Olajide Ajayi
Department of Computer Science Adekunle Ajasin University, Akungba-AkokoOndo State, Nigeria.
ABSTRACT
Performance analysis is a more efficient method of improving processor performance. This research work discusses heavily on performance analysis of Dual Core, Core 2 Duo and Core i3 Intel architectures. The study described the evolution of Intel architectures and gave the reason for testing the performances of the systems. All experiment will be carried out using Intel VTune Performance Analyzer, with all the systems running on Windows 7 and 8. It is a well-known fact that, overall performance is a major function of: path length of the application, frequency, and cycle per instruction. Based on the analysis from this research, it was confirmed that, Corei3 has two distinct advantages: faster core-to-core communication, and dynamic cache sharing between cores. The research also highlights other areas where Dual Core and Core 2 Duo can be preferred architectures over Core i3.
General Terms
System performance evaluation.
Keywords
Performance, Multi-core, Processor, Microarcitecture.
1. INTRODUCTION
With the evolution of Intel processor architecture over time, most customer (buyers) of Intel architecture don’t really have time to test and analyse the architecture before they purchase it for their various day to day use. In a nutshell, people have not being able to analyse the differences in the architectures before purchase. Testing performance of computer system is very necessary, because it helps consumers decide what type and configurations of products to purchase for a particular nature of computing job. However, the performance is strongly dependent on a number of factors which include the system architecture, processor microarchitecture, operating systems, type of compiler, and program implementation etc. Many processor manufacturers including Intel has performance analysis tools which can be used to determine the performance of their architecture. Intel Corporation produces different processors with different numbers of cores for different nature of jobs, however, it is the important for users of processor machines to acquire the right processor specifications that would efficiently process target applications based on the workloads characteristics of the application program. For instance, some specification of machine works better on graphics while others perform best on computation. With the evolution of Intel processor architectures over time, testing performance is necessary. The aim of this study is to measure the performance of different cores using different applications (both Single and Multithreaded). The objectives are 1) compare architecture performance on applications (Single and Multithreaded), 2) measure performance counters on representative processors and,
3) show methods for exploring processor architectures. One of the goals of this work is to highlight the advantages of each feature in a system and to study how the hardware makes use of CPU resources.
2. PROCESSOR MICROARCHITECTURE
2.1 The Microarchitecture of Intel Core 2
Duo
The Intel Core 2 Duo processor belongs to the Intel’s mobile core family. It is implemented by using two Intel’s Core architecture on a single die. The design of Intel Core 2 Duo is chosen to maximize performance and minimize power consumption. It emphasizes mainly on cache efficiency and does not stress on the clock frequency for high power efficiency. Although clocking at a slower rate than most of its competitors, shorter stages and wider issuing pipeline compensates the performance with higher IPC’s. In addition, the Core 2 Duo processor has more ALU units. Core 2 Duo employs Intel’s Advanced Smart Cache which is a shared L2 cache to increase the effective on-chip cache capacity [13]. Upon a miss from the core’s L1 cache, the shared L2 and the L1 of the other core are looked up in parallel before sending the request to the memory [9]. The cache block located in the other L1 cache can be fetched without off-chip traffic. Both memory controller and FSB are still located off-chip. The off-chip memory controller can adapt the new DRAM technology with the cost of longer memory access latency. Intel Advanced Smart Cache provides a peak transfer rate of 96 GB/sec (at 3 GHz frequency)
2.2 The Microarchitectures of Nehalem
Nehalem architecture is more modular than the Core architecture which makes it much more flexible and customizable to the application. The architecture really only consists of a few basic building blocks. The main blocks are a microprocessor core (with its own L2 cache), a shared L3 cache, a Quick Path Interconnect (QPI) bus controller, an integrated memory controller (IMC), and graphics core [14]. With this flexible architecture, the blocks can be configured to meet what the market demands. For example, the Bloomfield model, which is intended for a performance desktop application, has four cores, an L3 cache, one memory controller, and one QPI bus controller. Another significant improvement in the Nehalem microarchitecture involves branch prediction. For the Core architecture, Intel designed what they call a “Loop Stream Detector,” which detects loops in code execution and saves the instructions in a special buffer so they do not need to be continually fetched from cache [11]. This increased branch prediction success for loops in the code and improved performance. Intel engineers took the concept even further with the Nehalem architecture by placing the Loop Stream Detector after the decode stage eliminating the instruction decode from a loop iteration and saving CPU cycles.Fig. 1: Intel Core Microarchitectures [10]
Fig. 2: Intel Core 2 Microarchitectures [9]
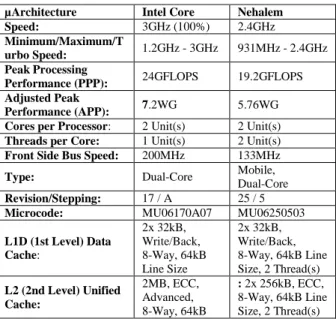
Fig. 3: Nehalem Microarchitectures [11] Table 1: Processors microarchitecture features
µArchitecture Intel Core Nehalem Speed: 3GHz (100%) 2.4GHz
Minimum/Maximum/T
urbo Speed: 1.2GHz - 3GHz 931MHz - 2.4GHz
Peak Processing
Performance (PPP): 24GFLOPS 19.2GFLOPS
Adjusted Peak
Performance (APP): 7.2WG 5.76WG Cores per Processor: 2 Unit(s) 2 Unit(s)
Threads per Core: 1 Unit(s) 2 Unit(s)
Front Side Bus Speed: 200MHz 133MHz
Type: Dual-Core Mobile, Dual-Core
Revision/Stepping: 17 / A 25 / 5
Microcode: MU06170A07 MU06250503
L1D (1st Level) Data Cache: 2x 32kB, Write/Back, 8-Way, 64kB Line Size 2x 32kB, Write/Back, 8-Way, 64kB Line Size, 2 Thread(s) L2 (2nd Level) Unified Cache: 2MB, ECC, Advanced, 8-Way, 64kB : 2x 256kB, ECC, 8-Way, 64kB Line Size, 2 Thread(s)
Line Size, 2 Thread(s) L3 (3rd Level) Unified Cache: - 3MB, ECC, Write/Back, 12-Way, Fully Inclusive, 64kB Line Size, 16 Thread(s) Memory Controller Speed: 133MHz 133MHz MMX - Multi-Media
eXtensions: Yes Yes
SSE - Streaming SIMD
Extensions: Yes Yes
SSE2 - Streaming
SIMD Extensions v2: Yes Yes
SSE3 - Streaming
SIMD Extensions v3: Yes Yes
SSSE3 - Supplemental
SSE3: Yes Yes
Hyper-Threading
Technology No Yes
Intel released the Nehalem and it was a leap in performance and efficiency compared to previous architectures designs, though still lagging in gamming performance compared to Core 2 Duo [8] which dozens of review testifying to that fact.
Fig. 4: Instruction execution cycles in Core-based and Nehalem CPUs [17]
The goal of performance analysis is to understand the behaviour of an application on a given platform. Here, real world applications are used to test how hardware makes use of the resources of CPU. The researchers want to know the advantage of each machine parameter, the program hotspots, and the effects of each hardware feature program.
VTune Analysis
VTune Analyser [4] is an application performance monitoring and analysis profiler that is capable of analysis execution bottlenecks in both serial and parallel programs. It is used to analyse executing programs on particular hardware and provides resources that helps user identify hotspost and provides insights into the part of the program where the application can benefit for performance gains. VTune uses Call Graphs to display graphically display the programs control flow. The Tunning Assistant makes suggestions on the optimization methodologies and how the application can efficiently utilize the hardware recourses [6]. The tool enables users to analyse locks and waits and identify hardware issues thereby giving opportunities to analyse the performance of the system.
Choose Target Run Analysis Interpret Result Configure Target Compare Results Create Configuration Configure Analysis Interpret Results Handle Results RESOLVE ISSUES WORK FLOW
Fig. 6: Work flow in VTune Analyser [6]
3. BENCHMARK ANALYSIS METHOD
In this project work, we used VTune performance analysis tool offered by Intel to measure the performances of Pentium Core 2 DUO, Intel Dual Core and the Nehalem Core i3 on five different benchmarks: VLC, Mcbench, Max Pi, Firefox, and Cinebench. The data of CPI in all of the analysis are analysed for the sake of completeness.3.1 Hardware Event Counts
Hardware Event Counts is a performance metric used by the Intel VTune Amplifier XE [6] when interpreting event-based sampling analysis results. The Hardware Event Counts metric shows the event count for all collected processor events. While the Hardware Sample Counts metric provides the actual number of samples collected for an event, Hardware Event Counts metric estimates the number of times this event occurred during the analysis [16]. We will focus on examining comparable aspect of all these microprocessor with Hardware Event Counts: Such as Clockticks per Instructions (CPI), LLC Misses, Branch Mispredict, Instruction Starvation etc.
3.2 CPI (Clockticks per Instructions) Retired
CPI is just a general metric for measuring the processor efficiency [5]. The CPI value is dependent on application workload and platform and can be best used as a factor to compare processors. Since CPI is a ratio that is dependent on the number of retired instructions, its value will change if the binary code size of the application changes. In general, if CPI reduces as a result ofThe CPI measured in Dual Core and Core 2 Duo are “Per Core CPI” because there was no SMT. In this case, the instructions were generally executed by the two cores. The aggregate CPIs is the sum of all logical cores or logical threads per processor.
3.3 LLC Misses
The LLC Misses refer to the ratio of instruction misses to the total number of instructions to the cache. This ratio typically depends on the size of cache, the cache replacement and write policies and the size of n and the total number of n for a n-block cache. A memory load MISS at the LLC implies that such load will be obtained from the memory. By running the same application on different processors, a LLC Miss Impact can be used to compare the efficiency of last level cache in each of the processors. Loads can only come from memory if data in LLC cache has been replaced.
3.4 Branch Misprediction
This metric evolves from the impact caused to the Front-End mispredicted a branch by not the number of mispredictions made by a given processor on an application. Each time a misprediction on the target of branch operation occurs, the micro-operations including all subsequently misprected operations are flushed and the Front-End is re-directed to begin fetching instructions from the correct target. Mispredicted micro-operations are cancelled when it is discovered in the Back-End at the time the branch operation is executed. Event: INST_RETIRED.MISPRED /
BR_INST_RETIRED.ANY
3.5 Instruction Starvation
The metric measures instruction stalls which fail to deliver to the front-end. This could be due to misses at L2 cache, or the result of mispredictions in which some instructions fail to reach the pipeline. This event counts the number of cycles for which the front-end is starved of instructions.
3.6 Instructions Retired
This metric counts the number of instructions whose executions were retired. The counts includes micro-ops that for executions including those consisting of traps, exceptions, interrupts and within the interrupt handlers. For multi-ops instructions, the metric counts the retirement of the last one
4. EXPERIMENTAL SETUP
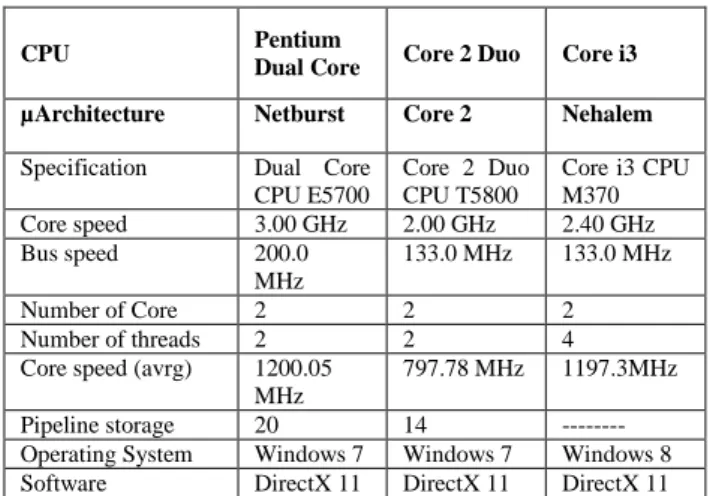
Tests were performed with benchmarks that cut across different fields; using bespoke software may not be appropriate since it targeted towards special purpose applications. The five benchmarks used to evaluate performance are windows executable files as follows: VLC (multimedia), McBench, MaxPI (computation), Firefox 14 (Web surfing) and CineBench 11 (Graphics) all. This experiment is setup based on Intel microarchitecture; three processors: Intel Pentium Dual Core, Intel Core 2 Duo and Intel Core i3 were analysed. Their specifications is as follows. All experiments were carried out using Intel VTune performance analyser using Intel Pentium R Dual Core, Core 2 Duo and Intel Core i3, all running on Ubuntu Linux, Windows 7 and Windows 8 operating systems. Performance analysis is measured by running specific applications on Dual Core CPU, Core 2 Duo and Nehalem (Core i3) micoarchitecture. The performance of each application (either single threaded or multithreaded) was analysed on different architectures.
Table 2: Configuration of system architecture
CPU Pentium
Dual Core Core 2 Duo Core i3 µArchitecture Netburst Core 2 Nehalem
Specification Dual Core CPU E5700 Core 2 Duo CPU T5800 Core i3 CPU M370 Core speed 3.00 GHz 2.00 GHz 2.40 GHz Bus speed 200.0 MHz 133.0 MHz 133.0 MHz Number of Core 2 2 2 Number of threads 2 2 4 Core speed (avrg) 1200.05
MHz
797.78 MHz 1197.3MHz
Pipeline storage 20 14 --- Operating System Windows 7 Windows 7 Windows 8 Software DirectX 11 DirectX 11 DirectX 11
The tools used are Intel VTune Amplifier XE 2013 and we run all our analysis on Windows Operating System.
5. RESULTS
It is good to know the cause of performance bottlenecks among benchmarks and to do so; an analyser (performance monitor) has to be used. It is often said that the best tool that a programmers has is his brain and his best friend is a performance monitor. For many applications, performance can be an advantage. To get better understanding of the bottlenecks of these benchmarks, the Cycle Per Instruction (CPI), Instruction Retired, LLC misses, Instruction Starvation and Branch Instruction Misprediction were measured and analysed.
Fig. 7a: Relative degree of CPI retired for each benchmark
Fig. 7b: CPI rate with increasing workload
Fig. 8b: LLC Miss rate with increasing workload
Fig. 9a: Relative degree of Instruction Starvation for each benchmark.
Fig. 9b: Instruction Starvation with increasing workload
Fig. 10a: Relative degree of Branch Misprediction for each benchmark.
Fig. 10b: Instruction Starvation with increasing workload
Fig. 11a: Instruction Retired for each benchmark
Fig. 11a: Instruction Retired with increasing workload
6. DISCUSSIONS ON RESULTS
6.1 Clockticks Per Instructions (CPI) Rate
Using cycle per instruction could be said to be the metrics to measure the performance of a computer, hence using these three architecture as an example i.e. Dual Core, Core 2 and Core i3, its outcome is not accurate, because processors with hyper-threading enabled usually have problem with CPI rate because the CPI rate counts even when no instruction is executed since one or two of the processors is/are still working, compared to Dual Core and Core 2 DUO when no instruction is being executed.From the results, though it should be expected of core i3 to have a fewer CPI rate which indicate better performance but the reverse was the case. Here Core 2 DUO out-performed Core i3 and Dual Core while in McBench, and Cinebench, Core i3 performed very poorly. Lower CPI indicate higher performance. Here, despite the numbers of cores Core i3 still indicates poor
performance, though not poor in reality, the reason for high CPI rate has been for the fact that processors with Intel Hyper-Threading Technology measures the CPI for the phases where the physical package is not in any sleep mode, that is, at least one logical processor in the physical package is in use. It is noted that non retired instructions due to branch mispredictions and instruction starvation in the frontend tend to pull the CPI up. CPI of 1 is generally considered acceptable for HPC applications but different application domain will have different values. Nonetheless, CPI remains a good metric when measuring overall performance analysis.
In general Core 2 Duo has a lower CPI, indicating higher performance probably because VLC, Cinebench are both graphic based software but for McBench it is hard to explain.
6.2 LLC Miss
How often LLC is accessed is a function of L2 cache miss rates for Core i3 and L1 cache miss rates for core 2 Duo and Dual Core, since Core i3 has 3 level caches while Core 2 Duo and Dual Core has 2 level caches each. Core i3 really has an advantage of not having cache misses in all the program runs. For VLC, Core 2 Duo has the highest LLC misses of 0.112 while Dual Core has 0.073. Moving to McBench the reverse was the case, Core 2 Duo has 0.18 while Dual Core has 02. This is the only place where Core 2 Duo has advantage over Dual Core. For Firefox and Cinebench, Dual Core takes the lead by having fewer LLC misses. This advantage can be traced to dual core 3.0 GHz frequency while for Core 2 Duo the frequency is 2.0 GHz. Since both has same 8-way set-associative L1 data, LI instruction and L2 shared cache size.
Core i3 has advantages over both Core 2 Duo and Dual Core because it has level 3 cache which gives access to instructions exclusive of the remote memory.
6.3 Instruction Starvation
Following the analysis of branch misprediction which can result in instruction starvation, our expectation is accurate with the outcome of the result.
For VLC, there is about 42% starvation for Core 2 Duo while Dual Core has the highest percentage of about 89% instruction starvation and Core i3 stays under 20%starvation for instruction. These agrees with the result observed from branch misprediction nothing that when branch is mispredicted, the pipelines are flushed and no instructions are executed.
For McBench and MaxPI , Core 2 Duo has instruction starvation of 0.003 and 0.089 respectively which is about 40% jump from where it was before. Core 2 duo experienced its highest instruction starvation on MaxPI which agrees with the rule of thumb that branch mispredict leads to flushing of the pipeline which in turn leads to instruction starvation.
Core i3 experienced instruction starvation only on VLC which is 0.036 which is less than 20%, Dual Core experienced the highest instruction on VLC and Firefox which are 0.138 and 0.119 respectively and it was starved of instruction for McBench where there was no branch misprediction; this result can be a bit confusing but only the architect of the micro architecture can explain better.
For Cinebench, Core i3 has no starvation as earlier said while Core 2 Duo and Dual Core has 0.024 and 0.037 respectively. On the overall, Core i3 outperformed Core 2 Duo and Dual Core with about an average of 60% performance gap.
6.4 Branch Misprediction
Data obtained from VTune Analysis is consistent with the expectation. Core i3 has fewer branch mispredicted overall which indicate better performance. Core i3, as shown in the figure, has misprediction under 0.035 for all the workload measured, while Core 2 Duo and Dual Core stay under 0.26. From VLC workload, Core i3 has 0.03 which is the highest mispredicted branch, it has overall amongst all the workload while Core 2 Duo and Dual Core show very high prediction miss of 0.25 and 0.26 respectively. In McBench workload only Dual Core has mispredicted branch of about 1% while other has none, it is due to peculiarity of the software and its response to hardware. For Max PI program, mispredicted branch number drop to 0% for Dual Core while that of core 2 DUO experienced its highest misprediction of 0.26, the sudden change is suggested to be due to the the data structure. For Firefox and Cinebench, Core i3 still maintains branch misprediction less than 5% while Dual Core and Core 2 Duo range from 55% - 60%.
6.5 Instruction Retired
Most data used here are already being normalized by itself, this data is not shrewd so we advise that reader should not read too much into the graph. The variation (degree of differences) between the bars of the graph is due to increase in load on the CPI while running Cinebench. The graph is not so important without proper explanation. From the analysis of Instruction Retired, all the three processors have almost the same count. So it may not be necessary for comparison.
7. RELATED WORKS
7.1
Performance analysis of core 2 and k8:
(Aaron Kanter).
Here Kanter used Vtune to analyze the Intel architecture and also use Code Analyst for AMD [9]. Benchmarks were run manually (i.e. with no scripting) on 2.93GHz k8 AMD and Core 2 Duo CPUs to calculate the overhead for event based sampling, which was determined to be relatively minor. Each benchmark was run once without any sampling. Result was calculated based on actual event-based sampling data with 1 kHz resolution (sampling every 1ms) at that point. The methods for using VTune and CodeAnalyst took a radically different turn due to some feature different in VTune and CodeAnalyst. The benchmark used here were game which has the option of minimal graphical settings to minimize GPU involvement and focus on CPU events and which can operate at high graphical setting to emulate ‘’real life’’ situation that focus more on GPU, Kanter argues that performance is a function of three variable: operation length of the application; processor frequency and cycles per instruction; which is the best metric for overall micro architecture performance.
In Kanter’s analysis, both processors were not measured with the same tool and the tools were not designed the same way. Since the tools work differently, it is possible for vendors to be bias towards a tool in order to sell their products. The performance analysis tool used in both processes were not the same and as such there could be differences in the performance analysis of the processors. Kanter’s work shows that Performance analysis tools can be very tricky due to inconsistent results between tools in measuring cache access instructions.
7.2 Performance Analysis of Intel Core2 Duo
Processor
:
(Tribuvan Kuman Prakash)
Kuman [18] focused on workload characteristics, memory system, behaviour and multithread interaction of the benchmark. Kumar’s experiments were run using window XP2 operating system with 32 bit and Core 2 Duo processor with Intel VTune Performance Analyser which analyse certain number of event depending on the configuration. Hence, several complete runs were made to measure all event. The testing method was similar to Kantar’s. In Prakash’s results, the Core 2 Duo L2 cache was found to be effective with about 50% fewer misses per instruction returned for the analysis. The analyser was implemented on two or more operating systems because the hardware responded to operating systems differently.
8. CONCLUSION
Testing processor performance is necessary as it helps consumers decide what products to purchase for a particular nature of job. So also, the processor designers should improve on the hardware design since better understanding of the performance will give better design. The overall performance is a major function of three variables; Path length of the application, processor frequency and the cycle per instruction (CPI) [9]. However, the CPI cycle per instruction is the best metric for overall micro architecture performance. Though the CPI for this analysis was discarded due to issues of Vtune Analyser with hyper threading enabled system which a huge time was taken to explain in the previous chapter. Performance analysis tools can be very tricky, Yet other metric were used in its place. Core i3 branch predictor is far more accurate, this is unsurprising since Intel has invested huge on microarchitecture. Another interesting factors is the substantial difference in miss rates between these cache designs, Core i3 has advantage over Core 2 Duo and Dual Core because it has level 3 cache indicating the factor that enables it to have fewer or no LLC miss all through the analysis.
9. REFERENCES
[1] Casazza J. First the Tick, Now the Tock: Intel Microarchitecture (Nehalem). Intel Corporation. White Paper, Intel Xeon processor 3500 and 5500 series Intel Microarchitecture.
[2] EPSRC. STFC Rutherford Appleton Laboratory. http://www.softeng-support.ac.uk/
[3] Gprof. http://www.gnu.org/software/binutils/binutils.html [4] Intel Corporation. About Performance Analysis with
VTune Amplifier Intel Developer Zone. https://software.intel.com/
[5] Intel Corporation. Microarchitecture and Platform Analysis Intel Corporation. Intel Developer Zone. https://software.intel.com/
[6] Intel Corporation. Intel VTune™ Performance Analyzer. http://www3.intel.com/cd/software/products/asmona/ [7] Intel® 64 and IA-32 Architectures Software Developer's
Manual, Volume 3B: System Programming Guide, Part 2. [8] Intel® What If site. http://Whatif.intel.com
[9] Kanter A. 2008. Performance Analysis for Core 2 and 8:
Part 1. http://www.realworldtech.com/cpu-perf-analysis/ [10]Kanter D. 2006. Intel’s Merom Unveiled.
http://www.realworldtech.com/merom/
[11]Kanter D. 2008. Inside Nehalem: Intel’s Future Processor and System. http://www.realworldtech.com/nehalem/
[12]Levinthal D., Execution-based Cycle Accounting on Intel Core 2 Processors.
[13]Levinthal D., Introduction to Performance Analysis on Intel Core 2 Duo Processors.
[14]Levinthal D., Performance Analysis Guide for Intel® Core™ i7 Processor and Intel® Xeon™ 5500 processors. [15]Open MP standard. http://www.openmp.org
[16]Parallelization Made Easier with Intel® Performance-Tuning Utility. Intel Technology Journal, Volume 11 Issue 04 Published, November 15, 2007 ISSN 1535-864X DOI: 10.1535/itj.1104.02
[17]Thomadakis M. E. The architecture of the Nehalem processor and Nehalem-EP SMP platforms. Technical
report, December 2010.
http://sc.tamu.edu/systems/eos/nehalem.pdf.
[18]Tribuvan Kumar Prakash, Performance analysis of Intel Core 2 Duo processor. BioPerf, August, 2007.
![Fig. 6: Work flow in VTune Analyser [6]](https://thumb-us.123doks.com/thumbv2/123dok_us/9691434.2457958/3.892.83.427.107.416/fig-work-flow-vtune-analyser.webp)