2014
L
EGISLATIVE
R
EPORT ON
THE
S
KILLS FOR
J
OBS
A
CT
J
ANUARY2014
1560 Broadway, Suite 1600Denver, Colorado 80204(303) 866-2723 LT.GOVERNOR JOSEPH GARCIA,EXECUTIVE DIRECTOR
FY2013-14 Colorado Skills for Jobs Report Page 2 Table of Contents Introduction 5 Highlights 6 National Trends 6
Colorado’s Supply and Demand for Educated and Trained Workers 7
Figure 1: Colorado’s Current Educational Attainment and Projected Job Requirements 8 Figure 2: Colorado’s Student Pipeline 9
Figure 3: Colorado Average Annual Growth Rates 9
Projected Demand by Occupational Classification 10
Table 1: Top 30 Occupations with Highest Projected Openings with More than Half of Workers with Postsecondary Experience 11
A Closer Look at High Demand Occupation Groups 14
Registered Nurses, Nursing Assistants, Licensed Practical and Vocational Nurses and Medical Assistants 14
Table 2: Openings and Completions for High Demand Healthcare Practitioners and Support Occupations 14
Computer-related Occupations 15
Table 3: Openings and Completions for Computer-related Occupations 16
K-12 Educators 16
Table 4: Openings and Completions for K-12 Educators 16
Figure 4: K-12 Educator Preparation Completions (2012) by County 17
Occupational Demand by Credential Level 18
Mid-level 19
Figure 5: Mid-level Completions for Occupational Categories Not Meeting Projected Annual Demand for Mid-level Occupations 19
Bachelor’s Level 20
Figure 6: Bachelor’s Level Completions for Occupational Categories Not Meeting Projected Annual Demand for Bachelor’s Level Occupations 21
Graduate Level 21
Figure 7: Graduate Level Completions for Occupational Categories Not Meeting Projected Annual Demand for Graduate Level Occupations 22
Two and Four Year Public Institution Profiles 22
FY2013-14 Colorado Skills for Jobs Report Page 3
Figure 9: Map of Sector Partnerships by Region 24
Recommendations 25
References 29
Appendix A: Technical Information 30
FY2013-14 Colorado Skills for Jobs Report Page 4
This report was prepared by The Colorado Department of Higher Education (DHE) pursuant to the requirements of §23-1-130 Colorado Revised Statutes.
For more information please contact:
Dr. Lauren Victor, Research Officer at the Colorado Department of Higher Education, at 303-866-2363 or by email at [email protected]
FY2013-14 Colorado Skills for Jobs Report Page 5
Introduction
As Colorado continues to grow and evolve, it is important for our state to have a nuanced understanding of economic and educational forces, and to be able to meet the educational and training needs of individuals and the demands of the state’s economy. In light of the Great Recession, the increasing cost of postsecondary education for the consumer, and a decade of wage stagnation for the majority of workers, the public and policy makers alike want to make informed decisions regarding the roles of postsecondary training and education in their lives and communities. While this report acknowledges recent postsecondary education and workforce patterns, its focus lies more on forecasts connecting postsecondary credential production and workforce needs. In turn, we hope this report sheds light on pressing concerns such as: Can college graduates find gainful employment? Are colleges and universities producing credentials that align with job vacancies and employers’ needs? This report provides insight into how we can help position our citizenry for steady, rewarding employment while meeting the economic needs of our state.
Pursuant to statute (23-1-130 C.R.S.), the Colorado Department of Higher Education (DHE), in consultation with the Department of Labor and Employment and the Department of Regulatory Agencies, is required to submit a report concerning the state workforce need projections and credential production. In fulfillment of this requirement, this report identifies trends in the state’s anticipated workforce needs and the number of degrees, certificates, and other credentials that have been or are expected to be produced. This report will be submitted to the Education Committees of the Senate and House of Representatives, the Economic and Business Development Committee of the House of Representatives, the Business, Labor, and Technology Committee of the Senate, and the Governor. Additionally, it will be sent to every public postsecondary governing board and be made available through the Department of Education to the state’s public, private, and charter schools and districts, as well as be publicly available on the DHE website.
This report covers the following:
Outlines national trends regarding postsecondary education and workforce needs, alongside Colorado-specific facts and figures.
Assesses the state’s anticipated workforce needs and the number of degrees, certificates, and other credentials that institutions expect to issue.
Identifies workforce needs, at the macro level, which may or may not be met through postsecondary educational offerings in Colorado.
In presenting our analysis of these issues for our state, we highlight Colorado jobs with high expected annual openings from 2012 to 2020 that likely require postsecondary training, alongside related postsecondary award/degree completions. We then highlight three occupation groups as way to delve deeper into the nuances of these supply-demand relationships. Furthermore, we present findings on apparent shortages for specific occupation groups by credential level (mid-level or awards akin to certificates or associate’s degrees, bachelor’s level and graduate level).
FY2013-14 Colorado Skills for Jobs Report Page 6
Certainly, a report such as this has its limitations in scope. While we do orient this report as a statewide analysis, we recognize that unique regional trends exist. Region-specific briefs will be issued throughout 2014. In addition, a report focused specifically on Science, Technology, Engineering and Mathematics (STEM) program completions and related occupations will be issued this year to examine the nuances that exist in supply-demand relationships in STEM fields.
Highlights
Experts project that by 2020, 74 percent of jobs in Colorado will require postsecondary education (Carnevale, Smith & Strohl, 2013).
Colorado is ranked third nationally in terms of the percentage of jobs projected to require postsecondary education/training for employment.
The state unemployment rate is considerably lower for people who have a postsecondary credential than for those who have a high school degree or less. This gap has continued to widen over the past decade.
In 2012, public institutions in Colorado awarded 49,739 certificates and degrees, an impressive 8.7 percent increase from the year prior. Since 2007, postsecondary completions have seen an average annual growth rate of 5.6 percent.
As more jobs require higher levels of education in the years to come, we will likely need to increase our postsecondary credential production by about two percent, or 1,000 additional credentials, annually.
While we are likely meeting the demand for healthcare support and practitioners overall at the mid- and bachelor’s level required occupations, we are at risk of an undersupply of professional level practitioners (i.e., physicians).
Across STEM professions, program completions are meeting the demand for most occupation clusters. However, in order to meet projected demand for certain occupation categories, we need to increase completions for mid-level and bachelor’s level computer science credentials.
For skilled trades, manufacturing and production occupation groups, there are likely too few completions for certain occupations within this overall category.
National Trends
In recent years there has been a nationwide surge of research, reports and media attention surrounding postsecondary education and employment. Both the educational and economic landscapes of our country have shifted considerably in recent history, as the job market has developed an increasing need for the college-educated worker since the 1970s. However, other developed countries have surpassed the United States in the percentage of adults with a college degree, as we now rank 12th out of 36 member nations of the Organization for Economic Co-operation and Development (OECD), with 43 percent of our young adult workforce (ages 25-34) holding an associate’s degrees or higher (OECD, 2013). Nationwide, it has been projected that by 2020, 65 percentof all jobs will require postsecondary education (Carnevale, Smith & Strohl, 2013). Colorado’s projected workforce requirements even exceed the national average with 74
FY2013-14 Colorado Skills for Jobs Report Page 7
percent of all jobs requiring some level of postsecondary education/training by 2020. In fact, Colorado ranks third nationally in terms of our postsecondary training needs (Carnevale et al., 2013).
The national and Colorado-based conversations on workforce readiness and fulfilling employer’s workforce needs have begun to recognize the imperative to shift perspectives on long held assumptions and biases towards different kinds of postsecondary education, and the pathways to supporting the success of our citizenry. According to research from Georgetown University’s Center on Education and the Workforce on nationwide trends, when the projected postsecondary credential requirements for jobs in 2020 are more specifically defined, 36 percent of jobs will demand a baccalaureate degree or higher, while 30 percent will require a lesser degree of postsecondary training akin to an associate’s degree or certificate award (Carnevale et al., 2013). Ultimately, at the individual and state level, we all benefit from a well-educated workforce. Education supports an individual’s employability and economic security. That individual can then afford to engage in the local economy through purchasing goods and services and paying taxes. Furthermore, during economic downturns, those with lower levels of educational attainment experience the most significant declines in employment and greater wage deterioration (Grusky, Red Bird, Rodrigues & Wimer, 2013), indicating one such way that a postsecondary education can often serve as an economic shield. We are at an interesting crossroads for our state’s economy, as we are returning to pre-recession employment figures and have an opportunity to build upon and exceed previous economic accomplishments. This report and the 2013 College Measures report published in consultation with the Colorado Department of Higher Education, together with greater inter-agency collaboration, will enable us to more strategically support educational pathways and programs that fulfill the needs of our state’s citizens and workforce.
Colorado’s Supply and Demand for Educated and Trained Workers
Colorado’s economy is steadily growing, with nearly 2.6 million people currently employed in the state and an unemployment rate that has recently descended below seven percent, a decrease of one percent since 2012 (BLS, 2013). Demonstrating the demand for trained workers, American Community Survey (2011) data show that
unemployment rates are considerably lower for people with a postsecondary credential as compared to those without any postsecondary educational experience. According to these data, unemployment in Colorado hovers at 8 percent for people with some college or an associate’s degree, and at 4.5 percent for someone with a bachelor’s degree or higher for 25 to 64 year olds— demonstrably lower than the unemployment rate for high school graduates (10.7 percent) and for those with less than a high school education (13.5 percent).
Further evidence of the demand for postsecondary training across the nation is demonstrated through the significant wage premium for degree holders: while degree holders have increased in
…unemployment rates
are considerably lower for
people with a
postsecondary credential
as compared to those
without any postsecondary
FY2013-14 Colorado Skills for Jobs Report Page 8
numbers, they still are likely insufficient to meet labor market demands (Carnevale, Jayasundera & Cheah, 2012).
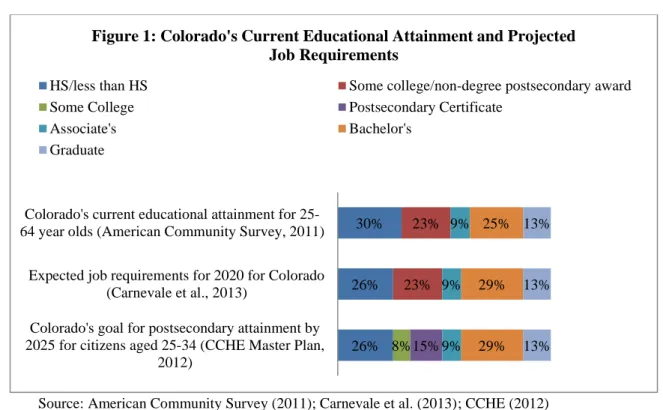
When we look at the educational gap between our state’s current educational attainment for 25 to 64 year olds and the projected job requirements by 2020 (Figure 1), the difference does not seem so great in terms of percentage points of postsecondary degree holders, and we as a state are making progress in achieving the educational goals of our state—momentum we must strive to maintain. However, there are a series of elements that significantly impact this data that are important to remember.
Source: American Community Survey (2011); Carnevale et al. (2013); CCHE (2012)
First, let’s translate percentages into absolute figures. In taking 25 percent of our state’s 2011 population of ages 25 to 64 we would have about 693,924 bachelor’s degree holders. At a population growth rate that hovers around 1.6 percent, in 2020, 29 percent of Coloradans ages 25 to 64 equals 892,435. This is an increase of nearly 200,000 bachelor’s degree holders. While this is an achievable goal, we must also consider that the workforce loses older degree holders to retirement each year, even though labor force participation rates continue to increase for our retirement age population. The category of “some college/non-degree postsecondary award” is admittedly rather nebulous and difficult to measure specifically as it includes a range of people, from those who do not complete the requirements for any type of postsecondary program to those who complete a one- or two-year certificate program, for example.
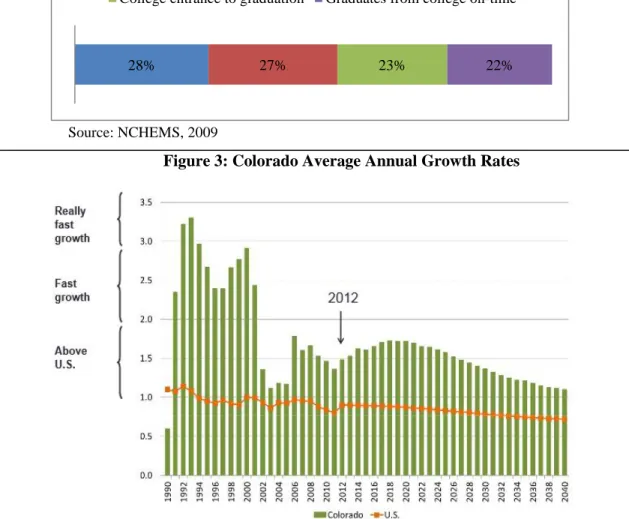
Our state also experiences what is commonly known as the “Colorado Paradox,” by which transplants who move here from other states tend to already have a postsecondary credential, thus significantly impacting the state’s overall levels of college graduates, while Colorado high school graduates are less likely to complete a college certificate or degree program. We can see from Figure 3 that although our state will continue to grow, by the end of this decade our growth
26% 26% 30% 23% 23% 8% 15% 9% 9% 9% 29% 29% 25% 13% 13% 13%
Colorado's goal for postsecondary attainment by 2025 for citizens aged 25-34 (CCHE Master Plan,
2012)
Expected job requirements for 2020 for Colorado (Carnevale et al., 2013)
Colorado's current educational attainment for 25-64 year olds (American Community Survey, 2011)
Figure 1: Colorado's Current Educational Attainment and Projected Job Requirements
HS/less than HS Some college/non-degree postsecondary award
Some College Postsecondary Certificate
Associate's Bachelor's
FY2013-14 Colorado Skills for Jobs Report Page 9
rate will begin to decline to a rate far lower than those seen throughout the dramatic growth and economic development in the 1990s. Furthermore, Colorado has a leaking educational pipeline, producing 22 postsecondary degree holders for every 100 students who enter a Colorado high school (see Figure 2). We also have a significant disparity in educational attainment levels between whites and most minority groups. Thus our state’s diversifying racial/ethnic composition will also mean more layers of support will be needed for students, especially those from underserved populations who tend to have lower educational attainment rates, in order to achieve higher levels of academic success. These factors dramatically impact the long-term sustainability of our educated workforce, which contribute to the development of our state economy.
Source: NCHEMS, 2009
Figure 3: Colorado Average Annual Growth Rates
Source: Colorado State Demography Office, 2012
28% 27% 23% 22%
Figure 2: Colorado's Student Pipeline 9th to 12th grade HS graduate to college
FY2013-14 Colorado Skills for Jobs Report Page 10
Additionally, for our current educational attainment levels, Coloradans ages 25 to 34 tend to have slightly lower educational levels than older citizens1, and as baby boomers begin their retirement in the coming years, this differential has the potential to become magnified as those with higher education levels leave the workforce. Thus, looking towards the long-term success of our state, in order to maintain our levels of postsecondary completions we will need to be prepared to exert additional effort as we lose educated members of the workforce to retirement, as our in-migration levels of highly educated citizens eventually wane and as we work towards patching our educational pipeline.
Our country’s current rate of producing college-educated workers increases by one percent annually; in order to meet projected demand, experts deem that our country must increase this rate to 2.6 percent annually (Carnevale & Rose, 2011). In 2012, public institutions in Colorado awarded 49,739 certificates and degrees, an impressive 8.7 percent increase from the year prior. Since 2007, postsecondary completions have seen an average annual growth rate of 5.6 percent. As more jobs require higher levels of education in the years to come, we will likely need to increase our postsecondary credential production by about two percent or about 1,000 additional degrees/credentials annually, if we want to be able to be more reliant on our homegrown citizens to fill our jobs.
Despite potential challenges we may face in terms of future degree production, we do have one of the most highly educated workforces in the country, and an economy that attracts an educated workforce and motivates many to acquire additional education. With our reliance on a supply of educated workers, it is important to look beneath the surface of degree levels awarded and examine the structural nuances of our degrees and credentials earned to assess if we have any gaps in certain areas of training.
Projected Demand by Occupational Classification
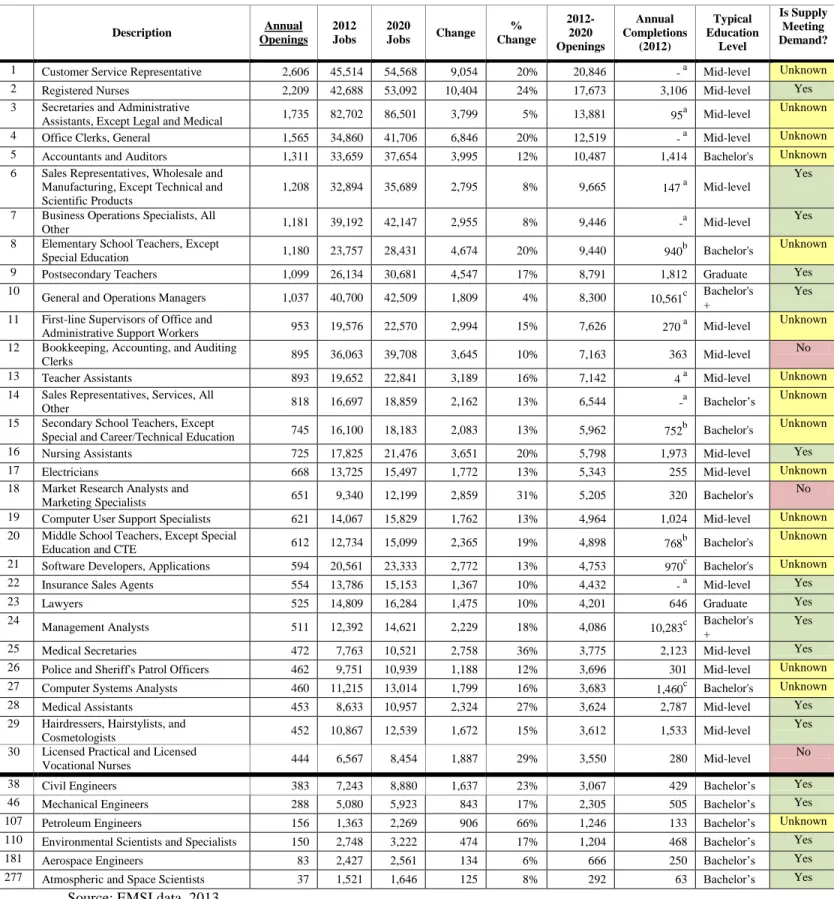
The following table isolates Colorado’s top 30 occupations with the largest projected annual openings from 2012 to 2020 for which more than half of workers have some level of postsecondary training. We have also added additional Colorado-specific STEM occupations at the bottom of the table to provide a sense of how we are faring in select fields. Mid-level occupations include standard education levels akin to postsecondary certificates and similar non-degree awards/apprenticeships, some college completed and associate’s non-degrees. Bachelor’s level refers to four-year baccalaureate degree programs, and graduate level includes master’s, doctoral and professional degrees. Based on related completions and projected annual demand, we denote whether or not supply is likely to meet demand. Where we are unable to provide a reasonable projection of whether supply is meeting demand due to data limitations, we have listed the outcome as “unknown.” A report focusing on STEM-related occupations and programs supply and demand will be issued at a later date.
1Forty-seven percent of Colorado adults (ages 25 to 64) hold an associate’s degree or higher (American Community Survey, 2011). However, this level is lower for young adults between the ages of 25 and 34, as the same dataset reports it at 45.5 percent for this age group.
FY2013-14 Colorado Skills for Jobs Report Page 11
Table 1: Top 30 Occupations with Highest Projected Openings with More than Half of Workers with Postsecondary Experience
Description Annual Openings 2012 Jobs 2020 Jobs Change % Change 2012-2020 Openings Annual Completions (2012) Typical Education Level Is Supply Meeting Demand?
1 Customer Service Representative 2,606 45,514 54,568 9,054 20% 20,846 - a Mid-level Unknown 2 Registered Nurses 2,209 42,688 53,092 10,404 24% 17,673 3,106 Mid-level Yes 3 Secretaries and Administrative
Assistants, Except Legal and Medical 1,735 82,702 86,501 3,799 5% 13,881 95
a
Mid-level Unknown 4 Office Clerks, General 1,565 34,860 41,706 6,846 20% 12,519 - a Mid-level Unknown 5 Accountants and Auditors 1,311 33,659 37,654 3,995 12% 10,487 1,414 Bachelor's Unknown 6 Sales Representatives, Wholesale and
Manufacturing, Except Technical and Scientific Products
1,208 32,894 35,689 2,795 8% 9,665 147 a Mid-level
Yes
7 Business Operations Specialists, All
Other 1,181 39,192 42,147 2,955 8% 9,446
-a
Mid-level Yes 8 Elementary School Teachers, Except
Special Education 1,180 23,757 28,431 4,674 20% 9,440 940
b Bachelor's Unknown
9 Postsecondary Teachers 1,099 26,134 30,681 4,547 17% 8,791 1,812 Graduate Yes 10
General and Operations Managers 1,037 40,700 42,509 1,809 4% 8,300 10,561c Bachelor's + Yes 11 First-line Supervisors of Office and
Administrative Support Workers 953 19,576 22,570 2,994 15% 7,626 270
a
Mid-level Unknown 12 Bookkeeping, Accounting, and Auditing
Clerks 895 36,063 39,708 3,645 10% 7,163 363 Mid-level
No 13 Teacher Assistants 893 19,652 22,841 3,189 16% 7,142 4 a Mid-level Unknown 14 Sales Representatives, Services, All
Other 818 16,697 18,859 2,162 13% 6,544
-a
Bachelor’s Unknown 15 Secondary School Teachers, Except
Special and Career/Technical Education 745 16,100 18,183 2,083 13% 5,962 752
b Bachelor's Unknown
16 Nursing Assistants 725 17,825 21,476 3,651 20% 5,798 1,973 Mid-level Yes 17 Electricians 668 13,725 15,497 1,772 13% 5,343 255 Mid-level Unknown 18 Market Research Analysts and
Marketing Specialists 651 9,340 12,199 2,859 31% 5,205 320 Bachelor's
No 19 Computer User Support Specialists 621 14,067 15,829 1,762 13% 4,964 1,024 Mid-level Unknown 20 Middle School Teachers, Except Special
Education and CTE 612 12,734 15,099 2,365 19% 4,898 768
b Bachelor's Unknown
21 Software Developers, Applications 594 20,561 23,333 2,772 13% 4,753 970c Bachelor's Unknown 22 Insurance Sales Agents 554 13,786 15,153 1,367 10% 4,432 - a Mid-level Yes 23 Lawyers 525 14,809 16,284 1,475 10% 4,201 646 Graduate Yes 24 Management Analysts 511 12,392 14,621 2,229 18% 4,086
10,283c Bachelor's + Yes 25 Medical Secretaries 472 7,763 10,521 2,758 36% 3,775 2,123 Mid-level Yes 26 Police and Sheriff's Patrol Officers 462 9,751 10,939 1,188 12% 3,696 301 Mid-level Unknown 27 Computer Systems Analysts 460 11,215 13,014 1,799 16% 3,683 1,460c Bachelor's Unknown 28 Medical Assistants 453 8,633 10,957 2,324 27% 3,624 2,787 Mid-level Yes 29 Hairdressers, Hairstylists, and
Cosmetologists 452 10,867 12,539 1,672 15% 3,612 1,533 Mid-level
Yes 30 Licensed Practical and Licensed
Vocational Nurses 444 6,567 8,454 1,887 29% 3,550 280 Mid-level
No 38 Civil Engineers 383 7,243 8,880 1,637 23% 3,067 429 Bachelor’s Yes 46 Mechanical Engineers 288 5,080 5,923 843 17% 2,305 505 Bachelor’s Yes 107 Petroleum Engineers 156 1,363 2,269 906 66% 1,246 133 Bachelor’s Unknown 110 Environmental Scientists and Specialists 150 2,748 3,222 474 17% 1,204 468 Bachelor’s Yes 181 Aerospace Engineers 83 2,427 2,561 134 6% 666 250 Bachelor’s Yes 277 Atmospheric and Space Scientists 37 1,521 1,646 125 8% 292 63 Bachelor’s Yes
FY2013-14 Colorado Skills for Jobs Report Page 12
Table 1 Notes a
The National Center for Education Statistics either does not provide a specific match between SOC and CIP codes for this occupation or this is a particular occupation that receives workers from a wide range of educational backgrounds. Using business operations specialists as an example, we know that there is an abundance of business degree completions to projected openings for business occupations, overall, which suggests that we have adequate related completions for this occupation.
b Educator preparation programs can be difficult to delineate as to which level (elementary, middle or secondary) completers intend to teach, as many programs are K-12 endorsements. Essentially, in 2012 there were 940 completers for Elementary Education endorsements, 752 completers for endorsement areas that typically lead to secondary level positions, and 768 completers for endorsements for areas in K-12. These counts do not include completers for alternative certification programs or special education endorsements.
c Approximately one-third of these degrees awarded are graduate-level; therefore, these are not necessarily new entrants into the workforce. Nor are these degrees unique to this occupation—e.g., a MBA could be applied to many business-related occupations that may not be reflected in this table.
There are certainly limitations to this analysis; some involve the complexity of degree/certificate program codes feeding to multiple occupation codes, workforce participants that are completing credentials and are not necessarily new entrants into the workforce supply, and new or emerging industries/occupations that one cannot account for. Appendix A goes into more detail regarding technical information behind the analysis. In addition, while regional differences do exist, for the purposes of this report we focus on a statewide perspective. Future briefs will be oriented towards regional analysis.
When 2012 completions are taken at face value and viewed next to annual openings, it appears that we may be underserving or oversaturating certain occupational categories; however, in reality, the completions listed in this table can include a range of degree levels, so some completions may be people who are in the field already and advancing their education with a graduate level degree program. Further, some completions are from programs that could be applied to multiple occupations (for example, a business degree could be applied to many jobs— in this table alone, we see educational alignment between management roles and management analysts, and even sales). It can also be more challenging to quantify completions for certain occupations, such as a wholesale and manufacturing sales representative or an insurance sales agent, as there are many educational pathways that lead to either.
In general, though, when we analyze these 30 occupations it appears that we are currently meeting our state’s overall needs for about half of them. For half of the listed occupations we have designated their definitive status as “unknown,” as some occupations (e.g., office- or sales-related) are difficult to connect to program completions since candidates from a wide range of programs can be found in these areas. For three of the occupations supply clearly does not meet demand. Some occupations for which we may not be meeting the state’s workforce demands are bookkeeping, accounting and auditing clerks, market research analysts/marketing specialists, and licensed practical nurses; however, it is also unlikely that supply is meeting demand for various levels of K-12 educators, software developers and computer systems
When we analyze
these 30 occupations
with high projected
openings, it appears
that we are currently
meeting our state’s
overall needs for about
half of them.
Table 1 Notesa The National Center for Education Statistics either does not provide a specific match between SOC and CIP codes for this occupation or this is a particular occupation that receives workers from a wide range of educational backgrounds. Using business operations specialists as an example, we know that there is an abundance of business degree completions to projected openings for business occupations, overall, which suggests that we have adequate related completions for this occupation.
b Educator preparation programs can be difficult to delineate as to which level (elementary, middle or secondary) completers intend to teach, as many programs are K-12 endorsements. Essentially, in 2012 there were 940 completers for Elementary Education endorsements, 752 completers for endorsement areas that typically lead to secondary level positions, and 768 completers for endorsements for areas in K-12. These counts do not include completers for alternative certification programs or special education endorsements.
c Approximately one-third of these degrees awarded are graduate-level; therefore, these are not necessarily new entrants into the workforce. Nor are these degrees unique to this occupation—e.g., a MBA could be applied to many business-related occupations that may not be reflected in this table.
FY2013-14 Colorado Skills for Jobs Report Page 13
analysts. Bookkeeping, accounting, and auditing clerks are primarily mid-level occupations, thus the 363 completions (2012) are all for certificate and associate’s level programs; however there are a number of professionals without a credential in this occupation, which adds complexity to analyzing this supply-demand relationship. While we are probably not producing enough completions for this occupation, one should bear in mind that the demand for bookkeeping, accounting and auditing clerks or accountants and auditors also demonstrates the economic benefits of obtaining certain technical degrees as entry into a career path.
Market research analysts and marketing specialists are found across diverse industries, and often as consultants, potentially providing them with room for movement based on different industry growth levels. This is an interesting occupation category, for with the proposed surge of “Big Data,” market research specialists could certainly take advantage of this potential opportunity by expanding their skills or forming partnerships that could contribute complementary information. While it appears that we are probably not training enough electricians, as there are 293 completions (2012) and 668 projected annual openings over the next eight years, it is unclear as to whether we still have unemployed electricians who are gradually reentering the workforce as construction jobs continue to increase following the substantial downturn in that industry specifically.
The supply-demand relationship for police and sheriff’s patrol officers is also difficult to fully forecast. While there are fewer completions for programs than necessary to fulfill projected annual demand, other variables will impact this occupation, such as prolonged contraction of many police department budgets and the challenges associated with rural hard-to-fill positions. There are a few strong growth occupations for which there is potential for oversaturating with completions, such as hairdressers, hairstylists and cosmetologists, medical secretaries, medical assistants and nursing assistants. While annual openings are projected at 452 for hairdressers, hairstylists and cosmetologists, there were 1,533 completions in cosmetology and hair styling in 2012. Furthermore, the demographics for these cosmetology occupations are heavily weighted towards younger women, with three-quarters of workers being under 44 years of age.
Analyzing whether or not we have an excess of completions for nursing assistants, medical secretaries or medical assistants can be complex. We have a 25 percent growth rate projected from 2012 to 2020 for healthcare and healthcare support occupations (put in annual terms, just over 3 percent growth per year—almost twice the 1.6 percent annual growth projected for Colorado’s jobs overall). Indeed, there is the potential for such occupations to experience higher rates of growth than projected based on the impending expansion of the healthcare sector. However, we should also be aware that the related completions in 2012 for each of these occupations are up to five times the projected annual openings through the end of the decade; therefore, we are likely producing more than adequate numbers of completions in these occupations.
Of the six additional STEM occupations we added to the table, completions are likely meeting demand for civil engineers, mechanical engineers, environmental scientists, aerospace engineers and atmospheric and space scientists. The supply-demand relationship for petroleum engineers
FY2013-14 Colorado Skills for Jobs Report Page 14
warranted an “unknown” status, due to completions being very close to projected demand and a cyclical market.
This table of 30 high growth occupations definitely inspires reflection upon our state’s prospective economic and educational landscapes, and the challenges, successes and changes we may face along the way. Further discussion continues below focusing on the nuances of the fields of nursing/healthcare support positions, computer-related occupations and K-12 educators. A Closer Look at High Demand Occupation Groups
Registered Nurses, Nursing Assistants, Licensed Practical and Vocational Nurses and Medical Assistants
The healthcare industry is in a unique position in that it has experienced growth both during the recession and recovery, and projections continue an expectation of strong growth patterns. While Colorado has tended to have a younger population, because of our aging baby boomers we should anticipate a significant impact on employment demands of this industry: approximately 1,000,000 workers will be retiring over the next 20 years (Colorado State Demography Office, 2011), and if these retirees remain in our state, this population will have increased healthcare needs and require additional health support services in the coming years. In addition, about 25 percent of nurses are currently over the age of 55 themselves, and will transition from healthcare providers to consumers in this time period.
In terms of meeting such impending demands on the healthcare industry, we have a strong pipeline of completions for many educational levels of registered nurses, nursing assistants and medical assistants. Table 2 shows 2012 completions and annual openings projections until 2020 for registered nurses, nursing assistants, medical assistants and licensed practical/vocational nurses.
Table 2: Openings and Completions for High Demand Healthcare Practitioners and Support Occupations
Registered Nurses - SOC: 29-1141
Annual Openings (2012-2020) 2,209 Medical Assistant - SOC: 31-9092 Annual Completions (2012) 3,106 Annual Openings (2012-2020) 453 Mid-level Completions 1,326 Annual Completions (2012) 2,787 Bachelor's Level Completions 1,595 Mid-level Completions 2,787
Graduate Level Completions 185
Licensed Practical/Vocational Nurse –
Nursing Assistant - SOC: 31-1014 SOC: 29-2061
Annual Openings (2012-2020) 725 Annual Openings (2012-2020) 444 Annual Completions (2012) 1,973 Annual Completions (2012) 280 Mid-level Completions 1,973 Mid-level Completions 280
FY2013-14 Colorado Skills for Jobs Report Page 15
Certainly over the past few years the media has highlighted a pervasive “nursing shortage” across the country. However, what may be true for one state or region may be quite different for another. Colorado is one such state that has consistently had an in-migration of highly educated workers overall, and as we can see by the figures above, also has a strong completion rate for various high demand healthcare occupations. Perhaps not surprisingly, as training for nursing assistants and medical assistants tends to require less time to complete, each area appears to have an overabundance of completers. In addition, 2,092 of the 2,787 credentials earned in 2012 that feed into medical assistant positions were from for-profit institutions; whereas 8 of the 1,973 credentials earned that feed into nursing assistant positions were from for-profit institutions.
However, completions for licensed practical or vocational
nurses have declined over the past decade, even though the training tends to be a one or two year program, as well, and is a valuable entry point into the nursing profession. Completions for registered nurses (once we take into account how many may be pursuing a bachelor’s or master’s level degree who are already in the field) appear to be precisely meeting our projected needs. If these completions for registered nurses remain stable or see growth through 2020, we should be prepared for the impending demand as baby boomers age. Yet we should also be aware of imbalances in completions for the aforementioned related occupations and recognize both the higher demand and benefits in quality of care that more advanced levels of training involve.
Computer-related Occupations
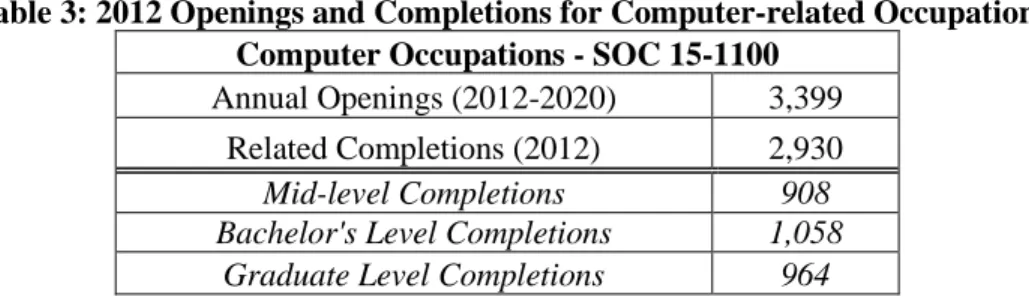
Computer-related occupations account for a number of high growth jobs. In looking at the table of 30 occupations (Table 1) we have high demand for a number of computer-related occupations, yet the annual completions appear to exceed projected annual openings for each of these occupations individually. However, many of these recorded completions do overlap as there are common programs shared as pathways to these occupations; therefore, we do not believe this occupation group has supply meeting demand (see Table 3). During 2001 when the dot-com bubble burst and the most recent 2008 recession, this category of occupations experienced significant job loss, from which it is still rebuilding to pre-2001 levels. However, even with that being the case, this is a strong job sector for our state, and one that is also interwoven throughout many industries. Demand for workers in computer-related occupations will likely continue to be healthy, especially considering the fast pace of technological developments that impact business’ needs and high growth specializations such as database analytics. Furthermore, with the emergence of new technologies emerge, creation of new jobs will occur, potentially altering or creating new career paths.
Perhaps not
surprisingly, as
training for nursing
assistants and medical
assistants tends to
require less time to
complete, each area
appears to have an
overabundance of
FY2013-14 Colorado Skills for Jobs Report Page 16
Table 3: 2012 Openings and Completions for Computer-related Occupations Computer Occupations - SOC 15-1100
Annual Openings (2012-2020) 3,399 Related Completions (2012) 2,930
Mid-level Completions 908
Bachelor's Level Completions 1,058
Graduate Level Completions 964
When we look at related completions (2012) next to annual openings for computer occupations (SOC 15-1100) as a whole, it appears that we are not producing enough completions to meet projected openings through 2020. We can see that this is particularly true of mid-level and bachelor’s level completions in Figures 5 and 6 below.
K-12 Educators
K-12 educators comprise a large number of positions with an expectation for growth that is slightly higher than the state’s anticipated population growth rate through the end of this decade. Since many teacher endorsements that are awarded apply to K-12 as a whole, it is difficult to know the grade level(s) program completers plan to teach. For this general overview of the field, this report is not reviewing the specific high or low supply and demand patterns for individual endorsement subject completions and position openings. However, in Table 4 we can see that completions for teacher endorsements overall are slightly below projected job openings, with special education endorsements at nearly 50 percent of our state’s special education teacher openings.
Table 4: 2012 Openings and Completions for Educator Endorsements
K-12 - All Educators Except Special Education
Educators - Special Education
Endorsement
Annual Openings (2012-2020) 2,537 Annual Openings (2012-2020) 503 Completions (2012) 2,460 Completions (2012) 217
For 2011-2012 license issuances by the Colorado Department of Education, 2,660 (76 percent of the total issued) were granted to teachers who completed in-state educator preparation programs and 827 (24 percent of the total) were issued to those who completed out-of-state programs. Over the past ten years, 71 percent of teachers issued licenses were trained in-state and 29 percent were trained out-of-state. These figures certainly suggest that we do not have enough completers of educator preparation programs to meet our state’s needs.
Another variable in the supply-demand relationship for educators is the demonstrated challenge to hire and retain qualified educators in rural districts, particularly for math and science subject areas, career and technical education, special education and support personnel for mandated services like speech pathology or occupational therapy. Figure 4 depicts the counties in which completions of K-12 educator preparation programs occur and to what degree.
FY2013-14 Colorado Skills for Jobs Report Page 17
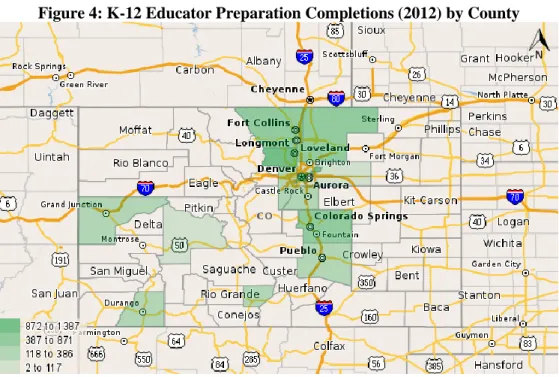
Figure 4: K-12 Educator Preparation Completions (2012) by County
It is clear that the concentration of educator preparation programs is in the Front Range, and that the Eastern Plains in particular lacks local public four-year institution training for this profession. However, the Eastern Plains is also a less populated area that tends to experience slower growth rates than the rest of the state. Colorado Mountain College (CMC) was recently approved to offer a bachelor’s level educator preparation program that could ease the challenges in cultivating locally trained educators in regions in which CMC will operate this program. In such rural areas like the plains or mountainous regions, districts face additional challenges like not being able to meet compensation levels akin to Front Range districts, a trait characteristic of the lifestyle experienced in rural communities. Career pathways that adequately support potential educators towards achieving licensure and efficacy in such hard to staff regions are an important consideration in developing quality education opportunities for the students served in those regions.
FY2013-14 Colorado Skills for Jobs Report Page 18
Occupational Demand by Credential Level
For our state to meet workforce demand, it is also important to understand where gaps exist in certain occupations by credential level. Here we examine occupation clusters as defined by Standard Occupational Codes (SOC) by level of postsecondary education. We use three education levels: mid-level, bachelor’s level and graduate level.
There are two ways by which we analyze the demand by credential level:
By education requirements assigned to occupations as typically categorized by the Bureau of Labor Statistics (BLS), which are described as entry education levels. This is represented by the red bars in the following graphs.
By the actual education attainment percentage rates of people employed in these occupations, per ACS data. This, in a sense, shows the competitive level of education currently experienced in each occupation. This is represented by the blue bars in the following graphs.
It is especially helpful to consider credential-level supply and demand from both of these angles in our current economy. The economy is still rebounding from the Great Recession, and many employers are hiring candidates with higher levels of education for certain positions than prior to the recession. Essentially, for some occupations, the BLS education level designation is now an entry level requirement rather than a more typical requirement, whereas the education attainment level rates show the real world experience of people with that degree in the occupation category. Further, we must recognize that this section is examining general trends within large occupation groups, and that there certainly may be deficits or excesses in completions for individual occupations within larger groups.
There are two ways by which we measure demand:
By
entry education level demand
—essentially, the education
requirements assigned to occupations by the Bureau of Labor
Statistics.
By
competitive education level
demand—the actual education
attainment percentage rates of people employed in these
occupations.
FY2013-14 Colorado Skills for Jobs Report Page 19
Mid-level
Mid-level completions correspond to two-year associate’s degrees, as well as one or two year certificates and credentials acquired at community and technical colleges. Figure 5 shows occupation categories that have a projected demand that exceeds supply. There is an interesting discrepancy between supply and demand of credentialed persons in the skilled trades, with 3,667 completions for awards relating to these occupations, and projected annual openings ranging from 2,496 (based on actual education levels by those in these occupations) to 6,548 (based on entry education level), depending on measurement. This is a prime example of the difficulty in pinpointing actual demand for certain categories; however, with advancements in manufacturing technology thus demanding highly skilled workers, there may very well be too few completions for certain occupations within this general category. In September 2012, the U.S. Department of Labor awarded a $25 million grant to a consortium of Colorado community colleges to developed advanced manufacturing programs, which could abate this potential issue.
Figure 5: Mid-level Completions for Occupational Categories Not Meeting Projected Annual Demand 2012-2020 for Mid-level Occupations
Figure 5 depicts other potential shortages in supply and demand. For computer-related occupations, the entry level demand is lower than the competitive demand—yet 2012 related program completions fall somewhere in between. For occupations in the education, training and library category, we see a similar pattern in terms of demand, yet supply falls below both demand categories. 856 1,078 2,496 480 838 6,548 460 908 3,667 0 1,000 2,000 3,000 4,000 5,000 6,000 7,000 Education, Training and Library
Computer-related Occupations Skilled Trades, Manufacturing,
Production
2012 Completers Entry Demand Competitive Demand
FY2013-14 Colorado Skills for Jobs Report Page 20
Bachelor’s Level
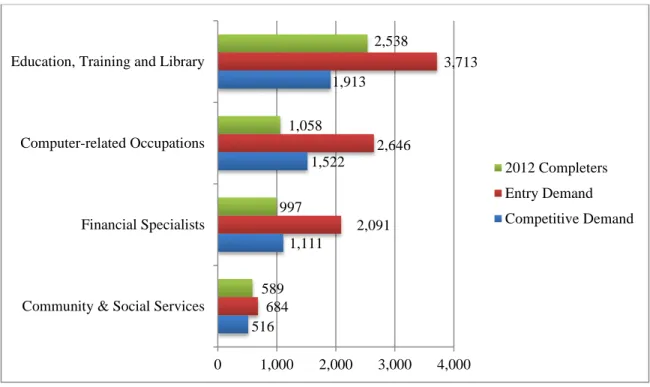
At the baccalaureate level there are a few SOC categories that we should be aware of in terms of inadequate completions to meet demand (see Figure 6). Figures for computer-related occupations show a notable lack of supply, as completions (1,058) are below both measurements of demand (2,646 for entry and 1,522 for competitive levels of education). It is likely that this is a highly competitive category, as those holding graduate level degrees in computer science or the like find employment in these occupations that are categorized as requiring a bachelor’s degree for entry. However, regardless of this nuance, there still appears to be a significant supply deficit in this occupation category.
The education, training and library category presents similarily, in that demand by educational requirement is far higher than demand by actual attainment levels by those in the field; however, there is a degree of complexity in assessing actual supply and demand. Teachers can complete their preparation through a bachelor’s or master’s level program; furthermore, there are incentives for teachers to pursue master’s degrees through payscale step increases. It is likely that educators pursuing graduate level credentials are greatly affecting actual attainment levels for this occupational category and thus the bachelor’s level competitive education level is far below the bachelor’s level demand by entry education level. To fully understand such nuances, further analysis would need to be conducted. The community and social services occupation category follows a similar pattern—2012 completers from related programs hover between the two measurements for demand.
The occupation category for financial specialists shows a deficit in supply for both entry and competitive education levels at the baccalaureate level. As depicted in the table of 30 high demand occupations that tend to require postsecondary education (Table 1), accountants and auditors are at the top of the list. Certainly, it is hard to forget that there can be a degree of volatility in the financial sector during economic downturns; however, since 2008 all of the occupations within this category have rebounded beyond pre-recession levels. Colorado also continues to be an attractive state for relocating or expanding companies in the financial sector due to our state’s highly educated workforce. Examples of such businesses include Fidelity Investment’s expansion in 2013 and Personal Capital’s planned expansion. It will be important to support the educational pathways of finance-related professions if we wish to nurture the employability of a Colorado-educated workforce in this domain.
FY2013-14 Colorado Skills for Jobs Report Page 21
Figure 6: Bachelor’s Level Completions for Occupational Categories Not Meeting Projected Annual Demand 2012-2020 for Bachelor’s Level Occupations
Graduate Level
At the graduate level the most notable discrepancy between supply and demand is for healthcare practitioners, with 1,382 completions in 2012, yet a demand ranging from 1,711 to 2,283 projected annual openings. Examination of such potential deficits in completions for these healthcare practitioner occupations is complicated by the fact that many of these occupations could require upwards of ten years of schooling. However, there are also many variables that impact these completion figures, such as the limited number of residency positions nationwide, which is compounded by the impending baby boomer population that will certainly face increasing healthcare needs, as well as by that of the potential increase in practitioner demand as a result of more insured patients under the Affordable Care Act.
The graduate level community and social serviecs category generally represents various kinds of counselors and therapists. While there were 966 completions in 2012 for this occupational category, this supply figure exceeds projected annual openings by entry education level by about 100 completions, yet it falls below the competitive demand of 1,220. This is likely an appearance of more graduate degree holders now holding positions that used to be more commonly considered bachelor’s level positions.
516 1,111 1,522 1,913 684 2,091 2,646 3,713 589 997 1,058 2,538 0 1,000 2,000 3,000 4,000 Community & Social Services
Financial Specialists Computer-related Occupations Education, Training and Library
2012 Completers Entry Demand Competitive Demand
FY2013-14 Colorado Skills for Jobs Report Page 22
Figure 7: Graduate Level Completions for Occupational Categories Not Meeting Projected Annual Demand 2012-2020 for Graduate Level Occupations
Two and Four Year Public Institution Profiles
Per additional evaluation as proposed by the Colorado Commission on Higher Education Master Plan, this report also includes the roles and missions, locations and service areas of public colleges and universities. Colorado is a state with diverse regions and regional economies and, as such, many Colorado state agencies use a common planning and management regional guideline, dividing the state into 14 regions. The first map below (Figure 8) orients us to main and satellite campus locations of two and four year institutions overlaying Colorado’s planning and management regions. The second map (Figure 9) shows sector partnerships by region, demonstrating where current and emerging industries exist across our state. Alongside supply-demand analysis, these maps provide a reference for potential institution-industry partnerships by regional need. Appendix B includes a table outlining each institution’s location, role and mission. While of course there is inter-regional activity, whether it be economic, educational or otherwise, all of our regions have one or more public postsecondary institutions that can play a role in serving region-specific demands. Seven regions have both community college and four year institution campuses (regions 2, 3, 4, 7, 8, 9, 11), one region has only a four year institution (region 10) and five regions have only main and/or satellite community college campuses (regions 1, 5, 6, 12, 13, 14). Subsequent briefs honing in on regional profiles and needs will be issued throughout the year, in hopes of further highlighting the diverse regional workforce demands and postsecondary programs across our state.
1,220 2,283 862 1,711 966 1,382 0 500 1,000 1,500 2,000 2,500 Community and Social Services
Healthcare Practitioners and Technical
2012 Completers Entry Demand Competitive Demand
FY2013-14 Colorado Skills for Jobs Report Page 23
FY2013-14 Colorado Skills for Jobs Report Page 24
FY2013-14 Colorado Skills for Jobs Report Page 25
Recommendations
The state of Colorado has an interest and commitment to educating its citizenry for meaningful and instrumental roles in its burgeoning economy. While this report looks towards the future and, based on current data and information, makes inferences regarding prospects for Colorado, there is certainly room for a change of course in this fast evolving world. We conclude this report with various recommendations of issues and concerns that should be in our line of sight as we participate in, design and develop our state’s economies and educational networks.
In considering means to implement these recommendations it is important to consider the work Colorado has done over the last three years towards alignment of education, workforce development and economic development to meet industry needs. According to Executive Order B2010-012, the Colorado Workforce Development Council (CWDC) is responsible for ensuring effective alignment of workforce development, education and economic development initiatives related to talent development for Colorado's businesses.
The Colorado Blueprint laid the foundation for an aggressive economic development plan for the State of Colorado, including Core Objective V, Educate and Train the Workforce of the Future, which is led by the Colorado Workforce Development Council (CWDC), the state’s Workforce Investment Board. This is a collaborative approach of many partners including (but not limited to) CDHE, Colorado Department of Education, Colorado Legacy Foundation, Colorado Department of Labor & Employment, Colorado Department of Human Services, Colorado Department of Corrections, Colorado Community College System and Career & Technical Education, and the Office of Economic Development and International Trade, as well as local and regional partners of each of these state agencies. Through this structure CWDC is convening leaders and subject matter experts to develop aligned solutions, leverage resources and utilize data and industry input to ensure effective outcomes.
State needs must be based on state-level data rather than national-level data
Coloradans, in general, are better educated than people from other states, but that does not mean we are better prepared to meet our workforce needs. The job openings that need to be filled in Colorado both now and in the next decade are more likely to require postsecondary credentials than in most other states. We must focus on Colorado-specific data or we are at risk of failing to plan adequately, potentially producing an excess of graduates with certain skills and a shortage of graduates with much needed skills. Nurses and engineers are two good examples where national projections suggest more graduates are needed, but that does not appear to be the case in Colorado; whereas, we are likely to see a shortage of advanced manufacturing technicians and financial analysts and auditors.
Strengthen data sharing relationships between Colorado’s Department of Labor and Employment, Department of Education and Department of Higher Education
Each of the Colorado Departments, Labor and Employment, Education and Higher Education, gather and store vast quantities of data that would facilitate greater planning and coordination among institutions and employers so that workforce needs will be met and graduates will have full employment opportunities. Current information may need to be supplemented, however,
FY2013-14 Colorado Skills for Jobs Report Page 26
with more detail about specific regional market needs and important distinctions within broad occupation categories. For example, as noted above, a broad examination of licensed educator demand and supply might lead one to conclude that Colorado will not have a need, yet it is clear that the state will, in fact, fall short of producing an adequate number of special education teachers, teachers in rural areas, and teachers of math and science at the secondary level throughout the state. Providing that level of detail to incoming education majors will help students make wise decisions about pursuing special areas of emphasis within their chosen academic subject area. Similarly, for nurses and other healthcare workers, a more detailed analysis of workforce demands will help ensure that Colorado has the right kind of licensed health professionals in the right geographic areas to meet the needs of our rapidly aging population.
Develop effective career pathways
While we are producing postsecondary graduates, we still are not graduating enough in certain program areas that meet the demands of our state’s economy. Research has shown that countries with higher levels of educational attainment offer diverse pathways, as well as connect employers to the educational process to prepare students for certain careers (Symonds, Schwartz & Ferguson, 2011). Our state does have various career pathways in place and is planning to formally implement more. It is important to highlight the significance of this work and the essential continued support of it if we are to educate Coloradans and support their success in our state. As our state develops various career pathway tracks, we should bear in mind that places for entry and re-entry can be helpful for those who initially enter a field at a lower educational level and later desire to obtain additional credentials to enhance career opportunities (such as, one may have an accounting technician credential, but eventually pursues a bachelor’s degree in finance/business, or a licensed vocational/practical nurse completed a one or two year program initially, but eventually pursues a registered nursing degree, etc.).
In addition to the creation of specific career paths, focus should be put on the current effort of state and local partners that are working to create a statewide tapestry of career pathways including all high demand occupations and opportunities for all Coloradans. This statewide Career Pathway System is currently receiving technical assistance from the U.S. Department of Adult and Vocational Education and has potential for integrating the various career paths, as well as the work of all education and workforce development partners.
Continue to closely examine and address the supply-demand relationships of healthcare practitioners, as well as that of computer-related, financial and education professions
Healthcare practitioners, computer-related professions, financial specialists and occupations in K-12 education are fields for which completion rates are likely to not meet the demand in our state in the years to come. If we do not rectify this by improving postsecondary program alignment with workforce demand or addressing systemic issues, we will otherwise continue to be reliant on skilled workers from out-of-state.
Furthermore, it will be important to continually examine healthcare occupations as influential variables fluctuate. While it appears mid-level and bachelor’s level completions are meeting demand for most nursing positions, it will be important to maintain completion levels to meet
FY2013-14 Colorado Skills for Jobs Report Page 27
levels of demand. There are many variables that can affect our state’s demand—from shifts in demographics as our nation’s population ages, to the unknown impact the Affordable Care Act will have, to variances in regional ability to attract qualified practitioners—thus our continued attention in this area is in our best interest.
Existing sector partnerships (industry-specific regional partnerships) are addressing the supply-demand relationship and acute healthcare workforce shortages in the state. The Greater Metro Denver Healthcare Partnership serves as a pilot for the creation of Career Pathway templates in building out a statewide Career Pathway System. An overview of this strategic alliance can be found here: http://www.youtube.com/user/DenHealthPartnership
Continue to build strong industry-institution partnerships
When we look globally to best practices in cultivating an educated workforce that fulfill economic demand, strong industry-institution partnerships and earn-and-learn models continue to stand out as effective strategies for many kinds of career pathways. Often, we think of these models as connected to the skilled trades, and as we develop additional programs in advanced manufacturing, we should be aware of educational models that encourage completion rates and smooth transitions into employment. It is worthwhile to look towards innovative and adaptable business concepts that are particularly oriented towards real world skills that specific employers and fields want.
Colorado is recognized nationally as a leader in bringing industry together with education, workforce development and economic development to address these issues. Colorado’s Sector Strategies, which support regional Sector Partnerships (see map on page 24), integrate the work of economic development and the needs of industry with education and workforce partners and efforts. The resulting outcomes are comprehensive career pathways that include all levels of education, training, applied learning, connections to work experience opportunities and placement in jobs.
Colorado must find ways to increase higher education success for its fastest growing demographic groups
As Colorado faces an increasing demand for well-educated and credentialed graduates of postsecondary institutions to meet the workforce demands of the future, it also faces a rapidly changing demographic in its K-12 primary and secondary pipeline. An increasing percentage of those students are members of minority groups and face other risk factors, such as being low income and coming from families where they will be the first to pursue higher education. In the past, those groups have not found postsecondary success at the same rate as their white peers. Colorado will not meet the workforce needs of the future unless it can improve the rate at which members of those underserved groups graduate from high school are ready to enroll in college-level classes, enroll in and persist through certificate or degree completion, and enter the workforce. For that to happen, Colorado must be prepared to invest resources not only into high quality academic programs, but also toward financial aid, controlling college costs so as to maintain reasonable tuition and fees and providing academic support systems to help students successfully complete their chosen programs of study.
FY2013-14 Colorado Skills for Jobs Report Page 28
Provide students and families with the tools and knowledge to make informed decisions
It is crucial to provide students and their families with the tools and information to support them through their decision-making processes regarding postsecondary education. By providing accessible information regarding completion rates, the job market, unemployment rates and the like to interested stakeholders, there is the opportunity for completions and economic demands to better align. Ultimately, if we can help students and jobseekers know where opportunities likely exist, then we can help them spend their education dollars wisely.
Conclusion
Overall, whether or not we are “meeting the numbers” is less of an issue than whether our institutions are able to maintain the momentum to provide a high quality education for all students. It is critical that our colleges and universities across Colorado focus on delivering high-quality graduates so that Colorado employers continue to respect and seek out the credentials of Colorado-educated graduates. Further developing partnerships between Colorado’s postsecondary institutions and Colorado’s employers is critical to the advancement of our state’s economy.
FY2013-14 Colorado Skills for Jobs Report Page 29
References
Berger, N. and Fisher, P. (2013). A well-educated workforce is key to state prosperity. Washington, D.C.: Economic Analysis and Research Network. Retrieved from
http://www.epi.org/publication/states-education-productivity-growth-foundations/
Carnevale, A. P., Jayasundera, T. and Cheah, B. (2012). The college advantage: Weathering the economic storm. Washington D.C.: Center on Education and the Workforce, Georgetown
University. Retrieved from http://cew.georgetown.edu/collegeadvantage/
Carnevale, A. P., and Rose, S. J. (2011). The undereducated American. Washington, D.C.: Center on Education and the Workforce, Georgetown University. Retrieved from
http://cew.georgetown.edu/undereducated/
Carnevale, A. P., Smith, N. and Strohl, J. (2013). Recovery: Job growth and education requirements through 2020. Washington, D.C.: Center on Education and the Workforce, Georgetown University. Retrieved from http://cew.georgetown.edu/recovery2020/
Grusky, D. B., Red Bird, B., Rodriguez, N. and Wimer, C. (2013). How much protection does a college degree afford? The impact of the recession on recent college graduates. Washington, D.C.: The Pew Charitable Trusts. Retrieved from
http://www.pewstates.org/uploadedFiles/PCS_Assets/2013/Pew_college_grads_recession_report .pdf
OECD (2013), Education at a Glance 2013: OECD Indicators, OECD Publishing. http://dx.doi.org/10.1787/eag-2013-en
Symonds, W. C., Schwartz, R. and Ferguson, R. F. (2011). Pathways to prosperity: Meeting the challenge of preparing young Americans for the 21st century. Cambridge, MA: Pathways to Prosperity Project, Harvard University Graduate School of Education.