ALI TAVAKOLI KASHANI, Ph.D. Candidate E-mail: [email protected]
AFSHIN SHARIAT-MOHAYMANY, Ph.D. E-mail: [email protected]
ANDISHE RANJBARI, M.Sc. Student E-mail: [email protected] Iran University of Science and Technology, School of Civil Engineering
Narmak, Tehran, Iran
Preliminary Communication Safety and Security of Traffic Accepted: Nov. 2, 2009 Approved: Dec. 21, 2010
A DATA MINING APPROACH TO IDENTIFY KEY
FACTORS OF TRAFFIC INJURY SEVERITY
ABSTRACTSeventy percent of the traffic crash fatalities of Iran hap-pen on rural roads, and a significant proportion of the rural roads network of this country is constituted of the main two-lane, two-way roads. The purpose of this study is to iden-tify the most important factors which affect injury severity of drivers involved in traffic crashes on these roads, so that by eliminating or controlling such factors an overall safety improvement can be accomplished. Using the Classification and Regression Tree (CART), one of the powerful data min-ing tools, the crash data pertainmin-ing to the last three years (2006-2008) were analyzed. The variable selection proce-dure was carried out on the basis of Variable Importance Measure (VIM) which is one of the CART method outputs. The results revealed that not using the seat belt, improper overtaking and speeding are the most important factors as-sociated with injury severity.
KEYWORDS
injury severity; traffic safety; data mining; Classification and Regression Trees (CART); Variable Importance Measure (VIM)
1. INTRODUCTION
Iran is one of the countries with a high rate of traffic crash fatalities and injuries. Over the last three years, traffic crashes in Iran resulted in 24,000 people (i.e. 3 persons per hour) on the average killed and around 240,000 injured annually [1].
Understanding the circumstances under which the drivers and passengers are more likely to be killed or more severely injured in an automobile crash is of spe
-cial concern to researchers in traffic safety. Identifica
-tion of these factors can help improve the overall driv
-ing safety situation, not only by prevent-ing accidents but also by reducing their severity.
Seventy percent of the aforesaid fatalities happen on rural roads and thirty percent on urban roads. In ad
-dition to this, more than 90 percent of passenger car
-riage in Iran is carried out by road transportation mode [2], and a significant proportion of the rural roads net
-work of Iran consists of two-lane, two-way roads. The objective of this study is to identify the sig
-nificant factors which affect injury severity of vehicle drivers involved in traffic crashes on two-lane two-way rural roads of Iran. Many of the previous studies in this domain have used regression type generalized linear models where the functional relationships between the injury severity and the crash-related factors are as
-sumed to be linear. However, as noted by Mussone, Ferrari et al. [3], this assumption can lead to errone
-ous estimations of the likelihood of injury severity. The Classification and Regression Tree (CART), an important data mining technique, is a non-parametric model without any pre-defined underlying relationship between the dependent and independent variables, which has been widely employed in many fields of study.
According to Han and Kamber [4], data mining is discovering and analyzing a large amount of data to find meaningful models and patterns. Considering the large amount of crash data on rural roads in Iran, CART was found to be a suitable approach for this study.
Breiman [5] devised a Variable Importance Mea
-sure (VIM) for trees, which may be applied as a crite
-rion to select a subset of variables that have a major importance in predicting the target variable. The re
-sults can be put forth for other modelling tools, such as neural network.
In this study, significant factors influencing injury severity are identified using the variable importance measure (VIM) based on the classification tree.
The paper begins with a brief review of previous re
and then presents the methodological approach. This is followed by the description of the data compilation and definition of all the variables. Then, analysis re
-sults will be given, along with the discussion of the findings. Finally, the last section summarizes and con
-cludes the paper.
2. LITERATURE REVIEW
A considerable amount of studies have been car
-ried out so far, to identify the factors most important in increasing or reducing the levels of injury or crash severity. The objective is to reduce the number of peo
-ple killed and/or injured in traffic crashes, by help of elimination or control of these factors.
Most studies done in this field employed the logis
-tic regression models to develop the severity of crash
-es or severity of crash-related injury prediction models. Singleton, Qin et al. [6] performed a logistic regression of injury severity to investigate factors associated with higher levels of injury severity in crashes where the occupant’s vehicle was severely damaged. Analyzing traffic crash data in Kentucky 2000-2001, they con
-cluded that the Occupant risk factors for higher lev
-els of injury severity selected by the regression were age, female gender, restraint non-use, ejection from the vehicle, and driver impairment (by alcohol and/or drugs). Dissanayake and Lu [7] used logistic regres
-sion to identify factors influencing severity of injury to older drivers in fixed object–passenger car crashes. In another study, conducted in Saudi Arabia, a logis
-tic regression approach was employed to examine the contribution of individual variables to the injury sever
-ity [8]. The results suggested that the location and the cause of crash are important factors in the increase of crash severity. Another logistic regression model was applied to quantify the association of driver’s age with traffic injury severity [9]. They used Wisconsin Crash data from 2002 to 2004 to study 602,964 drivers involved in a motor vehicle crash, and found that the oldest drivers – especially those older than 85 years – had the highest risk for severe injury and fatality.
Ordered probits are another group of models that have become popular in the crash severity modelling. For instance, an ordered probit model was employed at the University of Texas [10] in order to examine the risk of different injury levels. The results indicate that pickups and SUVs are less safe than passenger cars under single-vehicle crash conditions. However, in two-vehicle crashes, they were found to be safer for their drivers and more dangerous for the occupants of their collision partners.
In recent years, using non-parametric and data mining methods, has increased significantly, and many researchers tried to apply these techniques in road safety analysis.
Among the data mining techniques, decision trees and rule, non-linear regression and classification methods, and neural network have been the popular data mining techniques.
Abdelwahab and Abdel-Aty [11] employed artificial neural networks to model the relationship between driver injury severity and the number of crash factors. A similar study conducted by Delen, Sharda et al. [12] used a series of artificial neural networks to model the potentially non-linear relationships between the injury severity levels and crash-related factors.
Chang and Wang [13] developed the CART model to establish the relationship between injury severity and driver/vehicle characteristics, highway/environ
-mental variables and crash variables. By using 2001 crash data for Taipei, Taiwan, they concluded that the most important variable associated with crash severity is the vehicle type. Yan and Radwan [14] applied the classification tree method combined with the Quasi-induced exposure concept to perform an analysis on relation between rear-end crashes occurring at sig
-nalized intersections and a series of potential traffic risk factors. Analyzing 2001 Florida crash database, they found that rear-end crashes are over-presented in the higher speed limits (45–55mph), and the rear-end crash propensity is larger for daytime, wet and slippery road surface conditions, male gender, and drivers younger than 21 years of age. Pande and Ab
-del-Aty [15] in another study employed classification tree based variable selection procedure to identify the important parameters leading to lane-change related freeway crashes, using the traffic surveillance data col
-lected from a pair of dual loop detectors.
However, most of these previous studies focused on a few risk factors, some specific road users or certain types of crashes; and so the important fac
-tors affecting injury or crash severity have not been yet completely recognized. This gave us the reason to conduct this research. Besides, this study is distinctive from previous works, because of its significance in Iran (due to the high proportion of road transportation in passenger carriage), and the geographical vastness of data being analyzed throughout the study, that covers all the drivers involved in all the two-lane two-way rural roads of Iran, over the last 3 years.
3. METHODOLOGY
Variable importance measure (VIM) is one of the CART method outputs, on the basis of which variable selection procedure can be carried out.
Classification And Regression Tree (CART) is one of the most important and popular data mining tools, which turned out to be a powerful method for dealing with prediction and classification problems, particu
-larly when there is a large amount of data with many independent variables.
Classification models are generated on the basis of the training data whose independent variables and target variables are known, to be applied for the new dataset whose objective is the prediction of the target variable.
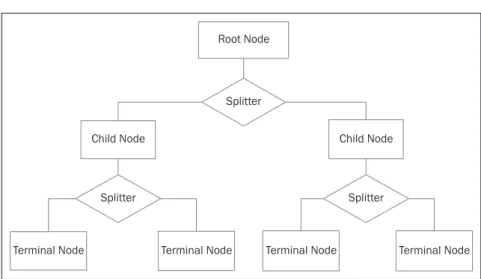
The principle of CART method in developing the classification tree is described in the following: at first all data are concentrated at the root node, situated at the top of the tree. Further, it will be divided into 2 child nodes, on the basis of an independent vari
-able (splitter), which create the best purity. In fact the data in each child node is more homogenous than its upper parent node. This process will be continued re
-cursively for each child node, until all the data in each node have the most possible homogeneity. Such node is called terminal node or “leaf”, and has no branches.
One of the most commonly applied criteria for split
-ting the classification tree is the Gini index, shown as follows [4]: , , , , p j m p j m p j mp m j N mN p m j j ; = =r = ^ h ^^ hh ^ h ^ h ^ h ^ h p j m, j J 1 = = ^ h
/
(1) Gini m 1 p j m j J 2 1 ; = -= ^ h/
^ h (2)where J is the number of target variables or class
-es, r^ hj is the prior probability for class j, N mj^ h is the number of records in class j of node m, Nj is the number of records of class j in the root node, p j m^ ; h is the probability of a record being in class j provided that it exists in node m, and Gini m^ h is an indication of impurity in node m. The Gini index equals 0 when all the observations in one node belong to a unique group (which shows the least impurity), and equals 1 when there are observations of different groups with the same proportion in one node. The prior probability shows the proportion of observations in each class in the dataset.
In the classification tree with T total nodes, let
,
S x k^ j h be the split at the kth internal node using vari -able xj. The VIM for this variable is the weighted av -erage of the reduction in the Gini impurity measure achieved by all splits using variable xj across all inter -nal nodes of the tree, and the weight is the node size. If N is the total number of observations in the training sample, then the formula for the importance for vari
-able xj is given by the following [15]:
, VIM xj n Gini S x tNt j t T 1 D = = ^ h
/
^ ^ hh (3)where DGini S x t^ ^ j, hh represents the reduction of Gini
index on the basis of variable xj in node t, and /n Nt represents the proportion of the observations in the dataset that belongs to node t.
In this study, however, the VIM is computed for all the independent variables and is scaled in such a way that its summation for all the variables will equal 1. The variable that has the most importance with re
-spect to others gets relatively the largest number.
4. DATA DESCRIPTION
The crash data from the records of the Information and Technology Department of the Iranian Traffic Po
-lice from 2006 to 2008 was used to study hundreds of drivers who were involved in traffic crashes on the main two-lane two-way rural roads of Iran. These data are obtained from the Iranian traffic crash record form, KAM 114, which contains the important information about the crashes, presented in Table 1.
Of the 14 variables presented in the table, injury severity is the target (dependent) variable -which has 3 levels of no-injury, injury and fatality- and the other 13 variables are the predictors.
According to the dataset there were 169,648 driv
-ers involved in crashes that took place on two-lane two-way rural roads of Iran over the 3-year period. Table
Root Node
Splitter
Child Node Child Node
Splitter Splitter
Terminal Node
Terminal Node Terminal Node Terminal Node
Table 1 - Variable description
Description Variable
Target variable: 1. No-injury 2. Injury 3. Fatality Injury severity
1. Male 2. Female Gender
Quantitative Age
1. Used 2. Not used 3. Unknown Seat belt
1. Following too closely 2. Ignoring proper lateral distance 3. Ignoring right of way 4. Inattention to traffic ahead 5. Inability to drive 6. Failure to control the vehicle 7. Speeding 9. Improper overtaking 11. Straying to the right 13. Improper turning 14. Crossing prohibited place 15. Driving on the wrong side of the road 16. Improper backing 17. Vehicle defect 19. Swerving 20. Pedestrian violation 22. Improper pack -ing 23. Improper tow-ing 24. Red light runn-ing 25. Turn-ing in no-turn zone 26. Other
Cause of crash*
1. Collision with motorcycle/bicycle 2. Two-vehicle collision 3. Multi-ve -hicle collision 4. Collision with pedestrian 5. Collision with animal 6.
Fixed object collision 7. Overturn 8. Fire/Explosion 11. Other Collision Type** 1. Auto 2. Mini bus 3. Bus 4. Pickup 5. Light truck 6. Truck 7. Ambulance
8.Truck with trailer 9. Motorcycle 10. Bicycle 11. Agricultural vehicles 12.
Highway const. equipment 13. Fire truck 14. Police car 15. Other Vehicle Type*** 1. Segment 2.Intersection 3. Bridge 4. Tunnel 5. Roundabout 6. Other Location Type
1. Daylight 2. Dark 3. Dusk/Dawn Lighting Condition
1. Clear 2. Fog 3. Rain 4. Snow 5. Stormy 6. Cloudy 7. Dusty Weather Condition 1. Dry 2. Wet 3. Icy 4. Gravel/Sand 5. Slush/Mud 6. Standing oil 7. Other Road Surface Condition 1. On roadway 2. On Shoulder 3. In median 4. On roadside 5. Outside roadway 6. Other Occurrence
1. None 2. Stabilized gravel 3. Paved Shoulder Type
Quantitative Shoulder Width
* Cases No. 8, 10, 12, 18 and 21 are not in the dataset.
** Cases No. 9 and 10 were related to motorcycles and pedestrian collision, and were thus eliminated, since the study concerns motor vehicles.
***Cases No. 9 and 10 were motorcycles and bicycles, and were thus eliminated, since the study concerns motor vehicles.
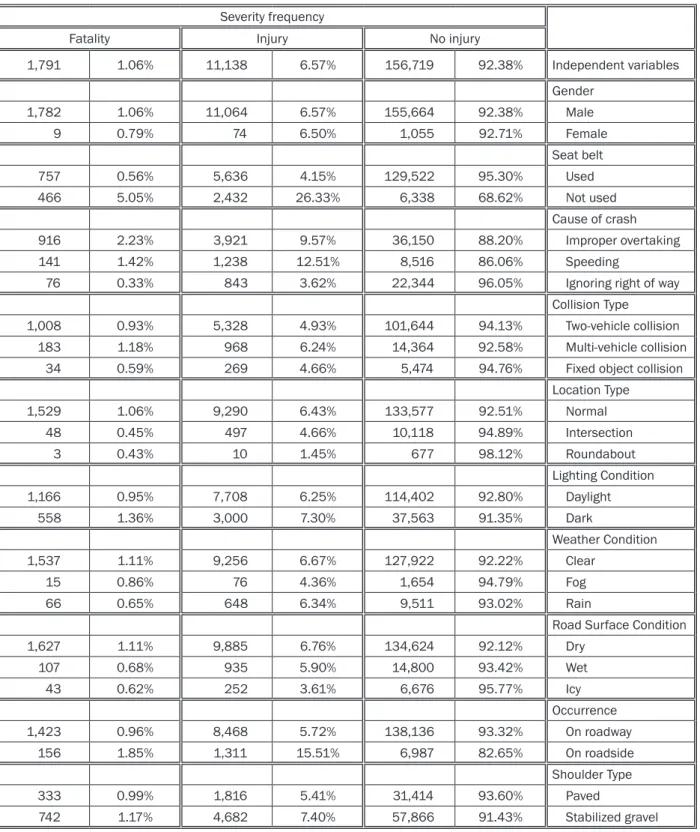
3 provides a summary of injury severity distributions by some key variables.
5. RESULTS AND DISCUSSION
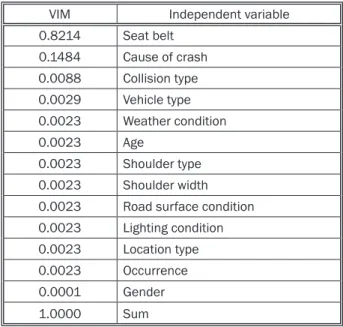
Table 2 indicates the relative variable importance computed for the 13 independent variables.
Seat belt turned out to be the most important vari
-able, such that it is about 6 times more important than the second variable, and 90 times than the third one. It indicates that there is more probability for a driver who has not used seat belt to get involved in a more severe injury. This result was also pointed out in some previous studies [12, 16-19] and shows the necessity of seat belt usage being mandatory.
The second important variable is the cause of crash, which confirms the study of Al-Ghamdi [8] in Saudi Arabia, where the cause of crash was recog
-nized as the important factor in increasing crash se
-verity. This research reveals that for two-lane two-way rural roads, improper overtaking and speeding are the serious causes of increasing injury severity, and since overtaking takes place by using the opposite lane, it results in more severe injuries and more lives lost.
Constructing passing lanes at required places, and special attention to the police enforcement by help of mobile patrol vehicles, are some of the relatively less costly solutions to this problem.
Table 2 - Relative importance of variables
VIM Independent variable
0.8214 Seat belt 0.1484 Cause of crash 0.0088 Collision type 0.0029 Vehicle type 0.0023 Weather condition 0.0023 Age 0.0023 Shoulder type 0.0023 Shoulder width 0.0023 Road surface condition 0.0023 Lighting condition 0.0023 Location type 0.0023 Occurrence 0.0001 Gender
Table 3 - Summary of distribution of injury severity by key variables
Severity frequency
Fatality Injury No injury
1,791 1.06% 11,138 6.57% 156,719 92.38% Independent variables Gender 1,782 1.06% 11,064 6.57% 155,664 92.38% Male 9 0.79% 74 6.50% 1,055 92.71% Female Seat belt 757 0.56% 5,636 4.15% 129,522 95.30% Used 466 5.05% 2,432 26.33% 6,338 68.62% Not used Cause of crash 916 2.23% 3,921 9.57% 36,150 88.20% Improper overtaking 141 1.42% 1,238 12.51% 8,516 86.06% Speeding
76 0.33% 843 3.62% 22,344 96.05% Ignoring right of way
Collision Type
1,008 0.93% 5,328 4.93% 101,644 94.13% Two-vehicle collision
183 1.18% 968 6.24% 14,364 92.58% Multi-vehicle collision
34 0.59% 269 4.66% 5,474 94.76% Fixed object collision
Location Type 1,529 1.06% 9,290 6.43% 133,577 92.51% Normal 48 0.45% 497 4.66% 10,118 94.89% Intersection 3 0.43% 10 1.45% 677 98.12% Roundabout Lighting Condition 1,166 0.95% 7,708 6.25% 114,402 92.80% Daylight 558 1.36% 3,000 7.30% 37,563 91.35% Dark Weather Condition 1,537 1.11% 9,256 6.67% 127,922 92.22% Clear 15 0.86% 76 4.36% 1,654 94.79% Fog 66 0.65% 648 6.34% 9,511 93.02% Rain
Road Surface Condition
1,627 1.11% 9,885 6.76% 134,624 92.12% Dry 107 0.68% 935 5.90% 14,800 93.42% Wet 43 0.62% 252 3.61% 6,676 95.77% Icy Occurrence 1,423 0.96% 8,468 5.72% 138,136 93.32% On roadway 156 1.85% 1,311 15.51% 6,987 82.65% On roadside Shoulder Type 333 0.99% 1,816 5.41% 31,414 93.60% Paved 742 1.17% 4,682 7.40% 57,866 91.43% Stabilized gravel
As shown in Table 2 the variable importance of the other 11 variables is very low, and they do not have a significant influence on predicting the target variable.
Referring to Breiman [5], in order to develop a CART model, the dataset should be randomly divided into 2 subsets of training and testing. In this study, the per
-centage of data assigned to the training and testing samples is 70 and 30, respectively. Table 4 represents the model prediction accuracies, computed by dividing
the number of correctly predicted data into the total number of observed data, for both training and testing data.
In comparison to the previous similar studies, the overall accuracy of the model decreased in this study, but the prediction accuracy for fatality class increased significantly (from nearly 0% to 51.27%), which is very significant, since it is the most important class for de
6. CONCLUSION
Variable importance measure (VIM) is one of the CART method outputs, which may be applied as a crite
-rion to select the variables that have major importance in predicting the target variable.
In this study, the aforesaid measure (VIM) was ap
-plied to identify the significant factors influencing inju
-ry severity of drivers involved in traffic crashes on two-lane two-way rural roads of Iran over a 3-year period.
Considering the large amount of crash data on ru
-ral roads of Iran, CART was found to be a suitable ap
-proach for this study, since it can deal well with predic
-tion and classifica-tion problems when there are lots of independent variables.
The results indicated that seat belt is the most im
-portant factor associated with injury severity of traffic crashes, and not using it significantly increases the probability of being injured or killed. The cause of crash turned out to be the second important variable, and the research found improper overtaking and speeding as the most serious causes of increasing injury sever
-ity for two-lane two-way rural roads. The construction of passing lanes and intensifying police enforcement by help of mobile patrol vehicles are some of the ef
-fective and relatively less costly solutions suggested to deal with these problems.
ACKNOWLEDGMENT
The authors gratefully acknowledge Mr. Sabbaq and Mr. Mishani from the Information and Technology Department of the Iranian Traffic Police for providing the crash data.
LITERATURE
[1] F.M.O.I. Forensic Medicine Organization of Iran; Statistical Data, Accidents (in Farsi) 2009 [cited May 31, 2009; Available from: http://www.lmo.ir/?siteid=1&pageid=1347.
[2] R.M.T.O. I.R. of Iran Road Maintenance & Transpor -tation Organization; Annual Report (in Farsi). 2008 [cited; available on: http://www.rmto.ir/NewTTO/Dyna -Stat/DynaStatF/.
[3] Mussone, L., Ferrari, A., Oneta, M.: An analysis of ur-ban collisions using an artificial intelligence model,
Table 4 - Prediction accuracy of the model for the three classes
Testing data Training data
Correctly predicted Observed severity Correctly predicted Observed severity
35,736 (75.93%) 47,063 83,463 (76.11%) 109,656 No-injury
941 (27.90%) 3,373 2,324 (29.93%) 7,765 Injury
244 (49.39%) 494 665 (51.27%) 1,297 Fatality
36,921 (72.49%) 50,930 86,452 (72.82%) 118,718 Overall
Accident Analysis & Prevention, Vol. 31, No. 6, 1999, pp. 705-718
[4] Han, J., Kamber, M.: Data mining: concepts and tech-niques, Morgan Kaufmann, 2006
[5] Breiman, L.: Classification and regression trees, Chap
-man & Hall/CRC, 1998
[6] Singleton, M., Qin, H., Luan, J.: Factors Associated with Higher Levels of Injury Severity in Occupants of Motor Vehicles that were Severely Damaged in Traffic Crash-es in Kentucky, 2000-2001, Traffic Injury Prevention, Vol. 5, No. 2, 2004, pp. 144-150
[7] Dissanayake, S., Lu, J.J.: Factors influential in making an injury severity difference to older drivers involved in fixed object - passenger car crashes, Accident analysis and prevention, Vol. 34, No. 5, 2002, pp. 609-618 [8] Al-Ghamdi, A.: Using logistic regression to estimate the
influence of accident factors on accident severity, Ac -cident Analysis and Prevention, Vol. 34, No. 6, 2002, pp. 729-741
[9] Hanrahan, R.B., Layde, P.M., et al.: The Association of Driver Age with Traffic Injury Severity in Wisconsin, Traf -fic Injury Prevention, Vol. 10, No. 4, 2009, pp. 361-367 [10] Kockelman, K., Kweon, Y.: Driver injury severity: An ap-plication of ordered probit models, Accident Analysis and Prevention, Vol. 34, No. 3, 2002, pp. 313-322 [11] Abdelwahab, H.T., Abdel-Aty, M.A.: Development of
ar-tificial neural network models to predict driver injury severity in traffic accidents at signalized intersections, Transportation Research Record, Vol. 1746, No. 1, 2001, pp. 6-13
[12] Delen, D., Sharda, R., Bessonov, M.: Identifying signifi-cant predictors of injury severity in traffic accidents us-ing a series of artificial neural networks, Accident Anal -ysis and Prevention, Vol. 38, No. 3, 2006, pp. 434-444 [13] Chang, L.Y., Wang, H.W.: Analysis of traffic injury sever-ity: An application of non-parametric classification tree techniques, Accident Analysis and Prevention, Vol. 38, No. 5, 2006, pp. 1019-1027
[14] Yan, X., Radwan, E.: Analyses of Rear-End Crashes Based on Classification Tree Models, Traffic Injury Pre -vention, Vol. 7, No. 3, 2006, pp. 276–282
[15] Pande, A., Abdel-Aty, M.: Assessment of freeway traffic parameters leading to lane-change related collisions, Accident Analysis and Prevention, Vol. 38, No. 5, 2006, pp. 936-948
[16] Bedard, M., Guyatt, G., et al.: The independent contri-bution of driver, crash, and vehicle characteristics to driver fatalities, Accident analysis and prevention, Vol. 34, No. 6, 2002, pp. 717
[17] Kweon, Y., Kockelman, K.: Driver attitudes and choic-es: Seatbelt use, speed limits, alcohol consumption, and crash histories, 82nd Annual Meeting of Transpor
-tation Research Board, Washington DC, 2003
[18] Sohn, S.Y., Shin, H.: Pattern recognition for road traffic accident severity in Korea, Ergonomics, Vol. 44, No. 1, 2001, pp. 107-117
[19] Valent, F., Schiava, F., et al.: Risk factors for fatal road traffic accidents in Udine, Italy, Accident Analysis and Prevention, Vol. 34, No. 1, 2002, pp. 71-84