THE PROGRESS OUT
OF POVERTY INDEX
This report, commissioned for the Multilateral Investment Fund (MIF) of the Inter-American Development Bank, was prepared by Professor Steve Boucher of the University of California – Davis.
Claudia Gutierrez, Tetsuro Narita, and Nobuyuki Otsuka of the MIF were in charge of the coordination of this work.
The opinions expressed in this publication are those of the author and do not necessarily reflect the views of the Inter-American Development Bank, its Board of Directors, or the countries they represent.
Multilateral investMent Fund 1300 New York Avenue, N.W.
Washington, D.C. 20577 www.fomin.org
ExEcutivE Summary
The Progress Out of Poverty Index (PPI) is a tool that allows a microfinance institution (MFI) to estimate the poverty rate of its clients. This document provides an in-depth analysis of the implementation and utiliza-tion of the PPI by MFIs in Latin America. The analysis is based on interviews with five MFIs in Peru and Ec-uador that have adopted the PPI as well as interviews with a range of other relevant institutions including rating agencies, social investors and the PPI designer.
The PPI is a high quality poverty measurement tool that has the potential to provide significant value to MFIs seeking to adopt quantitative, evidence-based strategies for monitoring the poverty outreach objec-tives identified in their social mission. The PPI also allows MFIs to provide quantitative evidence of their poverty outreach to external donors and lenders who may base their funding decisions on this evidence. Critical evaluation and internal monitoring of the social mission and communicating poverty outreach to external funders were the two most common uses made of the PPI by the interviewed MFIs.
The PPI is particularly attractive because of its relative simplicity and low cost. The PPI developer has made significant investments to make data collection and the conversion from raw data to poverty estimates intuitive and simple. In addition, the developer has created and made freely available in-depth documen-tation of the statistical methodology underlying the PPI as well as training material for PPI implemendocumen-tation. The simplicity, transparency and documentation all contribute to promoting adoption and effective use of the tool.
The PPI also has strong potential for use outside of microfinance. Its relative simplicity and low-cost make the PPI potentially attractive to a wide range of institutions seeking to monitor and deliver accurate, quan-titative estimates of poverty outreach. The PPI would be most appropriate for institutions with a clearly defined client or beneficiary population and whose clients/beneficiaries can easily be visited in the home. Because the PPI was designed with visual confirmation of certain housing characteristics and assets, the PPI may be inappropriate for institutions that cannot easily visit the beneficiaries’ homes.
In spite of this simplicity and transparency, effective implementation of the PPI faces several challenges. First, adoption and effective use of the PPI require a non-trivial investment of human resources by the MFI. MFIs that have internal capacity to carry out quantitative analysis and that have experience participating in social science research are best positioned to take full advantage of the opportunities presented by the PPI. Second, the accuracy of the PPI may be compromised by challenges to implementation. These chal-lenges include insufficient training and incentive problems when loan officers collect the PPI data and insufficient understanding of sampling by the MFI leading to the drawing of an improper PPI sample. Both of these issues suggest that strengthening of regional training capacity and the transfer of knowledge and technical capacity from MFIs that have successfully implemented the PPI to those that are either new or potential adopters would be important.
The primary challenge to accuracy of the PPI stems from improper implementation by MFIs. The PPI faces two additional challenges which are related to statistical design. First, construction of the PPI requires nationally representative household data that allows the designer to identify the 10 household indica-tors that are the best predictor of consumption-based poverty. If the predictive power of these indicaindica-tors
erodes over time then, unless the PPI is updated with more recent national household data, the accuracy of the PPI will decline. Second, if the relationship between poverty and the indicators varies significantly across regions, then the accuracy of the PPI when applied to MFIs that occupy a small geographic area may also be reduced.
In order to promote more widespread uptake of the PPI by MFIs in Latin America, we suggest the following potential roles for donors such as the Multilateral Investment Fund (MIF).
First, strengthen (or create) national and regional network support institutions. It is useful to think about the PPI as a new technology that MFIs consider adopting. One of the primary barriers to adoption and effective use of the PPI is lack of information. Regional support institutions can provide and promote work-shops and serve as a clearing house for information and sharing of experiences across MFIs.
Second, promote increased communication and consultation with national governments regarding the design and use of the PPI. Potential synergies exist with respect to evaluating indicators for inclusion in the PPI, updating the PPI and comparing government targeting methodologies with the PPI. The more informed are national governments about the PPI and the potential uses of the PPI for their own anti-poverty programs, the easier it will be to scale-up the use of the PPI in the region.
Third, in order to improve the performance of the PPI and reduce uncertainty about the PPIS accuracy, we recommend that the MIF support three types of accuracy-related research:
`
` accuracy of PPi implementation: A random re-survey of the PPI samples of a set of MFIs by a qualified third party would provide evidence on the degree of implementation error. This type of analysis should be carried out on both MFIs that use their own loan officers and those that use third parties to collect PPI data in order to compare the frequency of errors across the two data collection methods.
`
` direct test of accuracy of PPi predictions: Given the regional and inter-temporal concerns discussed above, a direct test of the accuracy of the PPI would be useful. This would require administering both the PPI and the full consumption module of the national household survey upon which the PPI is based to an appropriate sized sample of MFI clients. Poverty rates predicted by the PPI could then be compared to the “true” poverty rates.
`
` additional tests of regional and inter-temporal accuracy: Certain national household surveys (with sufficient frequency and observations) could be used to extend the analysis that the PPI designer has already conducted regarding the erosion of accuracy over time and when applied to small regions.
5
tablE of contEntS
IntroductIon:
objectIves and Methodology
7
1. overvIew of the PPI
9
1.1. What is the PPi?
9
1.2. History and uptake
10
1.3. Construction of the PPi/statistical Methodology
12
1.4. discussion of accuracy of the PPi
14
2. PrIMary challenges to effectIve
IMPleMentatIon of the PPI
17
2.1. Challenge 1: Cost
17
2.2. Challenge 2: adverse incentives
18
3. what QuestIons do MfIs try to answer wIth the PPI?
20
4. how are the data collected?
22
5. IMPleMentatIon case studIes
26
5.1. Prisma: sample Based, dynamic use of the PPi
26
5.2. Fondesurco: Population-Based use of PPi
29
6. how do MfIs ensure data QualIty?
32
7. how are the data stored?
34
8. external audItIng
36
6
9.1. Marie stopes international: Measuring Poverty Outreach
of a Global Healthcare Provider
37
9.2. Pt ruMa: Measuring Poverty levels of Micro-Franchisees
38
9.3. discussion: external uses of the PPi
39
10. socIal Investors’ PersPectIve
41
10.1. Methodology
41
10.2. Familiarity with the PPi and Perceptions of PPi accuracy
42
10.3. role of PPi in social Performance evaluation
42
10.4. additional Concerns and suggestions
43
11. suMMary and recoMMendatIons
45
references 51
aPPendIx a.
lIst of MfI IntervIews
52
aPPendIx b.
PPI scorecard and lookuP table for MexIco
53
aPPendIx c.
7
introduction:
objEctivES and mEthodology
The Progress out of Poverty Index (PPI) is a method for estimating the poverty rates of any well-defined population of households. The relative simplicity, transparency and ease of use and interpre-tation of the PPI has resulted in it becoming the most popular method for generating quantitative poverty estimates of microfinance institutions (MFIs) in the region. The primary goal of this report is to document and critically evaluate the heterogeneous ways by which MFIs implement the PPI. The use of the PPI involves a large number of choices including the specific questions the MFI seeks to answer, the method used to collect and manage the household-level data, and the way that poverty estimates generated by the PPI are incorporated into the MFI’s strategies and activities. This report identifies the key areas of decision making, with a particular emphasis on how different choices taken by the MFI, may affect the reliability of the poverty estimates. The report also identifies potential areas of support by the Multilateral Investment Fund (MIF) to improve the effectiveness of PPI implementa-tion as well as to promote more widespread adopimplementa-tion by MFIs in the region.
The methodology underlying this report is straightforward. First, during the last half of March 2012, interviews were conducted with leadership of five MFIs in Peru and Ecuador. Each of these MFIs cur-rently receives support either directly or indirectly (via microfinance investment funds) from the MIF. The MFIs in Peru included: Prisma, Fondesurco and Arariwa. The MFIs in Ecuador were Fodemi and Espoir.1 The structured interviews focused on the following topics: A) History of adoption and
imple-mentation of the MFI; B) Method of impleimple-mentation; C) Primary uses made of the PPI results and; D) Challenges faced in PPI implementation.
Furthermore, interviews were carried out with two social-performance rating agencies: Planet Fi-nance in Lima and Microfinanzas Rating in Ecuador. Both of these agencies operate at a regional level. In-person interviews were also carried out with OikoCredit, a social investor that works closely with the Grameen Foundation to promote the implementation of the PPI in Latin America and the Red Financiera Rural, an umbrella institution for a large number of rural financial institutions in Ecuador. In addition to these interviews, documentation of the PPIs in Peru and Ecuador was reviewed. Detailed documents describing the construction of the PPIs and guidelines for its use are available through Progress Out of Poverty website (http://www.progressoutofpoverty.org/). Documents provided by
1. These MFIs are not meant to be representative of the MFI sector in Latin America. This, combined with the small sample size, imply that the discussion in this document should not be generalized to the MFI sector in Latin America.
8
the individual MFIs detailing their use of the PPI were also reviewed (Alvarado Guerrero, 2011; Fer-nandez Concha, 2011). Finally, phone interviews were conducted with five social investors in order to discuss their views on the PPI.
With the exception of Espoir, I was accompanied by Claudia Gutierrez and/or Tetsuro Narita, from the MIF, on visits to each institution. While I am responsible for any errors and omissions, I would like to acknowledge the important contributions and insights provided by Claudia and Tetsuro. Nobuyuki Otsuka, MIF Specialist, Mark Schreiner, the developer of the PPI, and Mary Jo Kochendorfer, the Man-ager of Grameen Foundation’s Social Performance Management Center reviewed an initial draft of this report. I thank them for the careful and detailed feedback they provided, much of which is re-flected in this report.
The remainder of the report is organized as follows. The first section introduces the PPI and its under-lying methodology and ends with a critical discussion of several factors that may affect the degree of accuracy. Section 2 provides a conceptual framework to help think about the major challenges to effective implementation of the PPI. Section 3 describes the different types of questions the MFIs tend to answer with the aid of the PPI. Section 4 then turns to implementation and outlines the pri-mary sources of variation in data-collection methodologies. Section 5 provides a more in-depth de-scription of PPI implementation by two of the MFIs, including poverty measurement results from PPI implementation. The costs and benefits of the different methodologies are also discussed. Sections 6 and 7 turn to methods for ensuring data quality and the integration (or lack thereof ) of PPI and client data bases. Section 8 briefly describes the role of external auditors. Section 9 discusses potential roles of the PPI outside of microfinance. Section 10 provides an evaluation of social investors’ perception of the PPI and the role it plays in their evaluation of social performance. Finally, section 11 concludes and provides several recommendations.
9
1.
ovErviEw of thE PPi
1.1. what Is the PPI?
The PPI is a tool that allows MFIs and other institutions to estimate poverty rates for groups of individu-als (such as new clients).2 The PPI is based on a statistical and institutional approach developed by Mark
Schreiner.3 The development and diffusion of the PPI has been supported by a number of institutions,
including the Grameen Foundation, CGAP, and the Ford Foundation. We begin with a brief description of the main components of the PPI. A more in-depth discussion of the statistical methodology follows. The PPI is an example of an indirect poverty measurement methodology. Instead of directly measuring a household’s income or expenditures to determine whether the household falls below a poverty line, the PPI requires the measurement of only 10 household characteristics, or indicators, that are strongly corre-lated with income or expenditures.4 These indicators are selected using a statistical model that identifies
the best predictors of poverty in the most recent nationally representative household income or expen-diture survey. Weights from the statistical model are then applied to the values of each of the indicators to predict the probability that a household’s income or expenditures are below the poverty line. The PPI developers have made the algorithm that converts indicator values into predicted poverty probabilities transparent and simple, thus facilitating adoption by MFIs.
The primary advantage of indirect methodologies such as the PPI is low cost.5 Directly measuring
house-hold income in developing countries is highly complicated due, among other factors, to the prevalence of agriculture, self-employment, informality and lack of record-keeping. Directly measuring expenditures is also complicated as it requires lengthy interviews with carefully constructed consumption modules and price information. High time, personnel, and other costs imply that direct measurement of income or ex-penditures is prohibitively costly for the vast majorities of MFIs and NGOs.
2. The PPI may also be used for targeting as it generates an estimate of the probability that an individual or household is poor. Since MFIs rarely use the PPI for targeting, the remainder of this report will focus on the use of the PPI for estimating poverty rates for groups.
3. Mark Schreiner is the Director of Microfinance Risk Management, L.L.C. (www.microfinance.com) and a Senior Scholar in the Center for Social Development at Washington University in Saint Louis.
4. The PPIs for all countries except Ethiopia require collection of only 10 household indicators. The Ethiopian PPI requires 11 indicators.
5. The Poverty Mapping or Small Area Estimation techniques developed by the World Bank is the other main example of indirect income or poverty measurement methodology. While the World Bank provides a free software program (PovMap) to implement poverty mapping, implementation of Poverty Mapping is several orders of magnitude more complex than the PPI and, at least at this point, it is not feasible for MFIs to implement. A large literature on the methodology and applications of poverty mapping can be found at the following World Bank website: http://web.worldbank.org/WBSITE/EXTERNAL/TOPICS/EXTPOVERTY/EXTPA/0,,contentMDK:20219777~menuPK:462078~pagePK:14 8956~piPK:216618~theSitePK:430367,00.html.
10
In contrast, with the PPI, the MFI need only collect information on the 10 indicators. In addition, the PPI developers select indicators that are relatively easy for enumerators to collect with just a small amount of training. When selecting the indicators, the PPI developers also place weight on indicators that are verifi-able and that will likely not embarrass respondents. These two characteristics of indicators increase accu-racy and, importantly, the likelihood that MFIs will be willing to adopt the PPI.
Implementation of the PPI by an MFI requires two simple-to-use documents. The first is the Poverty Scorecard, the questionnaire form on which the enumerator records the values of the household indicators. Based on the underlying statistical model, the Scorecard also converts the response to each question into “points” that when summed up over the 10 questions (one for each indicator) generate the household’s “poverty score.” Appendix B shows the Scorecard for Mexico. A unique Scorecard exists for each country with a PPI.
The second document is the Lookup Table. As mentioned above, the Poverty Scorecard generates a pover-ty score for each household. This score ranges from 0 to 100. By consulting the Lookup Table, the enumera-tor can convert the household’s poverty score into a probability that the household falls below a given poverty line. The poverty rate of the group is then simply the average of these poverty probabilities across all households in the sample. An important feature of the Lookup Table is that it reports poverty probabili-ties for a wide range of poverty line. In the case of Mexico, for example, the Lookup Table converts poverty scores into poverty probabilities for eight separate poverty lines. The Lookup Table for Mexico is included in Appendix B.6 This is an important innovation because different MFIs may use different lines to define
the poverty outreach goals of their social mission. In addition, a given MFI may be interested in reporting poverty rates for different poverty lines; for example using the national poverty line for their internal social mission while providing poverty rates based on an absolute and internationally comparable poverty line such as the $1 per day line to external investors.
The PPI designer provides extensive documentation for MFIs interested in adopting the PPI. A detailed document describing the statistical methodology, the selection of the indicators, and an in-depth analysis of the tool’s accuracy is available for each of the country-specific PPIs on the Progress Out of Poverty web-site: http://www.progressoutofpoverty.org. The documentation for each country also includes a discus-sion of other poverty measurement tools available for the specific country. A critical comparison of the PPI versus other available tools is provided so that the institution can take an informed decision about which tool is best for its particular needs and circumstances.
Finally, in some countries, the Grameen Foundation provides support and training for MFIs interested in adopt-ing the PPI. This support, includadopt-ing a certification program, is discussed in greater detail later in this report.
1.2. hIstory and uPtake
By the end of the 1990’s, significant demand arose by MFIs for a method of quantifying poverty levels of their clients. On one hand, donors, including governments and social investors, sought a means to
con-6. For brevity, only the first three poverty lines are included in the Appendix. The Scorecards, Lookup Tables, and documentation for the PPIs in each country are available at the Progress Out of Poverty website: http://www.progressoutofpoverty.org. The Poverty Scorecard and complete documentation for the PPI in Mexico is available at: http://www.progressoutofpoverty.org/country/mexico. Access to the documents requires creating a free user account.
11
firm that the funds they were providing to MFIs were indeed being channeled to the poor. In 2000, the U.S. government passed legislation requiring micro-enterprise supporting institutions, including MFIs, that received U.S. government support via USAID to report the percentage of beneficiaries (i.e., MFI clients) that were poor. In addition, the legislation required MFIs to use an approved poverty measurement methodology. On the other hand, MFIs have increasingly adopted poverty measurement tools for their own internal uses. Most important among internal uses is the ability to evaluate whether the MFI is meeting its social mission. The two primary methodologies used by MFIs to generate quantitative poverty estimates are the PPI and the Poverty Assessment Tool (PAT), developed by the IRIS Center at the University of Maryland. For further information on the PAT, visit: http://www.povertytools.org/.
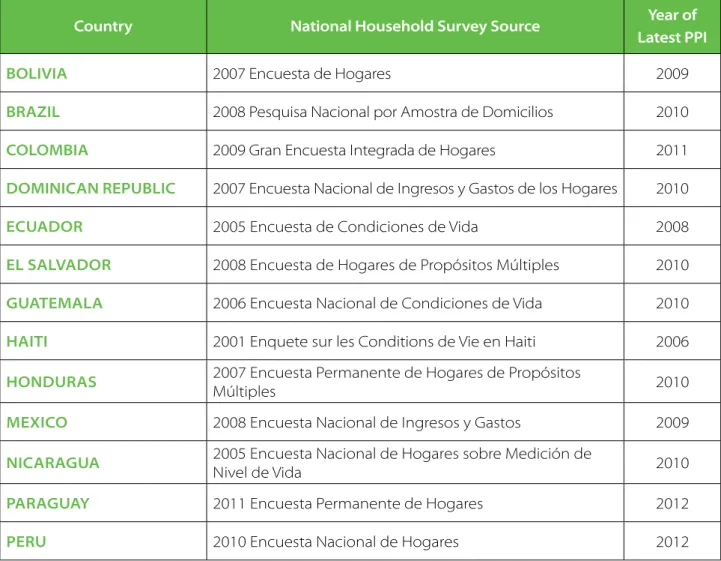
Currently, PPIs exist for about 50 countries throughout the developing world and Eastern Europe, includ-ing 13 in the Latin America and Caribbean region. Table 1 provides additional detail on the PPIs of the 13 Latin American countries, including the national household survey (and survey year) upon which it is based and the year the current PPI was created. The year of the national survey is relevant because the ac-curacy of the PPI may be reduced over time if it is not updated on the basis of new household data.
taBle 1. latin aMeriCan and CariBBean COuntries WitH PPis
Country national Household survey source Year of
latest PPi
BOlivia 2007 Encuesta de Hogares 2009
Brazil 2008 Pesquisa Nacional por Amostra de Domicilios 2010
COlOMBia 2009 Gran Encuesta Integrada de Hogares 2011
dOMiniCan rePuBliC 2007 Encuesta Nacional de Ingresos y Gastos de los Hogares 2010
eCuadOr 2005 Encuesta de Condiciones de Vida 2008
el salvadOr 2008 Encuesta de Hogares de Propósitos Múltiples 2010
GuateMala 2006 Encuesta Nacional de Condiciones de Vida 2010
Haiti 2001 Enquete sur les Conditions de Vie en Haiti 2006
HOnduras 2007 Encuesta Permanente de Hogares de Propósitos
Múltiples 2010
MexiCO 2008 Encuesta Nacional de Ingresos y Gastos 2009
niCaraGua 2005 Encuesta Nacional de Hogares sobre Medición de
Nivel de Vida 2010
ParaGuaY 2011 Encuesta Permanente de Hogares 2012
Peru 2010 Encuesta Nacional de Hogares 2012
12
1.3. constructIon of the PPI/statIstIcal Methodology
In this section we provide a more detailed description of the statistical methodology and construction of the PPI.
The first step in the construction of the PPI is the identification of the most recent, high quality, nation-ally representative survey that measures either household income and/or expenditures. Table 1 lists the national household surveys used in the construction of the PPI. The surveys include both multi-purpose surveys modeled after the World Bank’s Living Standard Measurement Surveys (LSMS) as well as more directed surveys focusing specifically on income or consumption. These large, specialized surveys have sample sizes ranging from just under 5,000 in the case of Paraguay (Schreiner, 2012b) to over 220,000 households in the case of Colombia (Schreiner, 2012a). In addition to collecting detailed consumption and/or income data, these surveys collect information on a large number (typically between 100–300) of household characteristics.
The most recently available, national household survey thus provides the raw material for constructing the country-specific PPI. These data are used to select the 10 indicators that ultimately appear on the PPI Scorecard. The Scorecard points are derived through estimation of the statistical model of the relation-ship between household poverty status and the 10 indicators in these data. The points are scaled so that, when summed across the 10 indicators, the household’s score falls between 0 and 100, with lower scores corresponding to higher probabilities of falling below the poverty line. A separate non-parametric, statisti-cal technique is used to estimate the probabilities that households with PPI scores within a given range have income or expenditures below a range of different poverty lines. The Lookup Table presents these “Category Likelihoods.”7
Once the national household data set has been identified and acquired, the total sample is randomly di-vided into two equal sized sub-samples:
Construction/Calibration Sample: This sample is used to identify the 10 best predictors of poverty status and estimate the parameters of the statistical model.8 The statistical model utilized is the logit model,
which takes the following form:
In the above equation, Yi is the observed poverty status of household i, and takes value 1 if the household is poor and 0 if it is not poor; the Xi are the observed values of the 10 household indicators; and the βkare the parameters to be estimated. The function F(.) is the Logistic function. The logit parameter estimates, βk, are then scaled and rounded into integer values such that when they are summed up, the maximum “score” is 100 and the minimum “score” is 0. In order to make adding-up to get the final PPI score easier, the points for each possible answer for the indicators are non-negative integers.
Placing the PPI score on an integer scale from 1 to 100 is an important innovation, because it places the household’s score on a scale that is familiar with MFI management and staff. The household’s PPI score is
7. As seen in the Lookup Table for Mexico in Appendix B, poverty probabilities are provided for twenty PPI five-point score ranges beginning with 0 – 4 and ending with 95 – 100.
8. Clear details of indicator selection are provided in the methodological document for each country’s PPI.
P (Y
i=1IX
1, X
2,..., X
10)=F(β
0+ β
1X
1+ β
2X
2+...+ β
10X
10)=
1+
e
_
(β0+ β1X1+ β2X2+...+ β10X10)
13
not, however, the probability that the household is poor. Instead, an additional step is required to identify the poverty probability. This step is to consult the Lookup Table, which converts the PPI score into a pov-erty probability.
The probabilities in the Lookup Table are calculated using an intuitive and straightforward statistical proce-dure with the Construction/Calibration sample. Specifically, the PPI is “applied” to and a PPI score is gener-ated for each household in the Construction/Calibration sample. Households are then grouped together by their PPI score. The poverty probability associated with each score is simply the percentage of house-holds with that score whose true income or expenditure (as measured by the national household survey) falls below the selected poverty line. These poverty probabilities are then reported in the Lookup Table. Consider, for example, the top left entry in the Lookup Table for Mexico in Appendix B. We see that a household that has a score between 0 – 4 would have an estimated 83.9% probability of being poor as de-fined by Mexico’s National Food Poverty Line. This is because 83.9% of the households in the Construction/ Calibration Sample that had PPI scores between 0 – 4 had incomes below the National Food Poverty Line. So how does the developer select the 10 household indicators for inclusion in the PPI? The specific meth-odology for selecting the 10 “best” indicators includes both objective and subjective criteria. The key ob-jective criteria used is the Concordance Statistic, or “C-Statistic”. The C-Statistic is a conventional test sta-tistic used to evaluate the predictive power of models of binary outcomes, such as the logit model. The C-Statistic measures the ability of the model to correctly classify households as poor versus non-poor.9
The PPI developer selects the 10 indicators in order to maximize the C-Statistic, and thus maximize the probability of correctly classifying households as poor and non-poor. In addition to this statistical crite-rion, the PPI developer also uses a range of subjective criteria to select the 10 indicators. These additional criteria include a range of factors that affect the ease of applying the PPI Scorecard and the accuracy of the responses. For example, the developer considers how easy the question is to communicate to the re-spondent, whether the indicator can be easily verified visually, and the degree to which the question may make the respondent uneasy. In addition, the developer seeks to include some indicators that are likely to change over time and thus will allow the PPI to capture changes in poverty rates over time.
Validation Sample: This second sub-sample of the national household survey is used to evaluate the ac-curacy – including bias and precision – of the Poverty Scorecard. This is done by drawing 1,000 random samples of households from the Validation Sample, using the Poverty Scorecard to estimate the percent-age of poor (i.e., the poverty incidence) in each of these samples, and then examining the empirical dis-tribution of the difference between these estimates and the true values. Specifically, the mean of the poverty incidence over the 1,000 samples is compared to the true mean in order to examine the degree of bias. The 90% confidence interval of the poverty rate is given by the 50th and 950th poverty incidence estimates ordered from smallest to largest. The design documentation for each country-specific PPI pres-ents an analysis of the bias and precision for each of the poverty lines for which poverty probabilities are reported in the Lookup Table.
9. The basic idea behind the C-Statistic is as follows. Assume we have grouped households from the nationally representative survey into their true categories of poor or non-poor. Now, randomly pick one household from the poor group and one from the non-poor group and apply the PPI to both households. The household with the largest PPI value should be the one from the non-poor group. The C-Statistic is the percentage of randomly drawn pairs for which this is true (that is, the PPI correctly classifies the two households in the random pair). The primary objective criteria is thus to select the 10 indicators that maximize the C-Statistic.
14
1.4. dIscussIon of accuracy of the PPI
There are two broad concerns relating to accuracy of poverty measurement tools such as the PPI. The first set of concerns relates to the design of the tool; the second relate to implementation. We discuss imple-mentation in detail in subsequent sections. Here we identify several issues relating to design.
As discussed above, the statistical model underlying the PPI captures the relationships between the select-ed indicators and household poverty (i.e., the βks above) across all households in the nationally representa-tive household survey sample at a given point in time (the year that the national survey was administered). This raises two immediate concerns, both of which are acknowledged and discussed in the PPI design documentation for each country. First, if these relationships change significantly over time but the PPI is not updated to reflect these changes, then the accuracy of the PPI may be reduced. Second, if the rela-tionships vary significantly across sub-groups in the population, and if the MFI’s clients tend to fall within a single sub-group (which they usually do), then some bias may be introduced in the poverty estimates generated by the PPI.
The first concern, namely potential bias resulting from PPIs becoming outdated, can be put into context by examining Table 1 above. Consider MFIs in the LAC region implementing PPIs in 2012. The most recent national survey upon which a PPI is based is that of Paraguay, which is based on a 2011 national survey. Haiti is at the other extreme with its PPI based on a 2001 national survey. This gives a range of at least 1 and at most 11 years between the application of the PPI and the year in which the underlying relationships were estimated. The developers of the PPI acknowledge this issue and, when possible, provide evidence on the degree to which (and the likely direction of ) bias may occur. Consider, for example, the case of Peru. Nationally representative household consumption surveys are administered on an annual basis in Peru. The current PPI is based on the 2010 household survey. Thus one can gauge the loss in accuracy due to this first inter-temporal concern by “applying” the PPI to random samples of households in earlier years of the national household survey and comparing the poverty rate estimated by the PPI to the true poverty rate. This approach is followed by the developers. Specifically, the developers compare estimates of the change in poverty rate over time as estimated by the PPI to the true change as measured by the national household surveys. Returning to the Peru example, the developers find that between 2004 and 2009, the true change in the poverty rate (using the national poverty line) was a decrease of 25.4 percentage points. The PPI, in contrast, predicts that the poverty rate fell by only 21.9 percentage points. The PPI thus under-reports the change by 3.5 percentage points, or about 14 percent of the true value (Schreiner 2012c, p. 41). Whether this is a large or small bias depends on the criteria of the user. Here we make the following three observations.
`
` First, the PPI developers do not try to hide issues of potential bias due to this inter-temporal concern. Instead, when possible, they provide transparent and in-depth analysis of the likely size of this bias. This rigor and transparency is a clear indication of the high quality of the PPI; the self-critique demonstrates that the developers are open to improving the tool so that it can be as useful as possible to the MFI sector.
`
` Second, while the developers have taken important strides in examining the size of potential bias, additional research would be welcomed. In particular, instead of analyzing bias in change in poverty rates, the analysis could focus on a more direct object of interest, namely the bias in the level of poverty rates as a function of the number of years since the most recent PPI was created. A comparison of accuracy decay rates across countries, and specific sub-groups (urban versus rural) with countries would also be important. Exploring patterns in the time path of PPI bias is important as it would provide additional
15
evidence to determine the optimal time to update the PPI. This would be a highly useful and focused area of research that could be supported by the MIF or other donors.
`
` Third, in some countries, updating the PPI is not possible because reliable, more recent nationally representative household survey data is simply not available. In addition, even when national surveys are conducted at a higher frequency, they often are not available to the public for one to two years after the data are collected.
`
` Fourth, although updating the PPI based on more recent national household data will reduce bias, one must weigh the benefit of reduced bias against the costs of updating the PPI. The costs, in turn come in multiple forms. On one hand, the design of an updated PPI – as described above – implies significant human and time resources. On the other hand, updating the PPI implies costs for MFIs, as they must invest time and money in the conversion to the new PPI. This includes understanding the new indicators and, depending on how the MFI implements the PPI, modifying client databases and re-training loan officers or enumerators in the application of the PPI.
The second concern, namely that the relationships between poverty probabilities and indicators may vary across different sub-groups, such as rural-urban or across provinces, is also acknowledged by the PPI developers and discussed in the documentation. In contrast to the potential for bias introduced over time, the developers do not provide systematic evidence regarding the existence or not of sub-group bias. This would appear to be an area of important future research. Specifically, accuracy analysis using a range of sub-groups that would appear relevant for the particular country could be conducted with the Validation Sub-Sample. In Peru, for example, due to different government policies, infrastructural develop-ment and cultural patterns of consumption, one might expect significant differences in the relationships between poverty and the 10 indicators on the PPI across regions. By drawing repeated samples from these groups and comparing the sampling distribution of poverty incidences, evidence on this type of sub-group bias could be generated.10
Again, however, both the benefits and the costs of defining sub-groups must be acknowledged. One of the most attractive features of the PPI is its simplicity. If significant sub-group differences are found, then either sub-group specific PPIs would have to be developed (thereby allowing all the βks and Xs from the logit regression to vary by sub-group) or sub-group control variables would have to be introduced. While the latter may appear straightforward, implementation may be complicated depending on the sub-group definition. Consider the introduction of an urban versus rural indicator. As many MFIs have both urban and rural clients, correctly classifying a household as urban versus rural would add additional complexity to the data-collection process. The complexity would be even greater if a separate PPI existed for urban versus rural households as the enumerator would need to select the correct Scorecard for each client.
A related concern is that the population of MFI clients in a country may itself be a sub-group for whom the relationships between poverty and PPI indicators is systematically different from the average relation-ships captured in the national survey data or even in the geographic area where the MFI operates. To take an extreme example, consider the case of MFIs in Colombia working with internally displaced families. The relationship between poverty and indicators such as education of the household head or possession of certain durable goods is likely to be very different for this sub-population compared to the average relationship across all Colombian households. While this is perhaps an extreme example, it makes the point that the MFI client population may be systematically different (in ways that matter for the estimates
10. As pointed out by Mark Schreiner in comments on this document, this type of analysis, which requires sub-dividing the Validation Sample into sub-groups would be most feasible in those countries whose national household surveys have relatively large samples.
16
generated by the PPI) from the national average. This issue is more difficult to address in the design of the PPI because nationally household surveys often do not contain information on credit access. Even if they did, the size of the sample that are MFI clients would likely be too small to carry out a meaningful analysis. A final design issue, related to the above discussion, is that of clustering. Clients of many MFIs—especially smaller ones with a narrow geographic coverage—tend to be clustered in a relatively small number of districts, municipalities or provinces. Again, if within these clusters the relationship between the indica-tors and poverty is different from the “average” relationship, then bias could be introduced. In addition, if a significant amount of the total variation in income is driven by shocks at the cluster level – for example municipal floods or a provincial drought that reduce income (consumption) but do not necessarily affect the PPI indicators -- then again bias may be introduced. This again suggests the need for conducting accu-racy analysis using samples drawn from regional clusters, as opposed to drawing simple random samples. For example, when evaluating the accuracy of samples of size n = 350, these samples could be drawn with replacement from the same sub-region, such as a province or a group of districts, as opposed to the cur-rent practice of drawing random samples from the entire accuracy evaluation sub-sample.
Overall, the PPI developers do an excellent job at identifying challenges to and evaluating the accuracy of the PPI estimates in the design stage. They acknowledge and discuss, in the PPI documentation, almost all the potential sources of bias noted here. The accuracy evaluation for each PPI is well documented and extensively described in the country-specific PPI reports that are all publicly available. Some additional analysis would be welcomed, in particular evaluating the potential gains in accuracy from accounting for sub-regions. Remaining questions, such as implementation error (which we discuss in the upcoming sec-tions) and the potential differences in the MFI sub-population relative to the national household survey sample cannot be addressed without additional fieldwork.11
11. The ideal design would be to apply the national income or expenditure survey to a sample of MFI clients to whom the PPI is also administered and directly compare poverty estimates.
17
2.
Primary challEngES to EffEctivE
imPlEmEntation of thE PPi
We begin by describing the two main challenges that PPI implementation faces in order to generate high-quality poverty estimates. It is important to note that these two challenges are conditional on the statistical quality of the PPI itself. Of course a PPI that is poorly designed or based on low quality or old data, will generate poor poverty estimates even if MFIs overcome all implementation challenges. The two challenges are cost and adverse incentives.
2.1. challenge 1: cost
To get a handle on costs, it is useful to divide overall PPI implementation into roughly three stages: `
` adoption: This includes the process of management learning about the PPI; training of management and staff about the general methodology underlying the PPI and how the PPI will be used by the MFI; specific training of loan officers about data collection (if data collection is not outsourced); establishment and management of a PPI data base and potential integration of the PPI data base with the existing client data base.
`
` execution: This includes the definition of the client population of interest (new clients, all clients, etc.), the drawing of the sample, and the collection and entry of the PPI data.
`
` analysis and dissemination: This includes the calculation of poverty rates, writing of reports, and communication of results internally and externally. This final step may also include the contracting of an external auditing institution to verify the implementation process.
Within each stage, costs come in multiple forms, none of which are trivial: `
` Monetary costs: The good news for end-users is that the PPI is freely and publicly available. In many countries, technical assistance is also available for some MFIs, especially those who work with the Grameen Foundation, OikoCredit, or have support from international development institutions such as IDB to support adoption of the PPI. This dramatically lowers the cost of adoption. The bad news is that, even with this cost reduction, adoption, execution and analysis are not costless. If the MFI chooses to integrate the PPI data into the client data base, programmers must be hired or, at a minimum, significant
18
time of existing staff must be used.12 Based on interviews with MFIs, the monetary costs to execute a
sample-based PPI of approximately 350 clients, which is a common sample size used by MFIs consulted for this report, ranges between $2,000 – $10,000. For a large MFI, this may be a relatively minor cost, but for smaller MFIs this may represent a substantial outlay. This cost does not include additional costs of acquiring or adapting existing software; establishing, managing or merging the PPI data base with the client data base; or time and personnel costs of analyzing the PPI data. Analysis requires staff time, thus raising the salary costs of the MFI. Finally, based on interviews with Microfinanzas Rating and Planet Finance, an external audit of Social Performance Indicators, of which the PPI is one component, can cost between $3,000 – $10,000.13
`
` time costs: The time dimension of costs is multi-faceted and non-trivial. Learning about the PPI by management, training of staff, and participation in local and regional workshops all take the time of MFI management. The time required for execution varies greatly depending on the method used for data collection. If the data collection is outsourced to a third party, then the time cost is relatively low for the MFI (although the MFI must be involved defining the relevant client population and drawing the sample). If instead, the data is collected by loan officers, either as part of the loan application process or as a separate survey, then the time costs may be significantly higher, in particular if the PPI is applied as a separate survey. Perhaps most importantly, developing the internal human capital—if it does not already exist—required for the MFI to correctly implement and effectively utilize the PPI requires significant investment in time. If this human capital is not developed, it is likely that the institution will not “buy in” to the PPI process, thereby raising the likelihood that the PPI will not be implemented well. It is also important to note that the investment in time, if it is made, may result in benefits beyond the PPI itself. Specifically, serious implementation and use of the PPI may result in a change in the organizational culture of the MFI, with greater emphasis placed on quantitative, evidence-based decision-making which, arguably, would strengthen the MFI.
2.2. challenge 2: adverse IncentIves
Why do MFIs use the PPI? This is a logical starting point of our analysis of PPI implementation as it will sug-gest both the expected benefits derived by MFIs and the some of the potential incentive-related concerns with respect to appropriate implementation. In general, we can identify two main motivations: Internal and External.
`
` internal Motivation: By internal motivation, we mean the reasons that the MFI uses the PPI to adjust business or management practices or, in the words of numerous MFI managers, “para la gestión interna”. Internal motivation is crucial for the PPI ‘s sustainability for, without it – or if the MFI does not perceive any value to integrating the PPI into the business model of the institution – then it is unlikely that the MFI will continue to use the PPI over time. Internal motivation, in turn, can be separated into two further categories: 1) Identifying whether the poverty level of the MFIs client base is consistent with the MFIs mission and 2) Modifying or developing new products. When used for internal motives, the MFI wants
12. Note that the PPI data need not be integrated into the MFI’s client data base. The PPI developer provides a stand-alone Excel spreadsheet that may be used to independently store and analyze the PPI data.
13. External audits, of course, are by no means required for MFIs implementing the PPI. If one primary objective of the MFI is to present client poverty rates to external funders, then an external audit may be sensible. If, however, the primary objectives are internal to the institution, then internal auditing procedures may be sufficient to provide quality control.
19
to learn the true poverty rates of their clients as revealed by the PPI and, if appropriate, adjust policies or practices. As such, the scope for morally hazardous behavior (intentional mis-use or mis-reporting of the results of the PPI) is reduced. Moral hazard may still exist internally if, for example, incentives of the MFIs management are not completely aligned with the incentives of the individual field agents applying the PPI. For example, loan officers who are required to apply the PPI to clients may derive no direct benefit from asking the additional 10 questions, but they do perceive a cost as asking these questions implies additional time. This misalignment of incentives may lead the loan officer to apply the PPI in a quicker and less rigorous manner, thereby reducing the reliability of the poverty rate estimate generated by the PPI.
`
` external motivation: By external motivations, we mean the reasons that the MFI uses the PPI to present the poverty profile of its clients to the outside world, in particular national and international donors and investors. External motives are associated with two separate concerns. First, external motives generate the potential for incentive and moral-hazard issues. If MFIs derive benefits, say in the form of cheaper lines of credit, if they can demonstrate minimum poverty rates of clients, then MFIs may have an incentive to either over-state the “true” poverty rate as revealed by the PPI or to implement the PPI in a way that generates an artificially high estimate. Second, if the primary motivation for implementing the PPI is external, then minimal effort may be made to apply the PPI in a rigorous way; again potentially jeopardizing the quality of the poverty estimates generated by the PPI. It is important to note that vulnerability to intentional mis-reporting is not a criticism of the PPI per-se. Indeed any quantitative poverty measurement tool would be subject to the same challenges. The transparency and extensive documentation provided by the PPI designers, in fact, help to reduce the scope for “bad behavior”. We now turn to more specific aspects that highlight the variation in the ways that MFIs implement and utilize the PPI.
20
3.
what QuEStionS do mfiS
try to anSwEr with thE PPi?
We begin with the most basic question: When an MFI implements a PPI, what is it trying to learn? While at first glance, the answer seems straightforward – the poverty rate of clients – at second glance, the answer is somewhat more complicated and, indeed, MFIs use the PPI to answer fairly different questions. More in-depth descriptions of specific questions will be provided in the in-in-depth case studies in Section 5.
The first source of heterogeneity derives from the population of interest defined by the MFI. In other words, the first step in the execution of the PPI is to answer the question: For whom do we want to esti-mate the poverty rate? The primary target populations defined by the visited MFIs include:
`
` all Clients: This group is typically defined as any individual who either took a loan or had an active loan in the previous 12 months.
`
` new Clients: This group is typically defined as any individual who took their first loan in the previous 12 months.
`
` Clients of specific regions or Branches: In this case, data is only collected from clients in a subset of the MFIs operating areas or branches.
The second source of heterogeneity derives from whether the MFI seeks to answer dynamic questions. These potential dynamic questions include:
`
` How did the percentage of poor clients (for any of the target populations defined above) change over a given period of time? Answering this question requires applying a survey to a randomly selected sample from the same target population (but not necessarily the same individuals) over time. As we will see in more detail in a subsequent section, Prisma, for example, sought to see how the poverty rates of new clients changed from 2009 to 2010. To do so, in 2009 they applied the PPI to a random sample of clients that entered in 2009, and in 2010 applied the PPI to a random sample of clients that entered in 2010. `
` What is the average change in poverty rates of cohorts, or particular groups of individuals over time? Continuing with the example of Prisma, management wanted to track over time the poverty rates of clients who had entered in 2009. To do so, they applied the PPI to the same sample of clients who entered in 2009 in 2010 and 2011. This is a more difficult question to implement because it implies administering the PPI to the same sample of individuals over time. It also is complicated by attrition, as some clients originally interviewed will leave the institution. The specific question answered is then, “What is that change in poverty rates of the individual clients over time, conditional on remaining a client?” The attritors themselves raise a host of interesting questions including, do clients leave because they have become wealthier and have graduated to the formal financial sector? Or are they poorer than
21
those who continue to be clients, perhaps because they were hit by shocks or were simply not good entrepreneurs and were unable to repay the loan? Answering these questions would require applying the PPI to the attritors. While these questions may be of business interest to the MFI, the additional cost may prevent MFIs from designing the PPI sample to permit answering them. In order to answer these questions, additional resources from sources such as the MIF may be required.
A final important issue to address in this section is that of statistical significance of results (i.e., answers to the questions being asked). While the PPI documentation is quite clear about margins of errors for the point estimate of poverty rate for the target population upon which the sample is drawn, the MFIs typi-cally seek to compare poverty rates for sub-groups within the sample. For example, in its 2011 PPI report, Prisma reports comparisons of poverty rates by: gender, principal economic activity, and branch. As these are sub-groups, however, the same margins of error are not applicable. Instead the margins of error will be larger and, in most cases, substantially so.
The lack of understanding of the relationship between margins of error when making poverty rate com-parisons on sub-samples is a potential problem. First, it may give a false sense of the poverty profile of the MFI to the external world. Second, and more importantly, if the MFI is making any internal adjustments to policy based on these sub-group comparisons, they would be making these decisions based on a false sense of precision.
A recommendation of this report is that greater attention should be placed on the interpretation of re-sults and on notions of statistical significance in PPI training. Emphasis should be placed on the notion of confidence interval around the point estimate of the poverty rate of the overall target population. Caution should be urged on any sub-group comparison.
22
4.
how arE thE data collEctEd?
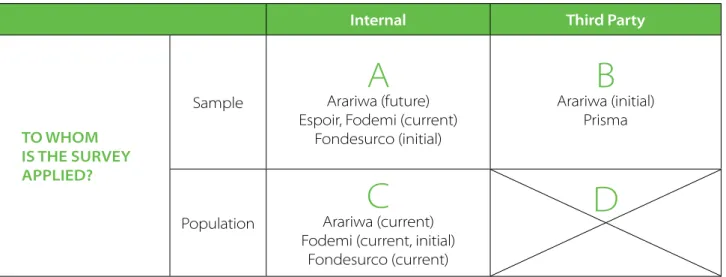
MFIs enjoy (or are faced with) several important choices in the means by which they collect the PPI data from clients. Different choices taken by MFIs with respect to data collection lead to widely varying experi-ences with the PPI across MFIs. Figure 1 summarizes two of the main dimensions of choice and provides a stylized categorization of MFI approaches to the PPI.
FiGure 1. HeterOGeneitY in PPi data COlleCtiOn MetHOdOlOGY
Once the target population has been defined (i.e., new clients, all clients, clients in certain regions, etc.), the MFI must decide if they will administer the PPI to a randomly selected sample from that target population or instead to the entire target population. This choice is represented by the rows in Table 1. In addition, the MFI must decide if it will use its own personnel to administer the PPI or instead contract an independent, third party for this task. The term in parentheses denotes when the MFI was located in the specific cell. For example, Arariwa appears both in cell A and B because in the initial year of adoption, Arariwa hired a third party firm to administer the PPI (cell B) but the institution plans on implementing the PPI in future years with in-house personnel (cell A).
Consider each of the MFIs visited listed above: `
` Prisma: Prisma adopted the PPI in 2008 after participating in a training program provided and partially funded by the Grameen Foundation and OikoCredit. Since adopting the PPI in 2008, Prisma has contracted a third-party survey firm to carry out the data collection. Prisma defines the target population, draws the sample, and carries out data entry after receiving the paper PPI survey forms. The sole responsibility of the third party firm is to do the data collection. As discussed above, Prisma defines a number of different
internal third Party
tO WHOM is tHe surveY aPPlied?
Sample Arariwa (future)
A
Espoir, Fodemi (current)Fondesurco (initial)
B
Arariwa (initial) Prisma
Population Arariwa (current)
C
Fodemi (current, initial)Fondesurco (current)
D
23
target populations for poverty measurement. For each of these populations, Prisma selects a random sample of clients. Prisma uses the PPI user manual to select the appropriate sample size in order to achieve a desired level of precision. The sample sizes for each target population are typically around 350 clients. `
` Fondesurco: In 2008, Fondesurco implemented the PPI on a pilot basis. Training and implementation of the initial pilot was provided by the Programa Misión, a project aimed at strengthening social performance measurement and reporting and supported by the Ford Foundation and CGAP with local support from Catholic Relief Services (CRS) and COPEME (the Peruvian microfinance association) in Peru. In this pilot, Fondesurco loan officers and a group of individuals from the target communities were trained to apply the survey to a sample of 353 clients. When Fondesurco initially adopted the PPI, they were thus in cell A of Table 1. Beginning in 2009, management decided to implement the PPI to the entire population of clients. Specifically, the PPI is administered at the moment of loan application for new clients and loan renewal (renovación de crédito) for existing clients. The PPI variables have been added to the first part of the loan application form. Loan officers thus collect the PPI data at the same moment of filling out the loan application form. Fondesurco is thus currently placed in cell C in Table 1.
`
` arariwa: In 2010, Arariwa applied the PPI to a sample of 2,400 client families. This pilot application was a part of a broader research program funded by CGAP and implemented by Innovations for Poverty Action (IPA) on the role of MFIs in promoting mobility of households out of extreme poverty (graduación de la extrema pobreza). In this initial pilot phase, Arariwa is thus placed in cell B, since IPA carried out the survey which was administered to a random sample. In 2011, Arariwa sought to establish a “baseline” snapshot of poverty rates of the entire institution and thus applied the PPI on the entire population of clients. In this baseline, loan officers applied the PPI at the moment the loan was distributed to the client
(al momento del primer desembolso). We thus place Arariwa in cell C for their current situation. Finally, moving forward, Arariwa plans on following up with the PPI on a 10 – 20% sample of all clients in order to track changes in poverty rates of the overall client base over time. As the plan is for loan officers to again administer the PPI to the future sample, we expect Arariwa to be in cell A in the future.
`
` Fodemi: In 2010, Fodemi management and loan officers participated in a PPI training workshop funded by OikoCredit. After this training, Fodemi applied the PPI to the population of new clients, defined as those who took their first loan in 2010. Loan officers applied the PPI during the same visit in which they fill out the loan application (solicitud de crédito). In contrast to Fondesurco, which has integrated the PPI questions into the loan application, Fodemi administers the two forms separately. Currently, Fodemi continues to apply the PPI to the population of new clients. In addition, beginning in the second half of 2012, Fodemi began administering the PPI to a 10% sample of the new clients from 2010. The goal is to measure the change in poverty rates after two years for those who joined in 2010. As loan officers will again administer this sample-based PPI, we also place Fodemi in Cell A of Figure 1.
`
` espoir: In 2009, Espoir participated in a PPI training workshop funded and run by OikoCredit. After this training, Espoir applied the PPI to a sample of about 680 households drawn from the target population of all clients. In 2011, Espoir again applied the PPI to a sample of the same size, this time drawn from the target population of new clients. Espoir uses its own staff, although the individuals who implement the PPI are health workers (promotores de salud) from another unit within Espoir. Espoir is thus classified in cell A in Figure 1.
Finally, there are no institutions in cell D. This is because it would be prohibitively costly to hire a third party to independently collect the PPI data on the entire target population.
24
Discussion
The classification above suggests a somewhat surprising result; namely that, even within this relatively small group of MFIs, we observe a lot of variation in data collection methodologies. In addition, this varia-tion exists both across MFIs and, in some cases, within a given MFI.
First, consider heterogeneity across MFIs. At one extreme, Prisma relies on a third party firm and thus main-tains separation between the institution and the data-collection process. Prisma cites two reasons for this choice. First and foremost, using a high-quality, independent firm to carry out the data collection yields the highest quality of data; both because the independent enumerators have no incentive to manipulate the data and because specialized personnel are more qualified and less apt to make data-collection errors. In addition, Prisma prefers to avoid placing any additional burdens of data collection on loan officers. At the other extreme, Fondesurco uses its own loan officers to apply the PPI to the entire population of cli-ents. Fondesurco has not sought to maintain separation between the PPI and the day-to-day operations; instead they have fully integrated the tool into the normal operations of the institution.
Even when we consider a single MFI, we observe heterogeneity in the data collection methodology. This is due, on one hand, to the testing and learning process. Fondesurco, for example, tested the PPI with a sample-based application. Based on this experience, the institution felt that the PPI could indeed generate not only external, but—especially—internal benefits, and thus decided to more fully adopt the tool and move toward a population based, internal methodology (i.e., move from cell A to C). On the other hand, MFIs seeking to answer multiple types of questions may use multiple approaches even at a given point in time. Fodemi provides one example, as in 2012 they began applying the PPI to the entire population of new clients as well as to a randomly drawn sample of clients who joined the institution in 2010.
Should the high degree of heterogeneity raise a concern in terms of quality of data collected? This is a dif-ficult question as there important tradeoffs associated with these choices, in particular, with the use of a third party for data collection.
On one hand, one may argue that the use of a third party raises the quality of the data collected for a number of reasons. First, as discussed above, the third party (if appropriately chosen) is independent of the MFI and thus has no incentive for manipulating the data. Second, again if appropriately chosen, the third party should be specialists in the application of household surveys and would be likely to do a better job at collecting household data. Similarly, loan officers typically have, at best, little incentive to carefully collect the PPI data. In nearly all MFIs, loan officers’ primary incentives are to increase the volume of loans and to ensure loan repayment. As the PPI adds time to the loan application process without adding information that is relevant to predict credit-worthiness, it may be seen as a nuisance to loan officers. This was indeed confirmed by loan officers from both Fondesurco and Fodemi who claimed that when the PPI was first introduced the loan officers were upset and viewed the PPI questions as an imposition and impediment to effectively performing their job. Even though management and the loan officers from Fondesurco and Fodemi stated that once the loan officers became accustomed to having to ask the PPI questions they no longer viewed them as an imposition, it is easy to imagine that the quality of PPI data collected by loan of-ficers is lower than that collected by qualified third-party survey institutions. Contracting a third party also eliminates the (potentially large) fixed time cost to management to train loan officers and the marginal costs of supervising and monitoring loan officers in their application of the PPI.
Weighed against this likely benefit of higher data quality from third-party data collection is the monetary cost. Prisma, the only MFI here that consistently uses a third party, paid its third-party service provider about $13,000 to carry out the 1,200 surveys implemented in 2012. One way to think about the cost-benefit trade-off of inter-nal versus exterinter-nal application of the PPI is through fixed versus margiinter-nal costs. The margiinter-nal costs of exterinter-nal
25
application are high; each additional survey may cost as much as $10 - $15.14 The fixed costs, however, are
relatively low as there is no need to train loan officers. In contrast, when the PPI is applied by loan officers who are already collecting information via a loan application, internal application implies relatively low marginal costs. These marginal costs come in the form of the extra few minutes required for the loan officer to ask the additional 10 PPI questions and for management to monitor the loan officer. If, however, a visit to the client’s home was not previously a requirement of the loan application process, then the marginal costs would be sig-nificantly higher as a visit to the home is (at least in theory) required for PPI application. Compared to external application, the fixed costs of internal application are likely to be significantly greater as internal application requires lengthy, time intensive training of loan officers.
One undeniable, and potentially very important, advantage of internal application of the form followed by Fondesurco, i.e. applying the PPI as a census to all clients when they apply or re-apply for loans, is that the range of questions that can be examined by the MFI is much greater. As Fondesurco applies the PPI to the population of all clients each year, they are able to compare poverty rates across sub-groups and track poverty rates of specific groups over time. Of course the range of questions that can be answered via external, sample-based application is not any less than with internal application; however, the number of different questions that may be answered is significantly less because a separate sample must be drawn from each target population corresponding to the question being asked. Thus, in practice, the range of questions that will be answered by the PPI will be reduced under external than internal application and, as a result, the usefulness of the PPI to the MFI may also be reduced.
14. Note that Prisma was the only institution that provided information about the cost of third party implementation. As such, this should not be taken as representative of other third parties.
26
5.
imPlEmEntation caSE StudiES
This section provides additional detail regarding implementation and findings for two of the MFIs, Prisma and Fondesurco. These two are chosen as they demonstrate significantly different approaches to imple-mentation, as reflected in their positions in Figure 1, which describes data collection methodologies.
5.1. PrIsMa: saMPle based, dynaMIc use of the PPI
Prisma is an MFI with a total of just under 21,000 clients spread across 19 branches throughout Peru. Within Latin America, Prisma is one of the earliest adopters of poverty measurement tools. They participated in pilot applications of both the PPI and USAID’s alternative tool, the PAT, in 2008. Subsequently, Prisma has continued with annual applications of the PPI to different sub-populations of their overall clients. As de-scribed above, Prisma uses a third party to collect the PPI data on randomly drawn client samples. Prisma defines a range of questions it seeks to answer, which in turn define the appropriate sub-populations from which samples must be drawn. Prisma has in-house personnel to carry out the sample design and sample selection. The third party receives the list of sample clients and is responsible solely for data collection. Table 2 summarizes these populations, the sample sizes and the estimated percentage of each sub-population found to be below the Peruvian national poverty line.
taBle 2. PPi iMPleMentatiOn and POvertY results FOr PrisMa*
Year sub-Population sample size % Below national
Poverty line
2008 All clients (in 2 branches) 349 36.5%
2009 New clients in 2009 357 35.3%
2009 All clients 375 31.8%
2010 New clients from 2009 302 33.6%
2010 New clients in 2010 346 31.1%
2010 All clients 376 30.4%
2011 New clients from 2009 229 30.8%
2011 New clients from 2010 N/A 28.5%
2011 New clients in 2011 347 32.0%
2011 All clients 377 23.6%
source: *This table is based on Fernández Concha (2011).
27
In 2008, Prisma participated in a pilot implementation of the PPI in two of their 19 branches. The third party applied the PPI to a random sample of 349 clients in these two branches. The specific question Prisma sought to answer in this pilot program was: “What percentage of all clients in the two selected branches were poor?” The answer, according to the PPI, was 36.5%.
Based on this pilot experience, the managers of Prisma decided to apply the PPI on an annual basis. Ac-cording to Diego Fernández, Director of Prisma’s microfinance operations, the institution felt that the PPI yielded sufficiently accurate poverty estimates and was sufficiently easy to implement to justify continued use. One particularly attractive feature of the PPI to Prisma is the ease of generating poverty comparisons across a range of sub-groups, such as across branches, across male versus female clients and across rural versus urban clients.
Prisma also took a decision to apply the PPI to different sub-groups in order to answer a range of different question. This is made clear with reference to Table 2. In 2009, Prisma applied to PPI to two separate sub-groups: 1) All clients and 2) New clients (who had become first-time Prisma borrowers during 2009). This required drawing two separate random samples; a sample of size 357 new clients and a separate sample of size 375 from the entire client population. This use of the PPI allowed Prisma to answer the question: How does the poverty rate of new clients compare to the poverty rate of all clients in the institution? The results, reported in the last column of Table 2, show that the poverty rate among new clients was slightly higher than the overall client population (35.3% versus 31.8%).
In 2010, Prisma added an additional level of complexity of PPI use. Specifically, they decided to answer the following dynamic question: “How did the poverty rate change from 2009 to 2010 for those clients who had entered in 2009?” In order to answer this question, Prisma sought to apply the PPI to the 302 new clients from 2009. In Table 2, we see that the poverty rate of this group fell slightly from 35.3% to 33.6% after one year. In 2010, Prisma applied the PPI to random samples from two additional sub-groups: 1) New clients that entered in 2010 and 2) The entire client population.
Finally, in 2011, Prisma applied to PPI to four separate sub-samples: 1)