Principles of Cost Accounting, Fourteenth Edition Edward J. VanDerbeck VP/Editorial Director: Jack W. Calhoun Publisher: Rob Dewey Acquisitions Editor: Keith Chassé
Associate Developmental Editor:
Michael Guendelsberger
Marketing Manager:
Kristen Hurd
Content Project Manager:
Starratt E. Alexander
Manager of Technology, Editorial:
John Barans
Technology Project Manager:
Scott Hamilton Manufacturing Coordinator: Doug Wilke Production House: Newgen–Austin Printer: Transcontinental Louiseville, QC Art Director: Linda Helcher
Cover and Internal Designer:
Jennifer Lambert, Jen2Design, LLC
Cover Images:
© Mike Dobel/Masterfile
COPYRIGHT © 2008, 2005 Thomson South-Western, a part of The Thomson Corporation. Thomson, the Star logo, and South-Western are trademarks used herein under license.
Printed in Canada 1 2 3 4 5 10 09 08 07 ISBN 13: 978-0-324-37417-9 ISBN 10: 0-324-37417-8
ALL RIGHTS RESERVED. No part of this work covered by the copyright hereon may be re-produced or used in any form or by any means—graphic, electro-nic, or mechanical, including photocopying, recording, taping, Web distribution or information storage and retrieval systems, or in any other manner—without the written permission of the publisher.
For permission to use material from this text or product, submit a request online at http://www. thomsonrights.com.
Library of Congress Control Number: 2007921930
For more information about our products, contact us at:
Thomson Learning Academic Resource Center
1-800-423-0563
Thomson Higher Education 5191 Natorp Boulevard Mason, OH 45040 USA
C
HAPTER
1
I n t r o d u c t i o n t o C o s t
A c c o u n t i n g
An article in the December 21, 2005,Cincinnati Enquirer,“Toyota poised to overtake GM as No. 1,”indicates that one reason for General Motors’ troubles has been costly health care benefits for workers and retirees. “Even in North America, (Toyota’s) factory labor costs are lower be-cause it pays a bit less for labor and is not encumbered by excessive benefit costs,”stated Peter Mordici, University of Maryland economist and auto industry expert. Another article in the May 21, 2006, edition of the same paper quotes Ford attorney Jonathan Abram as saying, “health care costs the company $1,100 per manufactured vehicle, compared with $450 per vehicle at Japanese competitors.”
. What is the total cost to make and sell each Toyota Scion xB or Chevrolet HHR?
. How many automobiles and at what prices must they be sold to cover costs and to provide shareholders with an acceptable return on their investment?
. Given that auto prices may be constrained by competitors’prices, what cost-cutting measures must GM implement to return opera-tions to normal profit margins?
These questions can be best answered with the aid of cost information introduced in this and the following chapters.
T
he importance of accounting information to the successful operation of a business, including specific cost data, has long been recognized. How-ever, in the current global economic environment, such information is more crucial than ever. Automobiles from Korea, clothing from China, electronic equipment from Japan, and microchips from Ireland are just a few examples ofLearning Objectives After studying this chapter, you should be able to:
LO1 Explain the uses of cost accounting data.
LO2 Describe theethical re-sponsibilities and cer-tification requirements for management accountants.
LO3 Describe the relationship of cost accounting to financial and manage-rial accounting.
LO4 Identify the three basic elements of manufac-turing costs.
LO5 Illustrate ba-sic cost ac-counting procedures.
LO6 Distinguish between the two basic types of cost accounting systems.
LO7 Illustrate a job order cost system.
foreign-made products that have provided stiff competition to U.S. manufacturers both at home and abroad. As a result of these pressures, companies today are placing more emphasis on controlling costs in an attempt to keep their products competi-tive. For example, U.S. companies are outsourcing production and service activities to other countries, such as production operations in Honduras and Indonesia and technical support call centers in India.
Cost accounting provides the detailed cost data that management needs to control current operations and plan for the future. Figure 1-1 illustrates the produc-tion process for goods and services for which cost accounting provides informaproduc-tion. Management uses this information to decide how to allocate resources to the most efficient and profitable areas of the business.
All types of business entities—manufacturing, merchandising, and service busi-nesses—require cost accounting information systems to track their activities. Man-ufacturers convert purchased raw materials into finished goods by using labor, technology, and facilities.Merchandiserspurchasefinished goods for resale. They may be retailers, who sell products to individuals for consumption, or whole-salers, who purchase goods from manufacturers and sell to retailers.For-profit service businesses, such as restaurants, law firms, and NFL football teams, sell services rather than products.Not-for-profit service agencies,such as charities, governmental agencies, and some health care facilities, provide services at little or no cost to the user.
The nature of the manufacturing process requires that theaccounting infor-mation systems of manufacturers be designed to accumulate detailed cost data relating to the production process. It is common today for manufacturers of all sizes to havecost accounting systemsthat track the costs incurred to produce and sell their diverse product lines. While the cost accounting principles and proce-dures discussed in the text mostly emphasize manufacturers, many of the same principles apply to merchandising and service businesses. Cost accounting is essen-tial to the efficient operation of fast-food restaurants, athletic teams, fine arts groups, hospitals, social welfare agencies, and numerous other entities. Chapter 9, and various other points throughout the text, illustrates cost accounting procedures for service businesses.
Figure 1-1 Production Process for Goods and Services
Raw materials
Conversion process
Outputs Inputs (factors of production)
Natural resources
Human resources Capital
Goods
Services
FromThe Future of Business, Interactive Edition 4th Edition by GITMAN/MCDANIEL. ©2002. Reprinted with permission of South-Western, a division of Thomson Learning: www.thomsonrights.com. Fax 800 730-2215.
In many ways, the activities of a manufacturer are similar to those of a merchan-diser. They purchase, store, and sell goods; both must have efficient management and adequate sources of capital; and they may employ hundreds or thousands of workers. The manufacturing process itself highlights the differences between the two: merchandisers, such as Best Buy, buy electronic equipment in market-able form to resell to their customers; manufacturers, such as Samsung, must make the goods they sell. Once a merchandiser has acquired goods, it can perform the marketing function. The purchase of raw materials by a manufacturer, however, is only the beginning of a long and sometimes complex chain of events that results in afinished product for sale.
The manufacturing process requires the conversion of raw materials into finished goods through the use of labor and various other factory resources. A manufacturer must make a major investment in physical assets, such as property, plant, and equipment. To producefinished goods, a manufacturer must purchase appropriate quantities of raw materials and supplies, and develop a workforce. In addition to the cost of materials and labor, the manufacturer incurs other expenses in the production process. Many of these costs, such as depreciation, taxes, insurance, and utilities, are similar to those incurred by a merchandising concern. Costs such as machine maintenance and repair, materials handling, production setup, production scheduling, and inspection are unique to manufacturers. Other costs, such as selling and administrative expenses, are similar to those incurred by merchandisers and service businesses. The methods of accounting for sales, cost of goods sold, and selling and administrative expenses for a manufacturer are similar to those of merchandisers. Service businesses, by comparison, have no inventories because the service is consumed at the time it is provided. Service businesses have revenue and operating expenses, but no cost of goods sold.
Note that product quality is as important a competitive weapon as cost control in the global arena. Originally issued for companies marketing products in Europe, a set of five international standards for quality management, ISO 9000–9004, were designed by the International Organization for Standardization, based in Switzerland. The standards require that manufacturers have a well-defined quality control system and that they consistently maintain a high level of product quality to enhance customer satisfaction. The standards are accepted in 156 countries, 103 of which are“member bodies”with full voting rights on technical and policy issues.1 Major U.S. companies such as General Motors and Procter & Gamble require their suppliers to obtain ISO 9000 certification.
Uses of Cost Accounting Data
Principles of cost accounting have been developed to enable manufacturers to process the many different costs associated with manufacturing and to provide built-in control features. The information produced by a cost accounting system provides a basis for determining product costs and selling prices, and it helps management to plan and control operations.
Determining Product Costs and Pricing
Cost accounting procedures provide the means to determine product costs and thus to generate meaningful financial statements and other reports relevant to
1 International Organization for Standardization,“ISO Members,”www.iso.org.
LO1 Explain the uses of cost accounting data.
management. Cost procedures must be designed to permit the determination of
unit costsas well as total product costs. For example, the fact that a manufacturer spent $100,000 for labor in a certain month is not, in itself, meaningful; but if this labor produced 5,000finished units, the fact that the cost of labor was $20 per unit is significant. This figure can be compared to the company’s unit labor cost for prior periods and, often, to the labor cost of major competitors.
Unit cost information is also useful in making a variety of important marketing decisions such as:
1. Determining the selling price of a product. Knowing the manufacturing cost of a product aids in setting the selling price. It should be high enough to cover the cost of producing the item and the marketing and administrative expenses at-tributable to it, as well as to provide a satisfactory profit to the owners.
2. Meeting competition. If a product is being undersold by a competitor, detailed information regarding unit costs can be used to determine whether the problem can be resolved by reducing the selling price, by reducing manufacturing and selling expenses attributable to the product, or by some combination of the two.
3. Bidding on contracts. Many manufacturers must submit competitive bids in order to be awarded contracts. Knowledge of the unit costs attributable to a particular product may be of great importance in determining the bid price.
4. Analyzing profitability. Unit cost information enables management to determine the amount of profit that each product earns, thereby concentrating its efforts on those that are most profitable. It is not uncommon, however, for some companies to retain a certain product line, known as aloss leader,that yields a very low profit, or even a loss, in order to maintain the product variety that will attract those customers who also purchase the more profitable items.
Planning and Control
The ultimate value of cost accounting lies in the use of the data accumulated and reported. One of the most important functions of cost accounting is to prepare reports that management can use to plan and control operations.
Planning is the process of establishing objectives or goals for the firm and determining the means by which the firm will attain them. Effective planning is facilitated by the following:
1. Clearly defined objectives of the manufacturing operation. These objectives may be expressed in terms of the number of units to be produced, the desired quality, the estimated unit cost, the delivery schedules, and the desired inventory levels. 2. A production plan that will assist and guide the company in reaching its objectives. This
detailed plan includes a description of the necessary manufacturing operations to be performed, a projection of human resource needs for the period, and the coordination of the timely acquisition of materials and facilities.
Cost accounting enhances the planning process by providing historical costs that serve as a basis for future projections. Management can analyze the data to estimate future costs and operating results and to make decisions regarding the acquisition of additional facilities, any changes in marketing strategies, and the availability of capital.
The word “control”is used in many different ways, but from the viewpoint of the manufacturing concern,controlis the process of monitoring the company’s
operations and determining whether the objectives identified in the planning pro-cess are being accomplished. Effective control is achieved through the following three ways:
1. Assigning Responsibility.Responsibility should be assigned for each detail of the production plan. All managers and supervisors should know precisely what their responsibilities are in terms of efficiency, operations, production, and costs. The key to proper control involves the use of responsibility accounting and cost centers. The essence ofresponsibility accountingis the assignment of accountability for costs or production results to those individuals who have the most authority to influence them. It requires a cost information system that traces the data to cost centers and their managers.
A cost center is a unit of activity within the factory to which costs may be practically and equitably assigned. A cost center may be a department or a group of workers; it could represent one job, one process, or one machine. The criteria for a cost center are (1) a reasonable basis on which manufacturing costs can be traced or allocated and (2) a person who has control over and is accountable for many of the costs charged to that center.
With responsibility accounting, the manager of a cost center is accountable only for those costs that the manager controls. For example, labor and materials costs will be charged to the cost center, but the manager may be responsible only for the quantity of materials used and the number of labor hours worked. This manager would probably not be accountable for the unit cost of raw materials or the hourly rate paid to employees. These expenses are normally beyond the manager’s control and are the responsibility of the purchasing and human resource departments. The manager may be responsible for the cost of machinery main-tenance and repair due to misuse in the cost center, but he or she would not be responsible for the costs of depreciation, taxes, and insurance on the machinery if the decision to purchase the machinery was made at a higher level in the organiza-tion. If production in the cost center for a given period is lower than planned, this could be due to poor supervision of production workers, which is the manager’s responsibility. However, if less-skilled workers are being hired by Human Re-sources, this is usually beyond the manager’s control.
Cost and production reportsfor a cost center reflect all cost and production data identified with that center. In a responsibility accounting system, the specific data for which the manager is responsible would be highlighted for the purpose of performance evaluation. Quite often both a cost and production report and a separate performance report will be prepared for a cost center. Theperformance reportwill include only those costs and production data that the center’s manager
can control. An illustration of a performance report appears in Figure 1-2. Note that a variance represents the amount by which the actual result differs from the budgeted or planned amount. If the actual amount spent is less than the amount budgeted for, the variance is favorable (F); if more than budgeted, it is unfavorable(U). An in-depth discussion of budgeting and variance analysis appears in Chapters 7 and 8.
These reports must be furnished at regular intervals (monthly, weekly, or daily) on a timely basis. To provide the maximum benefit, the reports should be available as soon as possible after the end of the period being reported.
Figure 1-2 Performance Report 1 2 3 4 5 6 7 8 9 10 11 12 AB C D E H I J K L M N FG Rosit a ’s M e xic a n R e st aurant P e rf or man c e Repor t— K it chen Sep tem ber 30 , 20 0 8 Budgete d A c tu a l V a ri a n c e Exp e n se Se p te m ber Y e ar-t o - S e pte m b e r Y e ar-t o - S e pte m b e r Y e ar-t o Da te Da te Da te K itc h e n w a g e s $ 5 ,5 00 $ 4 7, 000 $ 5 ,2 00 $ 4 6 ,1 00 $ 3 00 F $ 9 00 F F o o d 17 ,7 0 0 1 5 5 ,3 0 0 1 8 ,3 0 0 1 5 7, 6 0 0 6 0 0 U 2, 3 0 0 U S u p p lie s 3 ,3 0 0 2 7, 9 0 0 3 ,70 0 2 9 ,1 0 0 4 0 0 U 1, 2 0 0 U U tili tie s 1 ,8 5 0 1 5 ,3 5 0 1, 7 3 0 1 6 ,2 0 0 12 0 F 8 5 0 U To ta l $ 2 8 ,3 5 0 $ 2 4 5 ,5 5 0 $ 2 8 ,9 3 0 $ 2 4 9 ,0 0 0 $ 5 8 0 U $ 3 ,4 5 0 U F = F a vo ra b le ; U = U n fa vo ra b le
Reports not produced in a timely fashion are not effective in controlling future operations.
2. Periodically Measuring and Comparing Results. Actual operating reports should be reviewed periodically and compared to the objectives established in the planning process. This analysis, which may be made monthly, weekly, daily, or even hourly in the case of production and scrap reports, is a major part of cost control because it compares current performance with the overall plan. The actual dollars, units produced, hours worked, or materials used are compared with the
budget, which is management’s operating plan expressed in quantitative terms
(units and dollars). This comparison is a primary feature of cost analysis. The number of dollars spent or the quantity of units produced have little significance until compared with the budgeted amounts. Note that the appropriateness of the $157,600 year-to-date expenditure for“Food”in Figure 1-2 can be evaluated only when compared to the budgeted amount of $155,300.
3. Taking Necessary Corrective Action.The reports produced by the measure-ment and analysis of operating results may identify problem areas and deviations from the plan. Appropriate corrective action should be implemented where neces-sary. A significant variance from the plan is a signal for attention. An investigation may reveal a weakness to be corrected or a strength to be better utilized. Manage-ment wants to know not only the results of operations, but also how the results— whether favorable or unfavorable—compare with the plan, why things happened, and who was responsible. For example, management may want to determine the causes of the unfavorable year-to-date variance of $2,300 for“Food”in Figure 1-2. The variance may be due to an uncontrollable rise in food prices or to a controllable waste of food at the restaurant, or a combination of both. Based on the variance analysis, management must be prepared to improve existing conditions. Otherwise, the periodic measurement of activity has little value. Accountants can be key players in this endeavor, as the “Who Are Management Accountants” example illustrates.
WHO ARE MANAGEMENT ACCOUNTANTS? Management accountants are strategicfinancial management professionals who integrate accounting expertise with advanced management skills to drive business performance inside orga-nizations. They serve as trusted partners to executives in all areas of an organization, offering the expertise and analysis necessary for sound business decisions, planning, and support.
Management accountants monitor, interpret, and commu-nicate operating results, evaluate performance, control opera-tions, and make decisions about the strategic direction of the organization. They understand the business formula for deliv-ering value to the customer, arriving at strategies for ident-ifying, developing, marketing, and evaluating a product or
service throughout its entire life cycle. Management accoun-tants create value, rather than simply measuring it.
Management accountants possess advanced financial and strategic management competencies to provide leadership, innovation, and an integrating perspective to organizational decision making in the global marketplace. A management accountant relates the work of the organization and nonfi nan-cial operating measures to the organization’s financial mea-sures, focusing on all aspects of the organizational value creation, including research and development and employee knowledge and capability.
Reprinted with permission from IMA, Montvale, N.J.,“About Management Accounting”from www.imanet.org.
Professional Ethics and CMA Certi
fi
cation
The Institute of Management Accountants (IMA) is the largest organization of accountants in industry in the world. Comparable to the CPA certification for public accountants, the Certified Management Accountant (CMA) certificate, which is awarded by the IMA after completing a college degree, two years of relevant professional experience, and a rigorous four-part examination whose topics include economics, businessfinance, situational analysis, and decision making with a strong emphasis on ethics, evidences a high level of competency in management accounting.
In addition to competency, the need for ethical conduct in managing corpo-rate affairs has never been greater. Individual employees, investors, and the economy as a whole have been negatively impacted by recent accounting scandals where management, including controllers and chieffinancial officers (CFOs), has “cooked the books” to make reported financial results seem better than actual. Enron, WorldCom, Health South, and AOL Time Warner are just a few examples offirms that have had major accounting scandals in recent years. To help curb future abuses, the Sarbanes-Oxley Act of 2002 holds chief executive officers (CEOs) and CFOs accountable for the accuracy of theirfirms’financial statements.
It is equally important for internal accounting reports, prepared by manage-ment accountants, to be as accurate and unbiased as possible. To that end, the IMA has issued a Statement of Ethical Professional Practice that must be adhered to by its members. These standards address members’ responsibility in areas such as maintaining appropriate levels of professional competence, refraining from disclos-ing confidential information, and avoiding conflicts of interest. The complete IMA Statement of Ethical Professional Practice may be found in the appendix to this chapter and at the IMA Web site, which is linked to the text Web site at http:// vanderbeck.swlearning.com.
Relationship of Cost Accounting to Financial
and Managerial Accounting
The objective of accounting is to accumulate financial information for use in making economic decisions.Financial accountingfocuses on gathering historical financial information to be used in preparing financial statements that meet the needs of investors, creditors, and other external users offinancial information. The statements include a balance sheet, income statement, retained earnings statement, and statement of cash flows. Although these financial statements are useful to management as well as to external users, additional reports, schedules, and analyses are required for management’s use in planning and controlling operations. Management spends most of its time evaluating the problems and opportunities of individual departments and divisions of the company rather than looking at the entire company at once. As a result, the externalfinancial statements for the whole company are of little help to management in making these day-to-day decisions.
Management accountingfocuses on both historical and estimated data that management needs to conduct ongoing operations and do long-range planning.
Cost accountingincludes those parts of bothfinancial and management account-ing that collect and analyze cost information. It provides the product cost data LO2 Describe the
ethical re-sponsibilities and cer-tification requirements for management accountants.
LO3 Describe the relationship of cost accounting to financial and manage-rial accounting.
required for special reports to management (managerial accounting) and for inventory costing in the financial statements (financial accounting). For example, cost accounting procedures are necessary to determine whether to make or buy a product component; whether to accept a special order at a discounted price; the amount at which cost of goods sold should be reported on the income statement; and the valuation of inventories on the balance sheet. The various users and uses of cost accounting data are illustrated in Figure 1-3, and Figure 1-4 shows how cost accounting intersects bothfinancial and managerial accounting.
Costs of Goods Sold
Merchandising concerns compute cost of goods sold as follows (the amount of purchases represents the cost of goods acquired for resale during the period):
Beginning merchandise inventory
Pluspurchases
Merchandise available for sale Less ending merchandise inventory Cost of goods sold
Because a manufacturer makes, rather than buys, the products it has available for sale, the term“finished goods inventory”replaces“merchandise inventory,”and the term “cost of goods manufactured” replaces “purchases” in determining the cost of goods sold, as shown below (the cost of goods manufactured amount is
Figure 1-3 Users and Uses of Cost Accounting Information
Cost Accounting System (Accumulates Cost Information)
Characteristics Managerial Accounting
Managers Users: Focus: Uses Of Cost Information: • External Parties (Shareholders, Creditors, Governments) • Managers Entire Business
Product Costs for Calculating Cost of Goods Sold (Income Statement) and Finished Goods, Work in Process, and Raw Materials Inventories (Balance Sheet) Using Historical Costs and Generally Accepted Accounting Principles
Segments of the Business • Budgeting
• Special Decisions Such as Make or Buy a Component, Keep or Replace a Facility, and Sell a Product at a Special Price
• Nonfinancial Information Such as Defect Rates, Percentage of Products Returned, and Percent of On-Time Deliveries (All of The Above Using a Combination of Historical Data, Estimates, and Future Projections Financial Accounting
supported by a schedule detailing the costs of materials and labor, and the expenses of maintaining and operating a factory):
Beginningfinished goods inventory
Pluscost of goods manufactured
Finished goods available for sale Less endingfinished goods inventory Cost of goods sold
The format of the income statement for a manufacturer is not significantly different from that of a merchandiser. However, the cost accounting procedures involved in gathering the data for determining the cost of goods manufactured are considerably more complex than the procedures required to record the purchase of merchandise in itsfinished form. These procedures are introduced in this chapter and discussed in detail in subsequent chapters. Note that the income statements for service businesses do not have a cost of goods sold section, because they provide a service rather than a product.
Inventories
If a merchandiser has unsold items on hand at the end of an accounting period, the cost of the merchandise is reflected in the current assets section of the balance sheet in the following manner:
Current assets: Cash
Accounts receivable
Merchandise inventory
On the balance sheet of a manufacturing concern, the current assets section is expanded as follows: Current assets: Cash Accounts receivable Inventories: Finished goods Work in process Materials
Figure 1-4 Uses of Product Cost Data in Financial and Managerial Accounting
Financial Accounting (for inventory costing
purposes in the financial statements)
Cost Accounting (product cost data)
Managerial Accounting (for special reports to management for decision
The balance of thefinished goodsaccount represents the total cost incurred in manufacturing goods completed but still on hand at the end of the period. The balance of thework in processaccount includes all manufacturing costs incurred to date for goods in various stages of production but not yet completed. The balance of thematerialsaccount represents the cost of all materials purchased and on hand to be used in the manufacturing process, including raw materials, prefabricated parts, and other factory materials and supplies. Raw materials for one company are often thefinished product of another company. For example, rolled steel to be used in the production of Honda Accord automobiles in its Marysville, Ohio, plant would be thefinal product of A.K. Steel, the steel mill in Middletown, Ohio, but raw materials to Honda. Prefabricated parts would include units, such as electric motors, produced by another manufacturer to be used in the assembly of a product such as copying machines. Other materials and supplies might include screws, nails, rivets, lubricants, and solvents.
Service entities do not have inventories on their balance sheets because they provide a service rather than a product. A summary comparison of manufacturing, merchandising, and service businesses appears in Figure 1-5.
Valuation of Inventories.Many procedures used to gather costs are unique to manufacturers. Manufacturers’inventories are valued for externalfinancial report-ing purposes by usreport-ing the inventory costreport-ing methods—such as first-in, first-out (FIFO), last-in,first-out (LIFO), and moving average—that are also used by mer-chandisers. Most manufacturers maintain a perpetual inventory system that provides a continuous record of purchases, issues, and balances of all goods in stock. Generally these data are verified by periodic counts of selected items throughout the year. Under the perpetual system, inventory valuation data for financial statement purposes are available at any time, as distinguished from a
periodic inventory systemthat requires estimating inventory during the year for interim statements and shutting down operations to count all inventory items at the end of the year.
In addition to providing inventory valuation data for thefinancial statements, the detailed cost data and perpetual inventory records provide the information necessary to control inventory levels, to ensure the timely availability of materials for production, and to detect pilferage, waste, and spoilage. Inventory valuation and control are discussed in detail in Chapter 2.
Inventory Ledgers. Generally both merchandisers and manufacturers maintain various subsidiary ledgers, such as that for accounts receivable. In addition, manufacturers usually maintain subsidiary ledgers for the general ledger inventory
Figure 1-5 Comparison of Service, Merchandising, and Manufacturing Businesses
Business Sector Examples Product or Service Inventory Account(s)
Service Hotels, accountants,
hair stylists, sports franchises
Intangible benefits such as lodging, tax preparation, grooming, entertainment
None
Merchandising Bookstores, electronics stores, sports memorabilia shops, beverage wholesalers
Tangible products purchased from suppliers infinished form
Merchandise Inventory
Manufacturing Motorcycle producers, athletic equipment makers, home builders
Physical products created by the application of labor and technology to raw materials
Finished Goods, Work in Process, Materials
control accounts, Finished Goods, Work in Process, and Materials. These sub-sidiary ledgers are necessary to track the balances of the individual raw materials, jobs in process, andfinished jobs on hand. They support the balances in the control accounts and aid in managing the business on a daily basis.
Recall and Review 1
Walton Manufacturing had finished goods inventory of $45,000 on March 1, March cost of goods manufactured of $228,000, and March 31 finished goods of $53,000. Compute the cost of goods sold for the month of March: $ . (See pp. 33–34 for answers to Recall and Review exercises.) You should now be able to work the following:
Questions 1–19; Exercises 1-1 to 1-3; Problems 1-1 and 1-2; Mini-Case; and
Internet Excercise
Elements of Manufacturing Costs
Manufacturing or production costs are classified into three basic elements: (1) direct materials, (2) direct labor, and (3) factory overhead.
Direct Materials
The materials that become part of and can be readily identified with a certain manu-factured product are classified asdirect materials.Examples include lumber used in making furniture, fabric used in the production of clothing, iron ore used in the manufacture of steel products, and rubber used in the production of athletic shoes.
Many types of materials and supplies necessary for the manufacturing process either cannot be readily identified with any particular manufactured item or have a relatively insignificant cost. Items such as sandpaper used in sanding furniture, lubricants used on machinery, and other items for general factory use are classified asindirect materials. Similarly classified are materials that actually become part of the finished product, such as thread, screws, rivets, nails, and glue, but whose costs are relatively insignificant making it not cost-effective to trace them to specific products.
Direct Labor
The labor of employees who work directly on the product manufactured, such as machine operators or assembly line workers, is classified as direct labor. The employees who are required for the manufacturing process but who do not work directly on the units being manufactured are considered indirect labor. This classification includes department heads, inspectors, materials handlers, and main-tenance personnel. Payroll-related costs, such as payroll taxes, group insurance, sick pay, vacation and holiday pay, retirement program contributions, and other fringe benefits, even for the direct laborers, are usually treated as indirect costs. As manu-facturing processes have become increasingly automated, direct labor cost as a percentage of total product cost has decreased. Harley-Davidson, the motorcycle manufacturer, stopped tracking direct labor as a separate cost category because it was only 10% of total product cost but required an inordinate amount of accoun-tants’time to trace directly to products.2
2 W. Turk,“Management Accounting Revitalized: The Harley-Davidson Experience,”Journal of Cost Management, Vol. 3, No. 4.
LO4 Identify the three basic elements of manufac-turing costs.
Factory Overhead
Factory overhead is known by various names—factory burden, manufacturing
expenses, indirect costs, manufacturing overhead, and factory expenses—and in-cludes all costs related to the manufacture of a product except direct materials and direct labor. Thus, factory overhead includes the previously mentioned indirect materials and indirect labor, plus other manufacturing expenses, such as deprecia-tion on the factory building and the machinery and equipment, heat, light, power, maintenance, insurance, taxes, and factory payroll-related costs. As factories have become more automated, factory overhead as a percentage of total manufacturing cost has increased dramatically.
Summary of Manufacturing Costs
The costs of direct materials and direct labor are sometimes combined and described as theprime cost of manufacturing a product. Prime cost plus factory overhead equals the total manufacturing cost. Direct labor cost and factory over-head, which are necessary to convert the direct materials intofinished goods, can be combined and described asconversion cost.These relationships are illustrated in Figure 1-6.
Marketing or selling expenses, general administrative costs, and other nonfac-tory expenditures are not included in the costs of manufacturing. However, some costs incurred by a manufacturer may benefit both factory and nonfactory opera-tions. Examples include depreciation, insurance, and property taxes on a building that houses both the factory and the administrative offices. In this situation, an allocation of cost must be made to each business function.
Flow of Costs
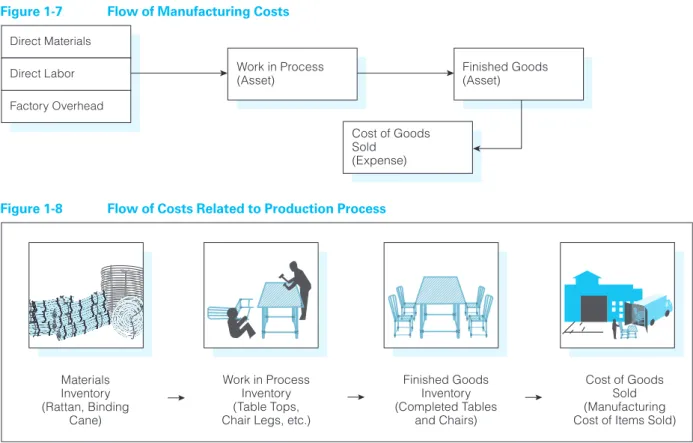
All three elements of manufacturing cost flow through the work in process inventory account. The costs of direct materials and direct labor used in production are charged (debited) directly to Work in Process. All other factory costs—indirect labor, indirect materials, and other factory expenses—are charged to the factory overhead account and later transferred to Work in Process. When goods are completed, the total costs incurred in producing the goods are transferred from Work in Process to Finished Goods. When goods are sold, the costs incurred to manufacture the goods are transferred from Finished Goods to Cost of Goods Sold. Figure 1-7 illustrates theflow of manufacturing costs.
Illustration of Accounting
for Manufacturing Costs
Cost accounting procedures are used to accumulate and allocate all elements of manufacturing cost in a manner that will produce meaningful data for the internal use of management and for the preparation of externalfinancial statements. The
Figure 1-6 Prime Cost and Conversion Cost
Direct Materials Direct Labor Factory Overhead Elements of Cost Prime Cost Conversion Cost
LO5 sic cost ac-Illustrate ba-counting procedures.
following example illustrates basic cost accounting procedures, utilizing the termi-nology and principles that were discussed previously.
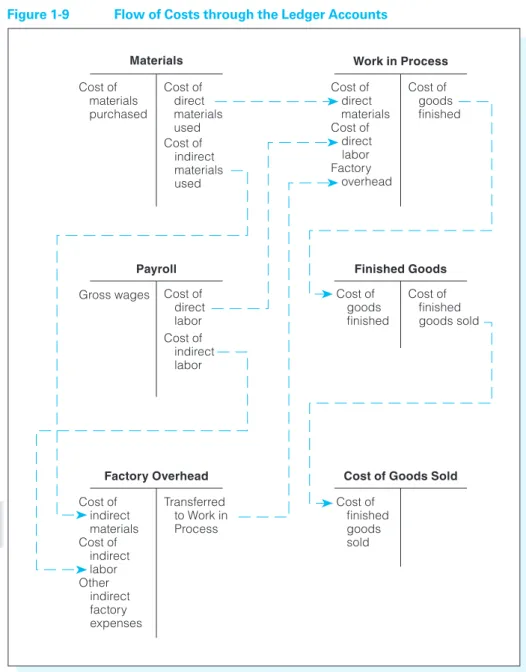
Wicker Works, a small, newly organized corporation, manufactures wicker furniture—both tables and chairs. Thefirm sells products directly to retailers. The basic steps in the company’s production process are as follows:
1. Pieces of rattan, a natural fiber grown in the Orient, are purchased in precut specifications. The pieces are assembled to form the frame of the table or chair. 2. The legs and back uprights of the chair and the legs and outline of the tabletop
are then wrapped in binding cane.
3. The seat and back of the chair and the tabletop are now ready to be woven into place and the chair or table isfinished.
All of the previous steps are performed in a single department. The flow of manufacturing costs for Wicker Works is illustrated in Figure 1-8.
The beginning balance sheet for the company on January 1 of the current year is presented as follows:
Wicker Works Inc. Balance Sheet January 1, 2008
Assets Liabilities and Stockholders’Equity
Cash . . . $ 40,000 Liabilities . . . $ -0-Building . . . 250,000 Capital stock . . . 365,000 Machinery and equipment . . . 75,000 Total liabilities and
Total assets . . . $365,000 stockholders’equity . . . $365,000
Figure 1-7 Flow of Manufacturing Costs
Direct Materials Direct Labor Factory Overhead Work in Process (Asset) Finished Goods (Asset) Cost of Goods Sold (Expense)
Figure 1-8 Flow of Costs Related to Production Process
Materials Inventory (Rattan, Binding Cane) Work in Process Inventory (Table Tops, Chair Legs, etc.)
Finished Goods Inventory (Completed Tables and Chairs) Cost of Goods Sold (Manufacturing Cost of Items Sold)
Assume, for the purpose of simplification in the following example, that the company is currently making only one style of table and no chairs. During January the following transactions are completed and recorded, in summary form: 1. Materials (rattan, binding cane, nails, tacks, staples, glue, and solvents) are
purchased on account at a cost of $25,000.
Materials . . . 25,000 Accounts Payable . . . 25,000
The cost of materials purchased increases the asset account, Materials, and the liability account, Accounts Payable.
2. During the month, direct materials (rattan, binding cane) costing $20,000 and indirect materials (nails, tacks, staples, glue, and solvents for cleaning) costing $995 are issued into production.
Work in Process (Direct Materials) . . . 20,000 Factory Overhead (Indirect Materials) . . . 995
Materials . . . 20,995
Direct materials issued are charged directly to the work in process control account because they can be readily traced to the individual jobs, but the indirect materials are charged to the factory overhead account because they cannot be easily identified with specific jobs. The factory overhead account will be used to accumulate various factory expenses that will later be allocated to individual jobs using some equitable formula.
3. Total gross wages and salaries earned for the month were factory employees working on the product, $10,000; factory supervision, maintenance, and custo-dial employees, $3,500; and sales and administrative employees, $6,500. The entries to record the payroll and the payments to employees (ignoring payroll deductions) would be as follows:
Payroll . . . 20,000 Wages Payable . . . 20,000 Wages Payable . . . 20,000
Cash . . . 20,000
4. The entry to distribute the payroll to the appropriate accounts would be as follows:
Work in Process (Direct Labor) . . . 10,000 Factory Overhead (Indirect Labor) . . . 3,500 Selling and Administrative Expenses (Salaries) . . . 6,500
Payroll . . . 20,000
The wages earned by employees working directly on the product are charged to Work in Process, while the salaries and wages of the factory supervisor and the maintenance and custodial personnel, who do not work directly on the product are charged to Factory Overhead as indirect labor. The salaries of nonfactory employees are debited to the Selling and Administrative Expenses account.
In order to focus on specific cost accounting procedures as distinguished from general accounting procedures, the general ledger account Selling and
Administrative Expenses will be used to accumulate all nonmanufacturing ex-penses. Usually, separate general ledger control accounts would be established for individual selling and administrative expenses.
5. Depreciation expense for the $250,000 building is 6% of the building cost per year. The sales and administrative offices occupy one-tenth of the total build-ing, and the factory operation is contained in the other nine-tenths. The expense for one month is recorded as follows:
Factory Overhead (Depr. of Building) . . . 1,125 Selling and Administrative Expenses (Depr. of Building) . . . 125
Accumulated Depr.—Building . . . 1,250 ($250,000 × 0.06 × 1/12 = $1,250;
$1,250 × 0.90 = $1,125; $1,250 × 0.10 = $125)
The cost accounting principle illustrated here is that only those costs directly related to production should be charged to Factory Overhead. Depreciation on the portion of the building used as office space is an administrative expense and should not be treated as an element of product cost for inventory costing purposes.
6. Depreciation expense for the $75,000 of machinery and equipment is 20% of original cost per year.
Factory Overhead (Depr. of Machinery and Equipment) . . . 1,250 Accumulated Depr.—Machinery and Equipment . . . 1,250
($75,000 × 0.20 × 1/12= $1,250)
All machinery and equipment is used in the factory for production purposes, so the depreciation expense is properly charged entirely to Factory Overhead. 7. The cost of heat, light, and power for the month was $1,500.
Factory Overhead (Utilities) . . . 1,350 Selling and Administrative Expenses (Utilities) . . . 150
Accounts Payable . . . 1,500
Because one-tenth of the building is used for office purposes, it was decided that 10% of the total utilities cost should be allocated to Selling and Adminis-trative Expenses.
8. Miscellaneous selling and administrative expenses for telephone and fax, office supplies, travel, and rental of office furniture and equipment totaled $3,750.
Selling and Administrative Expenses . . . 3,750 Accounts Payable . . . 3,750
Many other expenses may be incurred by a manufacturer, but for simplicity it is assumed that no other expenses were incurred by Wicker Works. After posting the journal entries to the appropriate ledger accounts, Factory Overhead will reflect the following debits:
Transaction Description Amount
2. Indirect materials . . . $ 995 4. Indirect labor . . . 3,500 5. Depr. of building . . . 1,125 6. Depr. of machinery and equipment . . . 1,250 7. Utilities . . . 1,350 Total . . . $8,220
9. The balance in Factory Overhead is transferred to Work in Process by the following entry:
Work in Process . . . 8,220 Factory Overhead . . . 8,220
The three elements of manufacturing cost—direct materials, direct labor, and factory overhead—are now accumulated in Work in Process. The debits in the account are as follows:
Transaction Description Amount
2. Direct materials . . . $20,000 4. Direct labor . . . 10,000 9. Factory overhead . . . 8,220 Total . . . $38,220
10. Assuming that all goods started in process have beenfinished by the end of the month, the following entry transfers the cost of these goods from Work in Process to Finished Goods:
Finished Goods . . . 38,220 Work in Process . . . 38,220
Assuming that 500 tables were produced during the month, the unit cost is $76.44 ($38,220/500). The unit cost for each element of manufacturing cost is calculated as follows:
Units Unit
Total Produced Cost
Direct materials . . . $20,000 500 $40.00 Direct labor . . . 10,000 500 20.00 Factory overhead . . . 8,220 500 16.44 $38,220 $76.44
If the same type of table is produced in future periods, the unit costs of those periods can be compared with the unit costs for this month. Any unfavor-able differences can be analyzed so that management might take appropriate action.
The unit cost also serves as a basis for establishing the selling price of the tables. After considering the anticipated selling and administrative expenses, management establishes a selling price that should provide a reasonable profit. The selling price may be determined by adding amark-on percentage,which is a percentage of the manufacturing cost per unit. For example, if management decides that a 50% mark-on percentage is necessary to cover the product’s share
of selling and administrative expenses and to earn a satisfactory profit, the selling price per unit, rounded to the nearest cent, would be calculated as follows:
Manufacturing cost . . . $76.44 Mark-on percentage (50%) . . . 38.22 Selling price . . . $114.66
In later periods, it might be found that this particular item cannot be sold at a price high enough to provide a reasonable profit. Through analysis of the unit costs, management might effect cost-cutting measures or perhaps even dis-continue production of the item.
From this example, it is apparent that, at any given time, the cost of each item in inventory is available. It should be reemphasized that one function of cost accounting is the accurate determination of the cost of manufacturing a unit of product. This knowledge of unit cost helps management to plan and control operations and to make marketing decisions.
To continue with the example, assume that the following transactions take place in January (in addition to those already recorded):
11. Invoices of $25,000, representing costs of materials, utilities, and selling and administrative expenses, are paid.
Accounts Payable . . . 25,000 Cash . . . 25,000
12. A total of 400 tables are sold to retailers at a net price of $114.66 each. Accounts Receivable (400×$114.66) . . . 45,864
Sales . . . 45,864 Cost of Goods Sold (400×$76.44) . . . 30,576
Finished Goods . . . 30,576
Because the unit cost of each item is known, the cost of goods sold can be determined without a physical inventory or cost estimate.
13. Cash totaling $33,000 is collected on accounts receivable.
Cash . . . 33,000 Accounts Receivable . . . 33,000
The accounts in the general ledger will reflect the entries as follows:
Cash 1/1 Bal. 40,000 3. 20,000 13. 33,000 11. 25,000 73,000 45,000 28,000 Accounts Receivable 12. 45,864 13. 33,000 12,864 Finished Goods 10. 38,220 12. 30,576 7,644
Factory Overhead 2. Indirect materials 995 9. 8,220 4. Indirect labor 3,500 5. Depr. of building 1,125 6. Depr. of machinery & equip. 1,250 7. Utilities 1,350 8,220
Selling and Administrative Expenses
4. Salaries 6,500 5. Depr. of building 125 7. Utilities 150 8. Other 3,750 10,525 Materials 1. 25,000 2. 20,995 4,005 Building 1/1 Bal. 250,000
Accumulated Depr.—Building
5. 1,250
Machinery and Equipment
1/1 Bal. 75,000
Accumulated Depr.—Machinery and Equipment 6. 1,250 Accounts Payable 11. 25,000 1. 25,000 7. 1,500 8. 3,750 30,250 5,250 Work in Process 2. Direct materials 20,000 10. 38,220 4. Direct labor 10,000 9. Factory overhead 8,220 38,220 Capital Stock 1/1 Bal. 365,000 Sales 12. 45,864
Cost of Goods Sold
12. 30,576
Payroll
3. 20,000 4. 20,000
Wages Payable
After calculating the balance of each general ledger account, the equality of the debits and credits is proven by preparing a trial balance, as follows.
1 2 3 4 5 6 7 8 9 10 11 12 13 14 15 16 17 18 19 20 21 22 23 A B C D E F
Wicker Works Inc
Trial Balance January 31, 2008 Cash $28,000 Accounts Receivable 12,864 Finished Goods 7,644 Work in Process -0-Materials 4,005 Building 250,000 Accumulated Depreciation---Building $1,250
Machinery and Equipment 75,000
Accumulated Depreciation---Mach. and Eq. 1,250
Accounts Payable 5,250
Wages Payable
-0-Capital Stock 365,000
Sales 45,864
Cost of Goods Sold 30,576
Payroll
-0-Factory Overhead
-0-Selling and Administrative Expenses 10,525
Total $418,614 $418,614
Note that thefinished goods control account reflects the cost of the 100 units still on hand—100 × $76.44 = $7,644.
From an analysis of the general ledger accounts and the trial balance,financial statements for the period are prepared as follows:
1 2 3 4 5 6 7 8 9 10 11 12 13 14 15 16 17 18 19 20 21 22 A B C D E F G
Wicker Works Inc
Statement of Cost of Goods Manufactured For the Month Ended January 31, 2008 Direct Materials:
Inventory, January 1
Purchases 25,000
Total cost of available materials $25,000
Less inventory, January 31 4,005
Cost of materials used $20,995
Less indirect materials used 995
Cost of direct materials used in production $20,000
Direct labor 10,000
Factory overhead:
Indirect materials 995
Indirect labor 3,500
Depreciation of building 1,125
Depreciation of machinery and equipment 1,250
Utilities 1,350
Total factory overhead 8,220
Wicker Works Inc. Income Statement
For the Month Ended January 31, 2008
Net sales . . . $ 45,864 Cost of goods sold:
Finished goods inventory, January 1 . . . $ -0-Add cost of goods manufactured . . . 38,220 Goods available for sale . . . $ 38,220
Lessfinished goods inventory, January 31 . . . 7,644 30,576 Gross profit on sales . . . $ 15,288 Selling and administrative expenses . . . 10,525 Net income . . . $ 4,763
Wicker Works Inc. Balance Sheet January 31, 2008 Assets Current assets: Cash . . . $ 28,000 Accounts receivable . . . 12,864 Inventories: Finished goods . . . $ 7,644 Work in process . . . -0-Materials . . . 4,005 11,649 Total current assets . . . $ 52,513 Plant and equipment:
Building . . . $ 250,000
Less accumulated depreciation . . . 1,250 $ 248,750 Machinery and equipment . . . $ 75,000
Less accumulated depreciation . . . 1,250 73,750 Total plant and equipment . . . $ 322,500 Total assets . . . $ 375,013
Liabilities and Stockholders’Equity
Current liabilities:
Accounts payable . . . $ 5,250 Stockholders’equity:
Capital stock . . . $ 365,000 Retained earnings . . . 4,763
Total stockholders’equity . . . 369,763 Total liabilities and stockholders’equity . . . $ 375,013 The figures in the cost of goods manufactured statement were obtained by analyzing the appropriate general ledger accounts. The materials inventory account had no beginning balance but has an ending balance of $4,005. The amount of purchases during the period was determined by analyzing the debits to the materials account. The cost of direct materials used of $20,000 and the direct labor cost of $10,000 were obtained from the work in process account. All other items in the statement of cost of goods manufactured represent factory overhead and are determined from the factory overhead account in the general ledger. If there had been beginning or ending work in process, it would have appeared in the statement
of cost of goods manufactured. Note that the retained earnings on the balance sheet represent the amount of net income for the period, $4,763, because this was thefirst month of business operations.
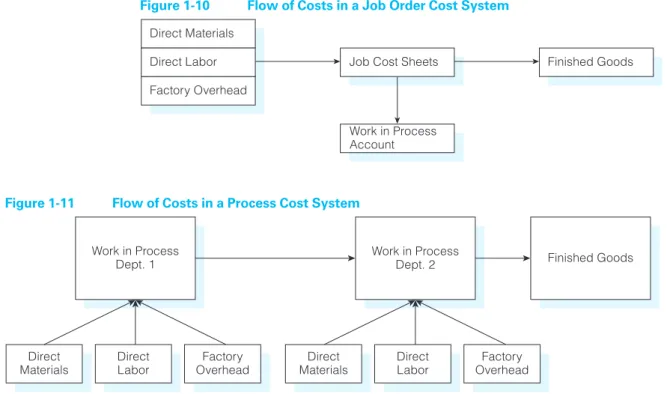
This discussion has presented a complete cycle in cost accounting procedures. Before proceeding, carefully review the basic elements of terminology and the flow of costs. A firm grasp of the fundamentals already covered is necessary to comprehend the more complex material in subsequent chapters. Figure 1-9 presents a graphic illustration of the flow of costs through the ledger accounts. You should study this illustration carefully, following each line to trace theflow of costs.
Figure 1-9 Flow of Costs through the Ledger Accounts
Materials Cost of materials purchased Cost of direct materials used Cost of indirect materials used Cost of direct materials Cost of direct labor Factory overhead Cost of goods finished Work in Process
Payroll Finished Goods
Factory Overhead Cost of Goods Sold Gross wages Cost of
direct labor Cost of indirect labor Cost of goods finished Cost of finished goods sold Cost of finished goods sold Transferred to Work in Process Cost of indirect materials Cost of indirect labor Other indirect factory expenses
Recall and Review 2
Classify each of the following items as direct materials, direct labor, factory overhead, or selling and administrative expenses:
Electricity used in heating a factory
Automobile expense for customer service representatives Wages of a bricklayer employed by a home builder Car batteries used by an automobile manufacturer Supplies used to clean the factoryfloor
Wages of a fork-lift operator in a plant that makes auto parts
You should now be able to work the following:
Questions 20–26; Exercises 1-4 to 1-8; Problems 1-3 to 1-7, and the
Self-Study Problem.
Cost Accounting Systems
The previous example presented the basic foundation of a cost accounting system. In that illustration, costs were accumulated for one month. At the end of the month, the costs were divided by the total units produced to determine the unit cost. This accomplished one function of cost accounting: the determination of product costs—both total costs for the period and cost per unit. However, another important objective of a cost accounting system—cost control—could not be satis-factorily achieved with this information alone. For example, assume that in a subsequent month the cost of direct labor had risen from $20 to $22 per unit. Labor costs went up, but did they go up because of a general rise in wages or because of inefficiency? Did labor costs increase throughout the manufacturing process or for a particular department or job? Answers to such questions would not be readily available using the procedures described in the earlier example.
To provide management with the data needed for effective cost control, two basic types of cost accounting systems have been developed: the process cost system and the job order cost system. Both systems are used to gather cost data and to allocate costs to goods manufactured. The selection of one method or the other depends on the type of manufacturing operation used by a given company. To determine the appropriate method, manufacturing operations are classified into two types: special order and continuous or mass production.
Special Order
In this type of operation, the output consists of special or custom-made products; in other words, each product is made to order. An order may be an external request from a customer or an internal order for a predetermined quantity of products to replenish inventory stock. Special-order industries include those manufacturing or producing locomotives, ships, aircraft, custom-built homes, machine tools, engines, structural steel, books and magazines, and directories and catalogs, and specialty shops producing custom-made products such as clothing, shoes, and hats. Ajob order cost system provides a separate record for the cost of each quantity of these special-order products as illustrated by the block for “Job Cost Sheets”in
LO6 Distinguish between the two basic types of cost accounting systems.
Figure 1-10. Job order cost accounting techniques also may be used byfirms that provide a service rather than a product such as accounting, architecture, and law. It is important for these firms to be able to track the various costs of serving different clients.
Continuous or Mass Production
This type of operation produces a continuous output of homogeneous products. Such an enterprise may produce a single product, such as an automobile, or many different products, such as soft drinks or pharmaceuticals. The factory generally is departmentally organized. Continuous or mass production industries include those manufacturing automobiles, tires, cement, chemicals, canned goods, lumber, paper, candy, foodstuffs,flour, glass, soap, toothpaste, chewing gum, petroleum products, textiles, plastics, and paints, andfirms engaged in such processes as rubber com-pounding and vulcanizing. A process cost system accumulates costs for each department or process in the factory as illustrated in Figure 1-11.
Process cost accounting is appropriate for manufacturing situations in which all units of thefinal product are substantially identical. Wicker Works utilized a pro-cess cost system in the preceding example to account for its only product, a single style of table. Finished units are placed in stock and removed as needed to fill customer orders. There are no separate jobs presenting substantially different char-acteristics. Rather, the company (or a department within the company) produces large numbers of virtually identical items that are sold (or transferred to other departments) as orders are received. Process cost accounting techniques also may be used by organizations that provide a service such as for determining the cost per X-ray in a hospital’s X-ray department or the cost per passenger-mile for an airline. Chapters 5 and 6 cover process cost accounting. Figure 1-12 shows examples of the
Figure 1-10 Flow of Costs in a Job Order Cost System
Direct Materials Direct Labor Factory Overhead
Job Cost Sheets
Work in Process Account
Finished Goods
Figure 1-11 Flow of Costs in a Process Cost System
Work in Process Dept. 1
Work in Process
Dept. 2 Finished Goods
Direct Materials Direct Labor Factory Overhead Direct Materials Direct Labor Factory Overhead
use of job order cost and process cost systems in service, merchandising, and manufacturing businesses.
Combination of Systems
Some companies use both a job order cost and a process cost system. For example, a company that manufactures equipment on specific order but also produces, on a continuous basis, a number of small motors that are component parts of many of the equipment orders may benefit from combining the systems. The costs of making these motors would be accumulated on a process cost basis, while the costs for each unique piece of equipment would be gathered using job order costing.
Standard Costing
The job order and process cost accounting systems are the principal systems used by manufacturing organizations. However, as useful as they are in providing cost data, these systems are still limited with regard to cost control. Although they make it possible to determine what a product actually costs, they provide no means to determine what the product should have cost. Astandard cost system,which is not a third system but may be used with either a job order or a process cost system, uses predetermined standard costs to furnish a measurement that helps manage-ment make decisions regarding the efficiency of operations.
Standard costs are costs that would be incurred under efficient operating conditions and are forecast before the manufacturing process begins. During operations, an organization compares the actual costs incurred with these predeter-mined standard costs.“Variances,”or differences, are then calculated. These vari-ances reveal which performvari-ances deviate from the standard, and thus they provide a basis on which management can take appropriate action to eliminate inefficient operating conditions. Standard cost accounting will be discussed in depth in Chapter 8.
Illustration of a Job Order Cost System
With a job order cost system, costs are accumulated by job (or lot). One advantage of a job order cost system is that the accumulation of costs for a particular job helps to determine its selling price. Or, if a job is done under contract with a set price, the profit or loss on the job can be readily determined by comparing the cost with the contract price. At the same time, costs that have been accumulated for a certain type of work will assist management in preparing bids for similar jobs in the future.
To illustrate the use of a job order cost accounting system, assume that Wicker Works Inc. is now manufacturing both tables and chairs and that it accepts two
Figure 1-12 Uses of Cost Systems
Cost System Service Business Merchandising Business Manufacturing Business
Job Order Accountingfirm, Management consultant
Lumber company, personal computer retailer
Custom home builder, printer
Process Hospital X-ray department, hotel housekeeping
Newspaper publishing, agricultural wholesaler
Soft drink bottler, Paper producer
LO7 Illustrate a job order cost system.
orders to manufacture certain items during the month of February. These special orders are as follows:
1. From Casual Customs: to manufacture 500 chairs to their specifications; con-tract price, $36,000. Job No. 101 is assigned to this order.
2. From Patio Providers: to manufacture 500 tables to their specifications; contract price, $59,300. Job No. 102 is assigned to this order.
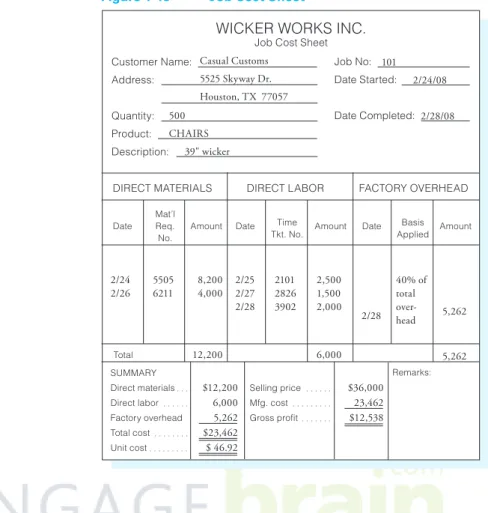
After accepting these orders and planning the manufacturing requirements as to materials, labor, and overhead, the cost accounting department sets up a job cost sheet for each job. Ajob cost sheet,also known as a job cost record in an auto-mated accounting system, records and accumulates all the costs assigned to a specific job. Figure 1-13 illustrates this form for the Casual Customs order. All costs applicable to each job will be accumulated on these forms. Note that Wicker Works has changed from process costing to job order costing now that it is making custom products for specific customers.
Transactions and journal entries for the month of February appear as follows. To highlight job order cost accounting procedures, only those entries relating to the manufacture of goods will be illustrated. Routine entries, such as those for recording the purchase of materials, nonmanufacturing expenses, or payments to creditors, will be ignored. Those entries are made in the same way as previously illustrated, regardless of the cost system used.
Figure 1-13 Job Cost Sheet
WICKER WORKS INC.
Job Cost Sheet Customer Name: Address: Quantity: Product: Description: Job No: Date Started: Date Completed:
DIRECT MATERIALS DIRECT LABOR FACTORY OVERHEAD
Mat’l Req. No.
Date Amount Date Time
Tkt. No. Amount Date
Remarks: Basis Applied Amount Total SUMMARY Direct materials Direct labor Factory overhead Total cost Unit cost Selling price Mfg. cost Gross profit Casual Customs 5525 Skyway Dr. Houston, TX 77057 500 CHAIRS 39" wicker 101 2/24/08 2/28/08 2/24 2/26 2/28 8,200 4,000 12,200 2,500 1,500 2,000 6,000 5,262 5,262 5505 6211 2101 2826 3902 2/25 2/27 2/28 40% of total over-head $12,200 6,000 5,262 $23,462 $ 46.92 $36,000 23,462 $12,538
1. Indirect materials with a cost of $5,250 are issued to the factory, and direct materials are issued as follows:
Job 101 Job 102
Rattan . . . $8,200 $16,000 Binding Cane . . . 4,000 2,000 $12,200 $18,000
The entry at the end of the month to record the issues of materials appears as: Work in Process (Job 101) . . . 12,200
Work in Process (Job 102) . . . 18,000 Factory Overhead (Indirect Materials) . . . 5,250
Materials . . . 35,450
Note that in the previous entry there is really only one general ledger work in process account and that the 101 and 102 designations merely indicate the individual job cost sheets that would appear in the subsidiary job cost ledger.
If the indirect materials could be directly traced to a specific job, the cost could be charged to that job. However, it is often difficult and not cost-effective to determine which job benefited from the use of various supplies such as glue, nails, and cleaning fluid. Thus, indirect materials costs are usually charged to Factory Overhead and later distributed among the various jobs in some equitable way.
2. Indirect labor costs of $4,360 and direct labor costs are incurred as follows: Job 101 Job 102
Direct Labor . . . $6,000 $7,500
The monthly entry to distribute these costs is recorded as follows: Work in Process (Job 101) . . . 6,000 Work in Process (Job 102) . . . 7,500 Factory Overhead (Indirect Labor) . . . 4,360
Payroll . . . 17,860
The explanation for why indirect labor costs are charged to Factory Overhead rather than to Work in Process is similar to the previous explanation for indirect materials.
3. Monthly depreciation expense for the building, allocated according to the square footage used by manufacturing (90%) and selling and administrative (10%), is recorded as follows:
Factory Overhead (Depr. of Building) . . . 1,125 Selling and Administrative Expenses (Depr. of Building) . . . 125
Accumulated Depr.—Building . . . 1,250 4. The entry to record monthly depreciation for machinery and equipment, all of
which is used for manufacturing operations, is recorded as follows:
Factory Overhead (Depr. of Machinery and Equipment) . . . 1,250 Accumulated Depr.—Machinery and Equipment . . . 1,250
5. The cost of utilities for the month of February is $1,300, again allocated by building square footage, is recorded as follows:
Factory Overhead (Utilities) . . . 1,170 Selling and Administrative Expenses (Utilities) . . . 130
Accounts Payable . . . 1,300
6. Total charges to Factory Overhead for the month are shown as follows: Indirect materials . . . $5,250 Indirect labor . . . 4,360 Depr. of building . . . 1,125 Depr. of machinery and equipment . . . 1,250 Utilities . . . 1,170 Total . . . $13,155
Assume that factory overhead is allocated as follows: 40% to Job 101, 60% to Job 102.
Total Factory 40% 60%
Overhead Job 101 Job 102
$13,155 $5,262 $7,893
The distribution of factory overhead would then be recorded as follows: Work in Process (Job 101) . . . 5,262 Work in Process (Job 102) . . . 7,893
Factory Overhead . . . 13,155
At the end of the month, the work in process and factory overhead accounts would appear as follows:
Work in Process (Job 101)
1. Direct materials 12,200 2. Direct labor 6,000 6. Factory overhead 5,262 23,462
Work in Process (Job 102)
1. Direct materials 18,000 2. Direct labor 7,500 6. Factory overhead 7,893 33,393
Factory Overhead
1. Indirect materials 5,250 6. Transfer to Work in Process 13,155 2. Indirect labor 4,360
3. Depr. of building 1,125 4. Depr. of mach. and equip. 1,250 5. Utilities 1,170 13,155
The costs shown in the work in process accounts represent monthly totals (summary entries) for each element of manufacturing cost. These same costs are shown in more detail on job cost sheets such as the one illustrated previously.
7. Assuming both jobs were completed by the end of the month, the costs of the completed jobs would be transferred to thefinished goods inventory control account:
Finished Goods . . . 56,855 Work in Process (Job 101) . . . 23,462 Work in Process (Job 102) . . . 33,393
8. When the goods are shipped and billed to the customers, the following entries are made to record the sale and the cost of the jobs:
Accounts Receivable . . . 95,300 Sales . . . 95,300 Cost of Goods Sold . . . 56,855
Finished Goods . . . 56,855
The costs of producing the two jobs can be summarized as follows:
Job 101 (500 Chairs) Job 102 (500 Tables)
Total Cost Unit Cost Total Cost Unit Cost
Direct materials . . . $12,200 $24.40 $18,000 $36.00 Direct labor . . . 6,000 12.00 7,500 15.00 Factory overhead . . . 5,262 10.52 7,893 15.79 Total . . . $23,462 $46.92 $33,393 $66.79
The gross profit realized on each job is determined as follows:
Job 101 (500 Chairs) Job 102 (500 Tables)
Total Per Unit Total Per Unit
Selling price . . . $36,000 $72.00 $59,300 $118.60 Cost . . . 23,462 46.92 33,393 66.79 Gross profit . . . $12,538 $25.08 $25,907 $51.81 The job cost sheets would reflect the previous information in more detail so that a short time after each job was completed, the gross profit could be determined. In addition, if management bids on similar jobs in the future, an accurate record of all costs would be available to assist management in determining contract prices.
Work in Process Control Account
A job cost ledger is a subsidiary ledger that has an account for each job. The details on the job cost sheets in the subsidiary job cost ledger support the balance of the work in process control account in the general ledger.
Work in Process in the Manufacturing Statement
If there is work in process at the beginning and at the end of the month, it will be shown in the statement of cost of goods manufactured. To illustrate, assume that Wicker Works Inc.’s statement for June is as follows: