Department of Business Studies
Alessandro Galletti & Dimitra Papadimitriou
Supervisor: Sabine Gebert-Persson
Spring 2013
How Big Data Analytics are perceived as a
driver for Competitive Advantage
Abstract
The recent explosion of digital data has led the business world to a new era towards a more evidence-based decision making. Companies nowadays collect, store and analyze huge amount of data and the terms such Big Data Analytics are used to define those practices. This paper investigates how Big Data Analytics (BDA) can be perceived and used as a driver for companies’ Competitive Advantage (CA). It thus contributes in the debate about the potential role of IT assets as a source of CA, through a Resource-Based View approach, by introducing a new phenomenon such as BDA in that traditional theoretical background. A conceptual model developed by Wade and Nevo (2010) is used as guidance, where the concept of synergy developed between IT assets and other organizational resources is seen as crucial in order to create such a CA. We focus our attention on the Food Retail industry and specifically investigate two case studies, ICA Sverige AB and Masoutis S.A. The evidence shows that, although this process is at an embryonic stage, the companies perceive the implementation of BDA as a key driver for the creation of CA. Efforts are put in place in order to develop successful implementation of BDA within the company as a strategic tool for several departments, however, some hurdles have been spotted which might impede that practice.
Keywords: Big Data, Big Data Analytics, Resource-Based View, Competitive Advantage, Retail Industry, ICA AB, Sweden
Definitions and Abbreviations
BDA= Big Data Analytics
CA= Competitive Advantage
IT=Information Technology
Organizational resources: “resources that include all assets, capabilities, organizational processes, firm attributes, information, knowledge, etc. controlled by a firm that enable the firm to conceive of
and implement strategies that improve its efficiency and effectiveness” (Barney, 1991, p.101)
Competitive Advantage: “a process in which the firm is implementing a value creating strategy not
simultaneously being implemented by any current or potential competitors” (Barney, 1991, p.102)
IT resources: technological resources such as tangible assets (in the form of IT hardware and
software), or intangible assets such as technical and managerial IT knowledge (Melville et al.
2004)
IT tangible assets: widely available, off-the shelf or commodity-like information technologies that
are used to process, store, and disseminate information (Wade & Hulland 2004)
IT-enabled resources: relations between IT assets and organizational resources (Wade & Nevo, 2010)
Emergent capabilities: capabilities that neither component can possess by itself (Wade & Nevo, 2010)
Synergies: positive emergent capabilities, or emergent capabilities that result in positive outcomes
Table of Contents
1. Introduction ... 1 1.1. Background information ... 1 1.2. Problem Discussion ... 3 1.3. Research question ... 4 1.4. Thesis Disposition ... 4 2. Literature Review ... 52.1. Contribution of IT to Competitive Advantage ... 5
2.1.1. Resource Based view ... 5
2.1.2. Information Technology resources and competitive advantage ... 7
2.1.3. Conceptual model ... 8
2.2. Big Data Analytics and Competitive Advantage ... 11
2.2.1. Big Data Analytics as an IT asset ... 11
2.2.2. Big Data as a Driver for Competitive Advantage ... 12
3. Method ... 12
3.1. Research type ... 12
3.2. Selection of cases ... 13
3.3. Data Collection and Analysis ... 13
3.4. Reliability and Validity of research ... 18
4. Case studies ... 19
4.1. ICA Case Study ... 19
4.1.1. ICA case is a Big Data Analytics case ... 19
4.1.2. Big Data Analytics’ implementation within ICA ... 20
4.1.3. Big Data Analytics as a driver for competitive advantage in ICA ... 26
4.2. Masoutis Case Study ... 29
4.2.1. BDA implementation within Masoutis ... 30
4.2.2. BDA as a driver for CA in Masoutis... 31
5. Analysis ... 33
5.1. Potential Synergy and Enablers of Actual Synergy ... 33
5.2. The strategic potential of IT-enabled resources ... 35
5.3. IT Enabled Resources and Competitive Advantage ... 37
5.4. Discussion ... 38
6. Conclusions and beyond ... 40
6.2. Contribution ... 41
6.3. Limitations of Study Results and Suggestions for Further Research ... 41
7. References ... 44
1.1.Background information
We live in an era in which data are constantly proliferated and become more easily accessible. The rise of the Internet has led to a highly interconnected world, which generates an exponential amount of data that can take many forms, from meteorological calculations and health records, to social media networks and online services. Within the business field, with millions of transactions being made online and the rise of the smart-phone applications, data is everywhere, leading to an increase of a data-driven decision making in business (Harris et al., 2010). Retailers, health care providers, insurers, financial institutions and other organizations collect large amounts of data on every transaction.
The retail industry in specific shows an increasing interest in the use of data, because of the high volume and quality, stemming from Internet purchases and social-network conversations (Brown et al., 2011). Retailers use customer data to get insight into customers' needs, by using integrated customer, shopping and behavioral data and in that way they have visibility into user demographics, buying behaviors and mobile application downloads (Savitz, 2012). They are also exploiting big volumes of customer data in order to better target customers and gain loyalty, in order to personalize campaigns, coupons and offers to individual customers. Some of them use techniques to mine the huge streams of data now generated by consumers using various types of social media, measure responses to new marketing campaigns in time much quicker than the one of traditional feedback (Rogers, 2011). As a result, with the use of data, retailers can communicate directly with their customers, sell smarter and increase margins (Savitz, 2012).
Since the amount of data generated is changing, new technologies are emerging that can analyze data on a faster pace (McAfee & Brynjolfsson, 2012). That systematic analysis of data and statistics in business contexts in order to obtain useful information is called analytics (Cooper, 2012). The latest trend of Information Technology (IT) in the field of data analytics has been named as Big Data Analytics (BDA) and meets a big interest in business circles. BDA describe how companies examine large amounts of data of a variety of types in order to obtain useful information (McAfee & Brynjolfsson, 2012).
Seeing BDA in relation to traditional Analytics, one might ask how the former differ. BDA has been differently defined, something that shows the existing uncertainty towards that new concept,
2 which is also in stage of experimentation as far as its use is concerned. Nowadays, Big Data and BDA are viral terms that are used to define the data sets and analytical techniques in applications that are so large and complex, that they require advanced and unique data storage, management and analysis technologies (Hsinchum et al., 2012). The size of Big Data is a major differentiator from traditional data, but “big” is not just a matter of size; it might include volume, velocity or variety (Gobble, 2013). Volume is the increasing amount of business data—created by both humans and machines. Variety is also about the increasing number of data types and sources that need to be handled differently from simple email, data logs and credit card records (Preimesberger, 2011). To be more specific, the variety of Data includes both structured and unstructured data. Unstructured data lack a predefined structure and normally stem from social networks, web pages and other similar communication channels. Finally, velocity is about the speed at which this data moves from end- points into processing and storage (Preimesberger, 2011).
The use of BDA is becoming a trend and several businesses are now investing in BDA, in an initial level. A survey conducted to Fortune’s 500 biggest corporations in the United States, revealed that about 85% of respondents already had BDA initiatives planned or in progress (Kiron, 2013). The potential of BDA is foreseen as tremendous, since it can make information transparent in a higher frequency, and the collection of data and analysis can lead to better decision making, forecasting of needs and further adjustment of business. It is observed that by a consistent analysis of Big Data, firms will transform into ‘intelligent enterprises’ that will enhance their productivity and competitiveness in the market, by optimizing their operations on precise information coming from various sources combined (Caesarius & Lindvall, 2012). The BDA phenomenon is forecasted to expand even more (Parise et al., 2012), and it is also expected to further create new growth opportunities and new categories of companies (McGuire et al., 2012), by highlighting the path we are towards a more evidence-based decision making.
Although the term of BDA has been variously defined -mostly concerning the factors that differentiate them from traditional analytics-, little attention has been drawn in relation to how BDA can affect organizations’ performance, which may also be due to the recent character of the phenomenon. The benefits derived from the use of BDA have been forecasted (Savitz, 2012; McGuire et al., 2012; Brown et al., 2011), but it remains rather unexplored how this new example of IT can influence firms’ competitiveness and may lead to a Competitive Advantage (CA). This study will explore how BDA are perceived to affect a firm’s CA.
3 1.2.Problem Discussion
In theory, there has been a long debate on what the effect of IT in organization’s performance is and in what way IT contributes to firms’ competitiveness, but the answer remains rather unclear (Mata et al., 1995; Mellville et al., 2004; Kohli & Grover, 2008; Wade & Nevo, 2010). Although there is a recognition of the importance of IT to firms’ competitiveness, academics do not seem to agree on which the relationship between IT and business performance is, and specifically to how IT can be a driver of CA to organizations (Wade & Nevo, 2010). In specific, on the one hand, it was argued, that IT technologies are unlikely to be leading to a CA of a firm, since they are widely available to all the competition of a market (Mata et al., 1995). However, on the other hand, it was also observed that those technologies have been shown to provide capabilities which, when combined with other factors available in a firm-such as the human capital and business knowledge-, can provide a basis for realization of a CA (Kros et al., 2011; Wade & Hulland, 2004; Wade & Nevo, 2010). As Carr (2003) states, because IT has become a commodity in recent years, it is not important which technologies companies are adopting, but how they are using them. This confirms our approach to focus on how BDA are used and perceived to make an organization more competitive, because that perception influences the way in which an organization uses BDA and vice versa.
Given that BDA is a very recent example of IT, the existing debate becomes even more acute when it comes to such a powerful tool: BDA can provide a firm with an amount of data that could not even be conceived a few years ago (McGuire et al., 2012). Firms have now access to the most capable information tools so far, but the path between those technologies and CA for firms is rather unexplored. The purpose of this study is to explore how BDA are used and perceived to affect a company’s CA. By using the theory developed so far about IT as guidance, we will explore a very recent IT example, the one of BDA. The study will be focused on the retail industry, because it is an area of great interest due to the high volume of data being used for analysis (Ggreengard, 2012), since, as mentioned above, retailers use BDA to analyze various sources from customers’ data in order to get insight to buying behaviors, personalize offers and increase margins (Savitz, 2012). Knowledge on how BDA are perceived to lead to CA will contribute to richer insights into the persisting theoretical problem concerning how IT can lead to firms’ CA. Since the contribution of IT to business performance is yet unclear (Kohli & Grover 2008), empirical evidence on how organizations perceive this new and powerful IT example, will also contribute to the existing debate. The research also contributes to information management by increasing the theoretical and practical understanding of how BDA can affect firms’ competitiveness and it helps to understand
4 the role of such an IT application within a company. Practical implications, useful for organizations engaging on BDA are the provision of an overview about that recent phenomenon, and helping organizations on what to expect concerning use of BDA and how this will affect their competitiveness. This study will help those companies interested in BDA, to better understand how those can increase their competitiveness either before investing to such a technology, or also after, in understanding how it should be better used in order to lead to a competitive advantage.
1.3.Research question
The previous discussion leads to the main question of the present research which is the following:
“How are Big Data Analytics used and perceived by an organization to affect its competitive advantage in retail industry?”
In order to answer that question, we will first provide an overview of the existing literature debate on IT and how it has been seen in research as a driver for a CA and will then link the theory to the emerging IT example of BDA and see how BDA are used in retail and perceived to affect the competitiveness of a firm in our given case. In order to do so, we are going to test a conceptual model developed by Wade and Nevo (2010) through a case study in the retail industry. Wade and Nevo (2011) tested already their model through a quantitative study on customer services and found out that when an IT asset is combined with other organizational resources, the developed synergy may provide a CA for the company. However, we believe, supported by Saunders (2009), that in order to understand in depth this new phenomenon and the concepts expressed in the conceptual model, a questionnaire with closed questions is not reliable enough, even if statistically valid. Thus, we chose a different approach, which is to test Wade & Nevo’s model (2010) with a qualitative study, with open questions and a focus on a specific industry, to see if it applies concerning the use of BDA in retail and firms’ competitiveness.
1.4.Thesis Disposition
The thesis is structured as follows: the present section introduces the research study. It contains information in order to provide a background to the research area and formulated the research question. Section 2 continues with a discussion of literature. It presents the existing literature debate on how IT can lead to a CA, to conclude by linking that literature to the emerging IT example of BDA. Then, section 3 presents the type of research, the selected strategy behind and the selection of cases. It also explains the data collection strategies and their analysis, to conclude with the
5 limitations and validity of the present study. Section 4 provides the data collected, and section 5 analyses the information gathered from a theoretical perspective, in order to give an answer to the research question, and draw relevant discussions. Finally, section 6 constitutes the concluding section of the present thesis; concluding remarks are presented, along with limitations of study and suggestions for further research.
2.
Literature Review
2.1.Contribution of IT to Competitive Advantage
IT has become an integral part of modern organizations and it has changed many business processes. However, researchers and practitioners have struggled to pinpoint its contribution to business performance (Kohli & Grover 2008). The increasing attention in literature on IT and how it can affect firms’ competitiveness is due to the big investments made in IT and the subsequent need that comes with knowing how those investments can bring value to organizations. The value of IT in research is underpinned by a Resource-Based View (RBV), which is applied to understand the relationship between IT and organizational performance. The RBV provides a strategic framework to assess the competitiveness of organizational resources and how they can lead to a CA (Barney, 1991; Penrose, 1959; Wernerfelt, 1984). However, despite a significant amount of research during the past two decades, the results on IT’s business value are rather mixed and there is an ongoing debate about whether IT improves firm performance and in what way (Kohli & Grover, 2008; Wiengarten et al., 2013). Hence, the role, if any, that IT plays in supporting firm strategies, remains unclear (Piccoli & Ives, 2005).
2.1.1. Resource Based view
The Resource Based View of the firm was developed firstly by Penrose (1959) who stated that the uniqueness of a firm is established on the unique combination of its resources. Since then, several scholars debated the role and the functions of resources within organizations. Wernerfelt (1984) had yet started to link the use of resources to the performance of the firm. Indeed, he affirmed that firm’s performance is determined by the resources it owns. Moreover, Penrose (1959), first, and Tsoukas (1996), later, stressed that resources cannot be seen as something predefined, but, instead, they provide different services to the company based on the way companies use them.
6 Organizational resources are defined as “resources that include all assets, capabilities,
organizational processes, firm attributes, information, knowledge, etc. controlled by a firm that enable the firm to conceive of and implement strategies that improve its efficiency and
effectiveness” (Barney, 1991, p.101).
Therefore, resources are factors that can either be tangible or intangible (Helfat & Peteraf, 2003), with physical (tangible) ones being for instance a plant or equipment, and intangible ones being customer relationship, know-how, or brand-name recognition. Those resources may allow a firm to achieve a CA. Barney (1991) defines CA as “a process in which the firm is implementing a value
creating strategy not simultaneously being implemented by any current or potential competitors”
(p.102). This definition, given by Barney (1991), points out that in order to lead to CA the company must own resources with four characteristics/attributes, (Barney, 1991): they have to be valuable, rare, imperfectly imitable and non-strategically substitutable.
Valuable means that the resource must enable the company to develop a value-creating strategy,
improving its efficiency and effectiveness. In other words, the resource must be used in a way that leads to a costs reduction or to the development of new products/services. Rare means that not all the companies can own this resource; by definition, indeed, a firm is implementing a value-creating strategy, and so a CA, if and only if this strategy is based on resources that competitors cannot possess. Imperfectly imitable means that competitors cannot copy or imitate the resource; it might be hard for the competitors to understand the link between the resource and the CA and consequently, hard to act in order to imitate firm’s strategy. Lastly, not strategically substitutable
means that two different resources that can be exploited separately in order to implement the same strategy do not exist (Barney, 1991).
RBV theory indicates that the resources that meet those criteria could lead to sustained CA. Then the concept of complementarity of resources described by Milgrom and Roberts (1995) explained how different resources can complement each other and enhance business value. Accordingly, it was stated that the value of the organizational resources can increase in the presence of complementary resources because it is more difficult for those to be copied by competitors (Bharadwaj et al., 2007). Regarding IT, Clemons and Row (1991) used complementarity in order to explain how technology can be considered as a source of value when leveraged with some other resources. Moreover, Kettinger et al. (1994) overcame the issue of the paradoxical nature of technology in its contribution to business value because they stated that the combination between IT
7 and complementary resources like structure, culture, etc. make difficult for competitors to duplicate it.
2.1.2. Information Technology resources and competitive advantage
As we saw above, the strategic potential of the resources in the RBV depends on the existence of the four properties of value, rarity, inimitability and non-substitutability. Following the logic of RBV, IT resources are defined as technological resources such as tangible assets (in the form of IT hardware and software), or intangible assets such as technical and managerial IT knowledge
(Melville et al., 2004). IT tangible assets differ from intangible ones because of their physical nature and from the fact that they can be bought from vendors. Their definition can be summarized as following: IT tangible assets are widely available, off-the shelf or commodity-like information
technologies that are used to process, store, and disseminate information (Wade & Hulland, 2004).
By linking those IT resources with the strategic potential they can provide, IT assets, being seen as tangible commodities that everyone can have access on, have never been seen as able to affect CA because they do not embody the four properties (Mata et al., 1995; Wade & Hulland, 2004), whereas intangible ones may possess these properties (e.g., IT management skills are firm specific and cannot easily be traded or transferred; Mata et al., 1995). Subsequently, it has been observed, that IT intangible resources—and not tangible ones— have been so far at the center of IT-based RBV research (Wade & Nevo, 2010), and empirical evidence shows that many IT intangible resources can provide organizational performance gains (e.g., Bharadwaj, 2000; Tanriverdi, 2006). In specific, it has been argued that since IT has become commonplace, standardized, and available to all competitors, its potential as a source of differentiation has diminished (Clemons & Row, 1991; Champy, 2003). This statement was also developed by Mata et al. (1995), who had stated that technology assets such as networks and databases are unlikely to be leading to a CA, since they could be easily procured in factor markets, so if a firm owns a resource that is possessed by numerous other competing firms, that resource cannot be a source of CA (Mata et al., 1995).
However, combining hardware and software assets to create a flexible IT infrastructure can be inimitable, because creating such an infrastructure requires carefully melding technology components to fit firm needs and priorities (Ross et al., 1996). In addition to a sophisticated IT infrastructure, skilled human resources, relationships between the IT department and user departments, and managerial knowledge are valuable resources that are positioned to be of strategic value (Mata et al., 1995). As Barney (1991) specified, many competitors can possess the same physical technology but only one of them might own the social resources that are needed in order to
8 exploit IT assets and implement a valuable strategy in the same way. For example, Barley (1986) conducted a study in which he compared two different radiology departments that were using the same scanners, discovering that, due to different “social” resources, the two departments not only had a different level of efficiency, but also had two different organizational structures.
Therefore, although tangible IT assets usually do not directly induce CA, these technologies have been shown to provide capabilities that may lead to enhanced performance of a firm (Kros et al., 2011; Wade & Hulland, 2004). This is based on the argument that the effects of IT innovation adoption occur at the functional/operational level via enhancing various aspects of efficiency and effectiveness (Grant, 1991). As it is argued, the ability to leverage these assets can be indeed a strategic differentiator (Bhatt & Grover, 2005). When those IT assets are combined with additional organizational resources, the adoption of off-the-shelf technologies may provide the basis for a firm to realize CA (Mata et al., 1995; Wade & Nevo, 2010; Hazen & Bird, 2012). Indeed, Wade and Nevo (2010) developed a conceptual model that describes how IT assets can lead to the creation of CA by employing the concepts of synergies and strategic potential. They also tried to find empirical consequences of the model developed by testing it through survey data on IT-enabled customer service departments (Wade & Nevo, 2011).
2.1.3. Conceptual model
Wade & Nevo (2010) argue that the research made so far, underestimates the fact that IT assets cannot be considered in isolation, by saying that the fact that IT assets are widely available and that they are regarded as commodity products does not tell the full story of their business value. Instead, they argue that IT assets derive their business value from the impact they make on the organizational resources with which they interact. They name those relations between IT assets and organizational resources, as IT-enabled resources. The interactions between those two components, (IT assets and organizational resources), develop emergent capabilities—that are, capabilities that neither component can possess by itself (Wade & Nevo, 2010). This concept helps in understanding that an IT-enabled resource cannot be considered only as the sum of its components and so, it cannot be explained just with the aggregation of the capabilities of its constituent components. Instead, it can only be explained in its totality (i.e., by considering the relationships among its components).
In order to be beneficial Wade and Nevo (2010, p.168) believe that an emergent capability must show “the potential to help an IT-enabled resource achieve organizational tasks or goals”. If this is
9 the case we expect that the relation between the components will be synergistic. Thus, synergies are defined as positive emergent capabilities, or as emergent capabilities that result in positive outcomes. For instance increased efficiency and enablement of new processes are examples of synergistic outcomes that can be associated with IT-enabled resources. However, even if they are not able to define the concept of synergy more concretely, when they tested it, Wade and Nevo (2011) used a quantitative approach instead of a qualitative one. This leads to a possible decrease in the reliability of their results because it is not feasible to test abstract definitions with statistic elements (Saunders, 2009).
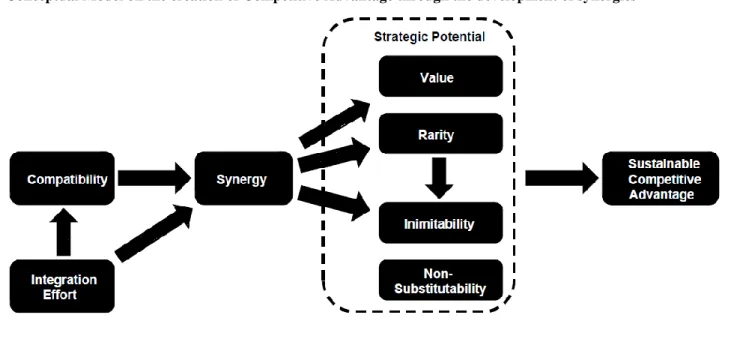
Organizations have a tendency to anticipate in advance how IT-enabled resources will help the organization achieve its goals. They therefore anticipate some potential synergistic relationships between IT assets and other resources and they invest in an IT asset if it appears to functionally complement an organizational resource (Wade & Nevo, 2010). In order for a potential synergy to become realized, two enabler conditions must be present: compatibility and integration (see Figure 1).
Compatibility has been defined as “the ability of an organizational resource to apply an IT asset in
its regular activities and routines” (Wade & Nevo, 2010, p.170) and IT asset-organizational
resource integration effort as “activities taken by the organization’s management to support, guide,
and assist the implementation of the IT asset within the organizational resource” in a manner that is congruent with the organization’s goals (Wade & Nevo, 2010, p.173). If those two enabling factors of compatibility and integration apply, then we have an actual synergy.
After the concept of realized synergy, Wade and Nevo (2010) extended a causal chain from this synergy to strategic potential and finally to CA, based on the RBV as explained above. The creation of synergy is supposed to positively affect the strategic potential of IT-enabled resources that acquire value, rarity and inimitability and in this way create CA (see Figure 1). The relation of synergy with each of those four strategic properties was explained as following:
a) Value Property
It is suggested that synergistic IT-enabled resources are likely to be considered valuable, because synergies may allow an organization to use an IT-enabled resource to capitalize strategic opportunities or diverge from potential threats (Wade & Nevo, 2010). For example, if a customer service department uses an IT asset -like for instance a client management system, to store and
10 access information about clients and their desires- then it may be possible to custom-fit a new product or service to a group of customers with a certain profile (Wade & Nevo, 2010). Also, if a CRM department uses an IT asset that analyses data and reveals intentions of a customer to switch to a competitor, it can foresee this threat and try to keep the customer within the company. By those means, the IT-enabled resources which were created from the synergies between those departments with the IT-assets are considered to bring value to the organization.
b) Rarity
It is also suggested that a synergistic relation between IT asset and organizational resources might produce a rare IT-enabled resource. Indeed, even if the IT asset is not rare in the market and several companies can buy it, this does not mean that all of those companies can develop certain IT-enabled resources, which makes them rare to obtain (Wade & Nevo, 2010). For example, a study conducted by Clemons and Row (1988), presents the case of two companies, McKesson and Bergen, that, even if they were using the same IT assets, achieve different performances thank to the synergistic relation that only one was able to develop. In particular, only the sales department of McKesson developed a new, more lucrative, consulting service, an example that highlights the rarity of the IT-enabled resources. Therefore synergistic relations can also be considered as rare.
c) Inimitability
Moreover, Wade and Nevo (2010) affirm that a synergistic relation between an IT asset and an organizational resource might result in an inimitable IT-enabled resource. Indeed, even though an IT asset can be widely available with a commodity-like nature (Mata et al., 2005), it might develop complex systems with other organizational resources that will be hard to imitate for competitors. In fact, competitors may possess both IT-asset and the organizational resource, but, due to complexity, they might not be able to understand the nature of the relation between them and thus, to develop the same relation in order to achieve the same performance.
d) Non-substitutability
An organizational resource is considered substitutable if other resources can be used to implement the same strategy (Barney, 1991). Wade and Nevo (2010) did not find a link between synergy and non-substitutability. Different organizational resources or combinations of resources could conceivably be used to achieve the same organizational outcomes as the IT-enabled resource; therefore this fourth attribute of non-substitutability does not apply in the case of synergistic relations between IT and other resources.
11 Those attributes of value, rarity and inimitability are important for the creation of CA for companies because they confer strategic potential to firms’ organizational resources. Therefore, those companies who own those kinds of strategic resources can implement strategies that are unavailable to their competitors. Further, the CA is sustained when the strategies cannot be duplicated by the firms’ current and future competitors (Barney, 1991). Strategies are based on collections of organizational resources and, as such, their ability to confer a CA and sustain it depends upon the strategic potential of those resources. Therefore, the ability of an IT-enabled resource to generate sustained competitive advantage and affect performance is contingent upon the above properties.
Conceptual Model on the creation of Competitive Advantage through the development of synergies
Figure 1 - Source: Wade and Nevo (2010), p.171
2.2.Big Data Analytics and Competitive Advantage
By following the model mentioned above of Wade and Nevo (2010) of how IT assets may contribute to firms’ CA as our guidance, we link the concept of IT assets to BDA.
2.2.1. Big Data Analytics as an IT asset
BDA require new tools for analysis and we have witnessed a sharp rise in dedicated appliances for high performance analytics: databases for fast query results and open-source tools for high-speed analytics against various types of BDA sources. Those are information assets, which companies buy from vendors, like databases and software. They are, in other words, off-the shelf or
commodity-12 like information technologies that are used to process, store, and disseminate information (Wade & Hulland, 2004) and therefore meet the definition of an IT asset adopted on the present paper. In addition, as stated by Wade and Nevo (2010), even some IT assets that are customizable, and, as such, may not be regarded as completely undifferentiated, they are still considered commodities since they are not protected by isolating mechanisms. Therefore, even if companies can sometimes acquire BDA assets and customize them, they can still be considered as IT assets.
2.2.2. Big Data as a Driver for Competitive Advantage
By following the model presented by Wade and Nevo (2010) as guidance and by considering BDA as an IT asset we are going to investigate how BDA are perceived by an organization’s management as a potential source of CA. To be specific, our investigation will focus on the synergies that might arise between BDA and other organizational resources. Concerning what other organizational resources can relate with the BDA, those can be for example the IT department and other departments, such as Marketing Department, Customer Relationship Management Department (CRM), Sales Department, Logistics Department etc. Other resources can be the companies’ human capital, people’s skills and knowledge, IT-Business Partnership etc. We will use concepts derived from the adopted model; we will investigate whether the two enable conditions of compatibility and integration exist in the system created by the relation between BDA and other organizational resources and whether synergies are expected to be realized. Those synergies, being the positive relationship between BDA and other resources, can enable their strategic potential.
3.
Method
3.1.Research type
The present study will test if the model proposed by Wade and Nevo (2010) applies in the industry of food retailers in the case of BDA. Wade and Nevo already published in the 2011 a research where they tried to test their model empirically. However, they did that in a different industry, customer services, so we believe that there is still room for a better understanding of their model in such a different environment. The strategy employed is the one of two case studies because we want to get a rich understanding of the relative processes enacted and a case study could potentially provide us with the answer of how something happens, and in that case, how BDA are perceived to contribute to firms’ CA (Saunders et al., 2009, p.140). We select two cases and investigate them in depth, in order to find answers to our research question. The research involves two cases to be studied, because application of BDA is a relatively new phenomenon, which might also have a
13 subjective and unclear definition: in a study conducted by The Data Warehousing Institute (TDWI) in 2011 most participants were familiar with something resembling BDA, but only 18% used the term “Big Data Analytics” for this (Russom, 2011). This problem along with the novelty of the whole phenomenon itself has made the application of BDA less easy to identify.
3.2.Selection of cases
The case studies we chose refer to the big food retailers in Sweden and Greece, ICA AB (Euromonitor International Passport, 2012) in Sweden and Masoutis S.A in Greece respectively. By big we refer to their market share in the industry. The option of those countries was made of two reasons: first, they are known to be countries which are on the front of innovation and adopt quickly new technologies (Florida et al., 2011). Second, it was easier for us to conduct the research in those countries due to geographical proximity reasons. The reason why cases from the retail industry were chosen to be studied is because retail industry is one of the industries that in research has been emphasized as engaging the most with investing to BDA and it is also one area that witnesses the most beneficial impacts of BDA (Brown et al., 2011). There is an emphasis on qualitative study and analysis because it is considered helpful to explain a phenomenon and the way it is perceived to affect an organization. Thus, ICA AB and Masoutis S.A fit the profile of study, they were selected due to their relevance to the theoretical issue being researched and were used as an example for theory (Denscombe, 2003), as both have acknowledged to be using BDA systems.
3.3.Data Collection and Analysis
Data were collected through personal interviews with responsible managers at ICA Headquarters in Stockholm and Masoutis Headquarters in Thessaloniki, especially with interviewees coming from IT and Marketing Departments. Moreover, additional data contributing to our analysis were five phone interviews, annual reports, retail industry reports, specialized journals and newspapers.
In specific:
Concerning ICA, two personal interviews were conducted with responsible managers, one from BI/IT department and one from the CRM department (part of Marketing department). The first interview was conducted with Olof Granberg, who is software architecture manager in Business Intelligence and IT Services department and his responsibility is to find technical solutions that match business needs. The second interview was conducted with David Holmstrand, chief CRM manager, who is in charge of several of the areas where customer data is refined to valuable knowledge and, in turn, to actions. Among his responsibilities are personal offers (1-to-1) and
14 providing customer insights internally and externally (e.g. with suppliers). In addition, four phone interviews with managers of ICA stores in Uppsala were conducted (ICA Supermarket Alvikstorg, ICA Supermarket Samköpt, ICA Supermarket Torgkassen and ICA Nära Folkes Livs), in order to get their perspective on the topic and see if they have access to BDA practices.
Concerning Masoutis, one interview was conducted with the Marketing Director of the company, Apostolos Filaktos, who is responsible to supervise all marketing activities of the company, including Data Analysis for marketing purposes and a phone interview was conducted with Katerina Papadopoulou, employee within the Data Analysis department.
The choice of these departments was based on their involvement in the BDA process. Since we wanted to investigate the perception of the companies relating to BDA, we wanted to retrieve two aspects that can lead to a better perception: an IT perspective and a business perspective. A perception of a retail company on BDA is efficiently represented by the perception of the IT department and the CRM/ Marketing department for the following reasons: the IT department is the one mostly responsible on BDA and it also gets to work with different other departments of the company, and the CRM/Marketing department is the department which employs the most the results coming from BDA. Furthermore, since the use of BDA is still on an embryonic level, it is not deeply rooted in the organizational processes, only a few people are involved with BDA and therefore the role of management at this stage is crucial. The people interviewed could provide us with an understanding of how their departments work with BDA as a whole, because of their position regarding BDA projects. For those reasons we chose to conduct the aforementioned interviews.
The interviews were organized in a semi-structured and informal way, in order to gain more flexibility during the discussion and point out areas of specific interest more extensively (Saunders et al., 2009). The flexibility was needed to explore the complexity and dynamics of the topic. Moreover, since the study takes on a relatively new topic, semi-structured interviews are advantageous because they allow the interviewees to explain their response and lead the discussion into areas not thought of before (Saunders et al., 2009). The interviews lasted approximately one and a half hour each and they were conducted in English with ICA, because the authors are not fluent in Swedish, and in Greek with Masoutis, because one author is a native Greek speaker. There were no barriers of communication since all the ICA interviewees were fluent in English and the Masoutis ones were Greek native Speakers.
15 The interviews were mainly comprised by two parts: a first part which aimed to a general orientation, and a second one with a more intense focus on BDA as an organizational asset and how it is perceived to affect the organization’s competitiveness. The semi-structured questions of both parts were the same in all interviews (see Appendix I), they were used as guidelines, but there were further explanatory questions in each case, to avoid misinterpretations. The first part included mainly general questions about what BDA are, how they employ the result of their analysis and why they started using them. It was also asked which tools are used for BDA, which data they select and why, and whether they are satisfied with their BDA operations so far (see Appendix I). In addition, the description of a specific BDA project was requested, in order to gain a deeper understanding of how they work with them. The second part was more specifically focused on testing the model as described in section 2. Indeed, we asked questions related to the actual management and analysis of Big Data and if and how they perceive them to affect firm’s performance. We asked how BDA are implemented and what the management’s involvement is, in order to understand if the enabler conditions (compatibility and integration) were effectively present. It was also asked whether BDA can be seen as an independent source for CA, which the relationships between BDA as an IT asset and other organizational resources are and how BDA are perceived to make the firm more competitive (Table I and Appendix I).
The following table (Table 1) presents the questions asked, their purpose, and for the ones stemming from the model it shows which constructs we intended to capture:
QUESTION PURPOSE
Part 1 - Orientation interview
Can you tell us in a few words what position you own within your organization and what you are responsible for?
Understanding of the position and responsibilities of the interviewed
How would you define Big Data? Understanding if the definition we used was coincident with the one used within the company
Is your company analyzing Data referred as Big Data already in a functional way?
Understanding at which level of development the company was in the use of BDA
a. What systems are you using in order to analyze Big Data? b. What are the sources where you gather Data from? Do you use
Understanding if the company was using structured or also
16
Social Media as a source?
c. Which data do you select and what for?
unstructured data
a. In which areas do you employ the results from the Analysis of
Big Data?
b. Do you have any specific questions behind that you are
looking to answer?
c. Before adopting Big Data Analytics, did you predict where it could contribute best?
Understanding the general idea that is behind BDA projects in the company
a. Can you describe us any ongoing Big Data Projects? b. Who was the one that decided the implementation of Big Data projects?
c. Are the people working in those projects coming from the IT department or elsewhere?
Understanding in depth the characteristics of a BDA project
What is the main reason why the company started employing Big Data Analytics? What did they expect to find?
Understanding of the strategy behind BDA
Are you satisfied so far with the results you get of Big Data Analytics? Do you face any problems in their implementation?
General idea about results and potential problems
Part 2 - Core interview
Do you know if your competitors are also engaging in the analysis of Big Data?
Understanding the company awareness of the competitive field
Can people from your department employ Big Data systematically, in their regular activities and routines? Can you have daily interactions with Big Data Analytics if needed? Can you give us an example of how these interactions happen practically?
Capturing the presence of the first enabler condition: compatibility
a. Were there any activities taken by the organization’s management to support, guide, or assist the implementation of Big Data within ICA? What kind of activities? b. Do you think that uses of Big Data and other organizational resources share the same goals? Are they the same with the goals of the company?
Capturing the presence of the second enabler condition: integration effort
a. Is the adoption of a Big Data Analytics system by itself capable of producing a competitive advantage that will last over time? (By this term we mean just the Big Data software and tools as bought from the IT vendors)
b. (if not), what other organizational resources are needed to be combined with Big Data Analytics in order to give this advantage against competitors?
Capturing the presence of synergy
Does Big Data Analytics together with its interactions with your department provide value to your company? Is there a situation in which Big Data allow you to capitalize strategic opportunities?
Capturing the presence of the first factor of the strategic potential: value
17 Do you consider your department able to develop new
products/services that are not present in the competitors’ offer thanks to the collaboration with BI department and the use of Big Data?
Can you give us an example?
Capturing the presence of the second factor of the strategic potential: rarity
Do you think that those innovative products/service you developed can be imitated by your competitors in an easy and quick way or not? Could you give us an example?
Capturing the presence of the third factor of the strategic potential: inimitability
a. Do you see Big Data Analytics as a way to enhance the firm’s competitiveness?
b. Do you see Big Data Analytics as a way for the company to gain an advantage against its competitors?
Capturing if the company experienced the last step of the model: creating CA
Would performance of your department be affected, had we removed the use of Big Data Analytics? If yes, how?
Understanding the importance of BDA within the company How do you picture your company using Big Data in 5 years? Vision of the future
Table 1 – Questions and purpose
Notes were taken during the interviews and there were two complementary interviews with the ICA managers for some further questions which arose after the conclusion of the first one. Then, a report was drafted containing the information gathered from the interviews and all the interviewees were asked to review it and provide further feedback if necessary. This was done in order to reduce the risk of subjective interpretation of the interview data. The feedback provided confirmed the content of the reports. Regarding the data gathered through reports, journals and newspaper, a scanning of all the Year-End Reports and all the Annual Reports published by the two companies from 2008 was made in order to find relevant information regarding their BDA projects. The articles found in Swedish were translated both by a Swedish native speaker colleague of ours and from an online translator. Accordingly, the translation of reports, questions and answers between English and Greek were also conducted from the native Greek speaker co-author and the use of an online translator.
An analysis of the data gathered from the interviews was made on their content, by getting first a deep understanding of the data available and assessing their quality. The data were organized into two coherent categories after they were collected, in accordance with the sequence of the questions asked as presented above: the first category concerns the implementation of BDA and it gives information about BDA projects, the human capital involved, the top management’s involvement in BDA, the access of resources in the use of BDA and perceived hurdles arisen in their implementation; the second category contains data of how BDA is perceived as a driver for CA. The
18 data were systematically analyzed and carefully re-read, then condensed and matched with the concepts developed in the literature review. The focus of the analysis was to respond to the research question and the data were organized by question to look across both respondents, in order to identify consistencies and differences. The data categorization brought meaning to the text and gave a three-fold structure to the analysis, which comes in accordance with the three main stages of the model, as described in the theory section (see again Figure I); those three categories of analysis are: 1. Creation of potential synergy and enablers for actual synergy, 2. IT enabled resources and strategic potential, 3. IT enabled resources and competitive advantage. Hence, the method of analysis chosen for this thesis draws upon the interpretation and synthesis of findings that emerged from the investigations of the individual interviews.
3.4.Reliability and Validity of research
As it is normally the case with semi-structured or in-depth interviews as a strategy for collecting data, the validity of this study can be influenced by several factors. The most important include the willingness from interviewees to cooperate, provision of limited information due to reasons of secrecy and the application of some relative concepts, such as “ to enhance competitiveness or performance”, or the notion of competitive advantage. The last factor that can limit the research validity will be tried to be eliminated by defining all concepts within the context and for the purposes of the research, and making sure that they coincide with the ones perceived and used by the interviewees during the selection of data. Another limitation is the existence of bias, since the research is concentrated on how the interviewees perceive a given situation and that can differ within different people, different organizations or different industries. In order to improve the validity of the data gathered through the interviews a triangulation with information collected from corporate reports, industry reports, specialized journals and newspapers was made. A triangulation, as stated by Saunders et al. (2009), “is the use of two or more independent sources of data or data collection methods to corroborate research findings within a study” (Saunders et al., 2009, p.154). It is a methodology highly recommended when the type of research is a case study conducted through semi-structured interviews (Saunders et al., 2009). The present study is concentrated in the specific industry of retail in the Swedish and Greek markets, and it is also based on the way a phenomenon it is perceived to affect a specific organization. Therefore we reserve our doubts on whether the results can be generalized under different contexts and different industries.
19
4.
Case studies
This section includes the data collected from the case studies ICA AB and Masoutis S.A. The data are presented as mentioned above into two broad categories, which are in accordance with the questions and the order those were posed (Table I). Those are: BDA implementation within the firms, in order to understand the way they use BDA and BDA as a driver for CA, in order to retrieve their perception of the correlation between BDA and firms’ competitiveness.
4.1.ICA Case Study
ICA AB is one of Northern Europe’s leading retail companies, with nearly 2,150 stores in Sweden, Norway, Estonia, Latvia and Lithuania. Since 1938, ICA AB has been supplying a wide range of fresh foods to locations throughout Europe. ICA Sverige AB is the Swedish subsidiary of ICA AB and it has a strong and comprehensive national presence in grocery retail. It had 1,375 outlets in operation in Sweden at the end of 2010 (Euromonitor International Passport, 2012) and it is the leader in grocery retailers with retail value share of 36% (Euromonitor International Passport, 2012). ICA Sverige AB operates around the country in cooperation with independent retailers. The retailers own and manage their own stores, but have agreements with ICA Sverige AB in a number of important areas.
As mentioned above, the first interview was conducted with Olof Granberg from the IT department, and the second one was conducted with David Holmstrand, chief CRM manager. The phone interviews were conducted with the managers of the aforementioned ICA stores in Uppsala, who all preferred to stay anonymous.
4.1.1. ICA case is a Big Data Analytics case
ICA Sverige AB (from now on referred as “ICA”) constitutes a BDA case and the firm acknowledged the Analytics systems they use as BDA systems. Big Data were defined the same way as on the present study from the IT/BI department of ICA, characterized by the three Vs (Volume, Velocity and Variety). Concerning how those three characteristics apply in the case of ICA, the following was stated:
Volume is related to the amount of information (transactions) that companies deal with on a daily
basis; ICA defines one transaction as one line on one receipt, for instance: two bottles of milk for one customer in a specific purchase is one receipt line. However, it’s a hard concept to define
20 precisely because it depends on the kind of business we are considering; for some businesses, for example, 10 million transactions per day are a huge amount of data, for others, instead, like the bank industry, are not. ICA is claiming to use 50-100 millions of transactions for analysis on a daily basis (Granberg, 2013).
Velocity regards both how fast data moves and how fast customers’ behaviors change; “if ICA is
able to be there when those behaviors change we might have a huge advantage. Being on the top of that wave has a big impact on firm’s performance”, Olof Granberg reveals.
Variety regards all the products customers buy and all the ways they do it. That means that they
must be able to present personal offers as precisely as possible. Regarding the variety of the sources of the data they gather, it was stressed that ICA does not analyze unstructured data, especially the part that comes from social media. Their focus is on the “point of sale data”, which means the receipt line, so info stemming from the receipts of the customers purchases. Indeed, the majority of their data comes from the ICA Card that is both a loyalty and a bank card, from which they can get a lot of information regarding customers’ behaviors and purchase habits. ICA Card has been claimed to have an excellent percentage of penetration between ICA customers, which is more than 60% (Granberg, 2013).
ICA has been using BDA for two years now. Although they have recognized already a lot of benefits that BDA can provide ICA with, it was stressed from all the interviewees that they are still at a starting point. They are still in the beginning of their use and the company is on its way to have a deeper understanding of that phenomenon.
4.1.2. Big Data Analytics’ implementation within ICA
As mentioned above, ICA is using BDA with a main focus on structured data coming from the receipts of the customers’ purchases. Concerning the IT systems they use for BDA, they buy the databases and the tools needed but they also design their own data models in order to reach a higher level of flexibility regarding their needs. The main sources are the sales information, such as “line receipt”, and the ICA Card (Granberg, 2013). This provides several kinds of information, such as demographic data: household, age, etc. They analyze those data in order to personalize the behavior patterns and understand each customer’s needs individually. The main areas where the results from BDA are implemented are: Customer Relation Management (CRM) department in a high degree, in order to personalize product offers to individual needs and retain customers’ loyalty and Supply
21 Chain and Logistics departments in a lesser degree, in order to optimize their operations (Granberg, 2013).
Relating to the main reason why ICA started employing BDA and what they expected to find, it was stated that there was not a specific reason why they started implementing BDA projects; for them, it was more like a natural evolution coming from data analytics. BDA is seen as a process, in which they are just making small steps, thus it is impossible to define a specific moment in which they started calling them BDA instead of data analytics. Indeed, “data have always been there, they only grew over time” (Granberg, 2013). However, it was stated that ICA had predicted before investing in BDA which departments would gain the most from their use; Sales and CRM/Marketing departments were the ones predicted to gain the most advantage from the implementation of BDA (Granberg, 2013). This was due to the relationship between the use of customer data with the business need of personalizing offers and, in that way, enhance marketing.
Regarding the projects implementation, there are two main ways in which ICA is approaching the analysis of Big Data: one is initiated when a specific department has a specific question that needs to be answered. In this case the Business Intelligence and IT department spends some time, more or less one week, of analyzing data and trying to answer this question. The second one is a long-term project (Granberg, 2013). ICA is developing several “start-up projects” and business cases between IT/BI and other departments, such as CRM/Marketing, Supply Chain, Logistics and Sales department. He continued stating that the most effective way is to work with one department at a time, because in that way they can better specify the needs of each individual case and therefore select the data that need to be analyzed in order to serve those needs (Granberg, 2013).
An example of a long term ongoing project with the objective of increasing sales, was to study how customers move inside the stores (“customer lap”) in order to understand if they walk in front of each shelve or not; the BDA contribution was that ICA got data from the receipt line about which products each customer bought, data which were used in order to try to understand their “lap”. Identifying the way customers move inside the stores is also achieved with offering them the opportunity to scan each product by themselves. In this way it is more feasible to follow their moves inside the store. Indeed, consumers seem to be increasingly using self-service scanning and payment systems to conduct their grocery shopping but are also additionally indicating a greater willingness to use the internet to plan, order and purchase their grocery shopping (Euromonitor International Passport, 2012), and thus respond positively to those kind of practices initiated.
22 Moreover, another important project in which BDA are applied was explained by David Holmstrand to be the Mina Varor (“My groceries”) one, the first one-to-one marketing project. The idea of Mina Varor came up after many customers told the company that the offers they receive in the mail do not fit their needs (ICA Annual Report, 2008). Although the analytics involved are fairly simple, the sheer volume of information is rather impressive, at least compared to other marketing operations. Through Mina Varor, ICA presents personalized offers to its customers in order to improve their satisfaction towards the brand and thus increase their loyalty. To be specific, it was mentioned that “eleven times a year approximately two million customers receive a unique combination of up to eight offers, selected from a bank of more than 1,400 offers involving nearly 10,000 items. According to wolframalpha.com, there are 358 758 599 801 819 985 075 combinations of eight offers out of 1,400 possible” (Holmstrand, 2013). This agrees with what had been also mentioned by Fredrik Persson, the former manager of CRM department of ICA, on an interview for an online Swedish newspaper; he stated that the service of “Mina Varor” faced an evolution during the years, thanks to new CRM databases: ICA is now offering discounts not only on products that customers are used to buy, but also on new products that might be potentially interesting for them. Moreover, through “Mina Varor”, ICA is sending a newsletter regarding the new products that are present in the stores and he argued that the sales of new products in the supermarkets increased (Ollén, 2011). Persson continued stating that this service is also helping the suppliers because they can use these data in order to decide which new product they should launch following consumers consumptions habits (Ollén, 2011).
Another solution was to study the “product pairing”: it means checking which products customers bought in pair (for example hamburger and hamburger bread) and find a way to encourage people to do this kind of purchases and improve also the placement of the products on the shelves (Granberg, 2013). Fredrik Persson, former CRM manager of ICA, had commented on product pairing, that he believed the next step will be to “remind” customers products that they might have forgotten; for example, “product pairing” and information such “others who bought this product, also bought that product” included in the personalized offers will go in this direction (Ollén, 2011).
BDA are also used to analyse the opportunity to open a new store in a specific location; in this case they use open source data from Statistics Sweden in order to understand if in that area there are people living with enough funds, that could be potential customers (http://www.scb.se/default____2154.aspx). They cross this information in combination with the
23 presence of the competitors’ stores in that place, in order to identify the best locations to build their stores.
Regarding to the human resources that are used during the implementation of those projects in general, it was affirmed by all interviewees that projects are run by a group comprised by IT employees with the collaboration of some people from other departments, depending on the ongoing project. Projects usually involve a project owner from a department on the business side, resources from other relevant/affected departments, and IT competence. When it comes to handling BDA, especially customer data, ICA's CRM department is usually involved both on the business and IT side, implying that a few individuals with specific competencies each participate in several such projects. Not everyone is involved in every project but there are certain key resources that have their say in most development activities they have. There are always specialists’ competences involved in all parts of development, whenever it is needed, e.g. controllers looking at the financial processes, logisticians handling replenishment matters etc.
In order to understand the way by which various ICA departments have access to BDA, it was asked whether those departments can systematically employ BDA in their regular activities and routines. It was confirmed from Olof Granberg, that there are daily interactions between IT and other departments that are involved in projects with BDA. As it was stated, other departments have free access to databases if they need to find information already stored. Moreover, he claimed that knowledge is easily shared within the company and therefore easily accessible for all departments. As he specified, BDA are not just a project but also an ongoing process. However, David Holmstrand handled the question a bit differently. Although he affirmed as well that people in CRM can have regular access to those analytical technological tools, he mentioned one basic factor that could limit Big Data’s systematic employment. This limitation relates to the effective understanding of BDA from the majority of the employees. Indeed, he stated that there are a limited number of employees (specialists) who could, and are, employing BDA in their daily routines and it’s not easily accessible for the great mass of employees. For this reason, whenever someone needs something relating to BDA that request needs to be handled by the few individuals who have this accessibility, often IT specialists.
The aforementioned access to BDA regards only the employees of the different departments within ICA. In relation to the individual ICA store owners, those are not using BDA in their everyday practices. From our phone interviews with the store owners, it was confirmed by all that they do not