Essays in the Economics of Education and Program Evaluation
by
Hongliang Zhang
B.S., Peking University (2001) MURP, University of Minnesota (2003)ARCHIVES
Submitted to the Department of Economics and the Department of Urban Studies and Planning in partial fulfillment of the requirements of the degree of
Doctor of Philosophy at the
MASSACHUSETTS INSTITUTE OF TECHNOLOGY
September 2009
MASSACHUSETTS I~NSTnTE
OF TECHNOLOGY
OCT
2 0 2009
LIBRARIES
© Hongliang Zhang, MMIX. All Rights Reserved.
The author hereby grants to MIT permission to reproduce and distribute publicly paper and electronic copies of this thesis document in whole or in part.
Signature of Author ... .... ...epartment of Economic Department of Urban Studies and Planning
July 15, 2009 Certified by ... ... ... ... . ... j... Joshua . .. .Angrist
Ford Professor of Economics Thesis Supervisor Certified by
Certified by
... ... ---... • " .. ... Esther Duflo Abdul Latif Jameel Professor of Poverty Alleviation and Development Economics Thesis Supervisor ... . .. . ... .... ...
Karen R. Polenske Professor of Regional Political Economy and Planning
Thesis Supervisor A ccepted by .. _..t .. . ... ...- ... ...
Esther Duflo Abdul Lati meel Professor of Poverty Alleviation and Development Economics
/ £hair, Gradate-tudies.Committee of th p
nepartment
of EconomicsAccepted b ...
Eran Ben-Joseph Associate Professor of Landscape Architecture and Urban Planning Chair, PhD Committee of the Department of Urban Studies and Planning
Essays in the Economics of Education and Program Evaluation
by
Hongliang Zhang
Submitted to the Department of Economics and the Department of Urban Studies and Planning
on 15 August 2009, in partial fulfillment of the requirements for the degree of
Doctor of Philosophy
Abstract
The dissertation consists of three essays studying the economics of education and program evaluation. Chapter 1 examines the impact of attending a magnet school on student achieve-ment using school admissions lotteries in Wuhan, China. Although lottery winners were more likely to attend magnet schools that appear better in many dimensions, including peer achievement, I find little evidence that winning a lottery improved students' performance on the High School Entrance Exam or their enrollment status at elite high schools three years later. Magnet school popularity, measured by either the competitiveness of the admission lottery or the take-up rate of lottery winners, is highly positively correlated with the aver-age student achievement, but largely unrelated to the treatment effect on test scores that I estimate for each school. This evidence suggests that parents value peer quality beyond its effect on achievement gains, or confuse average student achievement with value added. The finding that magnet schools are sought mainly for their observed superiority in average student achievement rather than for their academic value added casts doubt on the potential of school choice to improve student achievement, at least in this context.
Chapter 2 studies peer effects on student test scores in middle school using a multi-cohort longitudinal data set from China. I base the identification on variation in peer composition across adjacent cohorts within the same school to control for student sorting across schools and the unobserved school characteristics that affect student outcomes. The existing peer effects literature pays little attention to the potential positive correlation in measurement errors between the individual- and the peer-level lagged test score variables, which I find important in my data. Such a positive correlation in measurement errors arises because the individual- and the peer-level lagged test score variables are subject to transitory common shocks due to the continuing presence of a student's former peers in her current peer group. I derive formally that the presence of transitory common shocks on lagged test scores will lead to a negative bias in the estimate of peer effects, and propose an empirical strategy to address this problem by using the lagged test score measures of new peers to instrument for the corresponding lagged test score measures of all peers. The within-school IV estimate of
the linear-in-means model shows little evidence that having peers of higher average lagged test score significantly improves a student's test score. Estimates of heterogeneous peer effects models, however, show some evidence in favor of ability tracking.
Chapter 3 investigates the nonparametric analysis of randomized program evaluation. Observational problems following randomization sometimes prevent researchers from collect-ing complete and error-free outcome data. The problem is more serious if sample selection varies by treatment status and interacts with data contamination (imperfect matching). In Chapter 3, I develop a trimming procedure for nonparametric analysis of average treatment effects in the presence of sample attrition and imperfect matching, as well as their inter-actions. I show that, if prior knowledge or a consistent estimator of data contamination rate is available and the treatment status affects sample selection in "one direction," the proposed trimming procedure can construct bounds on average treatment effects for a spe-cific subpopulation whose outcomes would be observed irrespective of treatment assignment status.
Thesis Supervisor: Joshua D. Angrist Title: Ford Professor of Economics
Thesis Supervisor: Esther Duflo
Title: Abdul Latif Jameel Professor of Poverty Alleviation and Development Economics
Thesis Supervisor: Karen R. Polenske
Acknowledgement
I am deeply indebted to my advisors, Josh Angrist, Esther Duflo, and Karen Polenske for their infinite patience, encouragement, guidance, and support. I cannot thank Josh, Esther, and Karen enough for being so generous with the time and attention they devoted to my development throughout my years at MIT. I feel unbelievably fortunate to have the opportunity to work with and learn from Josh, Esther, and Karen.
My heartfelt thanks also go to Bill Wheaton, who offered generous advice, support, and recommendation at various stages of my study at MIT. I am also grateful to Daron Acemoglu, Glenn Ellison, and Frank Levy for their generous recommendation for my application to the Department of Economics and to Nancy Rose for her invaluable advice and support during my job search.
Many professors at MIT have also generously offered their time and advice, especially David Autor, Abhijit Banerjee, Amy Finkelstein, Michael Greenstone, and Benjamin Olken. I have benefited enormously from my fellow graduate students. Thanks are due to my entire cohort, and especially to James Berry, Rongzhu Ke, Cynthia Kinnan, Weifeng Li, and Tao Jin. I also want to thank Robert Irwin for his patient and tireless writing consultations, which greatly improved this thesis. I am also grateful to Tosha Hairston, Peet Hoagland, Gary King, Malinda Nicolosi, Kim Scantlebury, Selene Victor, and Sandra Wellford for their generous administrative assistance.
Special thanks go to my master's advisor at University of Minnesota, Ragui Assaad, who introduced me with quantitative research methods and inspired me to conduct research on education. Part of my field work was conducted in the Institute of Advanced Studies at Wuhan University. I am grateful to Heng-fu Zou for his warm invitation. I also thank Bing
Liang, Tao Mao, Xiao Qin, and Ye Yang from Wuhan University for assistance in data entry. The George and Obie Shultz Fund and the MIT Center for International Studies Summer Study Grant provide financial support for my field trip.
Finally, my greatest thanks are to my family. I am eternally grateful to my parents, Yongquan Zhang and Lili Zhu. They have always believed in me and offered their unwavering support in every step of my life. My wife, Qin Zhao, has accompanied me for the past five years at MIT. Her patience, understanding, and love have been the source of great inspiration at many times during my PhD process. Without her, the completion of this thesis would have been impossible. I could not hope for a more supportive and understanding family. I dedicate this thesis to them.
Chapter 1
Magnet Schools and Student
Achievement: Evidence from a
Randomized Natural Experiment in
China
1.1
Introduction
Recent decades have seen growing efforts in several countries (e.g., Chile, China, Pakistan, and the United States) to improve educational outcomes by increasing the scope of schooling alternatives available to parents and students. The popularity of school choice is based upon the belief that increasing parental choice can yield improved efficiency in education production through enhanced competition or better matches between students and schools
(e.g., Friedman, 1962; Chub and Moe, 1990; Hoxby, 2000).
The ability of the choice mechanism to improve educational outcomes turns in part on the extent to which parents express their preference for achievement gains. Some previous studies have found that parents do not necessarily seem to place the highest weight on academic outcomes (Hastings et al., 2005, 2006; Jacob and Levitt, 2006; Jacob and Lefgren,
2007), and may not know which schools are likely to benefit their child the most academically
(Figlio and Lucas, 2004; Mizala and Urquiola, 2007). Moreover, if peer externalities play a significant role in value added, parents may rationally prefer a poorly-run school with good peers to a well-run school with bad peers (Willms and Echols, 1992). As noted by Rothstein
(2006), any of these factors will dilute the incentives for efficiency improvement that choice
might otherwise create.
A growing body of empirical work has used random assignment to estimate the effect on academic outcomes of attending a school other than the local public school.' Some of these studies show benefits (e.g., Green et al., 1999; Hoxby and Rockoff, 2004; Lai, et al.,
2008) but others show little or no effect (e.g., Howell and Peterson, 2002; Krueger and
Zhu, 2004). Cullen et al. (2006), in a study closely related to this work, use lotteries to evaluate the impact of attending a sought-after school in the Chicago Public Schools. They find no evidence that winning a lottery to attend a sought-after school improves students' performance on a variety of traditional academic measures. In contrast, Angrist et al. (2002,
1
Theoretically, it could be that school choice benefits all students through increased competition, including those who remain in attendance area schools. So the partial equilibrium effect could be an overestimate or an underestimate of the overall effect. Unfortunately, due to the extreme difficulty in the identification, little evidence exists regarding the potential for schools to respond to the enhanced competitive pressure induced by school choice (e.g., Hoxby, 2003; Figlio and Rouse, 2006; Hsieh and Urquiola, 2006; Carnoy et al., 2007). The research designs of the limited studies on the general equilibrium impact of school choice are far from ideal, and do not necessarily rule out other explanations for the improvements (Rouse and Barrow, 2008).
2006) find consistently positive effects of private school vouchers on grade completion and test scores in Colombia. One possible explanation of this difference in findings is that there might be more potential for school choice programs to generate large efficiency gains in developing countries that have less efficient public schools and less competitive schooling environments.
This chapter presents new evidence on the impact of choice on student achievement and the question of how parents choose schools. The evidence comes from a particular form of school choice in China that allows students access to alternative magnet (gaizhi) schools outside their assigned local public schools by paying an additional charge. This chapter answers two questions: First, what is the direct impact of attending a magnet school on student achievement? Second, is there any evidence that parents chose the most academically beneficial school for their child?
Students in China are assigned to primary schools (grades 1-6) and neighborhood middle schools (grades 7-9) based on their residence. Middle school graduates take a citywide uni-form High School Entrance Exam (HSEE) and are tracked into different types of secondary schools (grades 10-12) based on their HSEE test scores. Magnet schools exist only at the middle school level and open their enrollment to all interested students within the city will-ing to pay the tuition. Magnet schools in China share many common features with their
U.S. counterparts:2 they are located mainly in large cities,3 have better qualified teachers and higher per pupil spending than neighborhood public schools, are highly sought after,
2
See Steel and Levine (1994) for an in-depth study of magnet schools in the U.S.
3One in six middle school students in large Chinese cities are enrolled in magnet schools. While in the
U.S., though magnet schools only account for 4 percent of the overall enrollment nationwide, they enroll 15 percent students in districts where magnet programs are available. The majority of these magnet districts are urban districts in large metropolitan areas.
and enroll a disproportionate number of students from families with high socioeconomic sta-tus (SES) and high primary school test scores. Lotteries are often used by oversubscribed magnet schools to determine admission eligibility, providing identification for magnet school attendance for students with a variety of academic backgrounds.
A number of features of Chinese magnet schools make the Chinese context especially interesting and informative. First, in contrast to the United States, magnet schools in China have the same curriculum as other neighborhood schools. Achievement is measured by test scores on the HSEE, which are almost the sole determinant of their secondary school admission status. This unidimensional, high-stakes exam provides a good benchmark for evaluating the impact of magnet school attendance. Second, because choice is costly for parents, the perceived difference between magnet schools and neighborhood public schools must be substantial, making it an ideal context to compare parental perception of what constitutes a "good school" to evidence of effective value added.
The data set used in this chapter consists of over 13,000 students who participated in the admissions lotteries of magnet schools during 2002-2004 in three school districts in Wuhan, China. I match applicants in the lottery data to administrative records of the city's HSEE database to obtain student information on middle school enrollment status, HSEE test scores, and secondary school admission status. Although not all students complied with their lottery assignment and about half of the lottery losers managed to get into the magnet school they chose through the "back door," winning a lottery still increased the probability of enrolling in that magnet school by 33 percentage points. Despite the fact that lottery winners had access to a better peer group, better qualified teachers, and a school they chose (and that hence might better suit their learning needs), I find little evidence that winning a lottery is
associated with any academic benefit to students. The point estimates of the two-stage least squares (2SLS) regressions of students' HSEE test scores on their magnet school enrollment status using lottery outcomes as an instrument are all insignificant, and allow me to reject a modest gain of 0.1 standard deviation (SD) at the five percent level.
If magnet schools do not improve academic outcomes, why are parents willing to pay for them? One possibility is that parents value things other than academic success when choosing a school. In a context of heterogeneous parental preferences, parents who value other school attributes may be willing to trade academic gains for utility gains in other dimensions. Although magnet schools in Wuhan are better in nonacademic attributes
-such as physical environment, classroom discipline, and peer behavior - than neighborhood public schools, this is unlikely to be the main explanation here, given the importance of students' HSEE test scores in high school admission. Another possibility is that parents place high value on average student achievement when choosing a school, either because they value peer quality beyond its effect on value added, or because they confuse average achievement with value added. Even though the empirical evidence cannot distinguish these two underlying reasons, either of them being true would lead schools to be sought for their observed student achievement. Indeed, I find that magnet school popularity, measured by either the competitiveness of the admission lottery or the take-up rate of lottery winners, is highly positively correlated with the average student achievement, but largely unrelated to the treatment effect on student achievement that I estimate for each school. The finding that magnet schools are sought mainly for their observed superiority in student achievement rather than for their academic value added casts doubt on the potential of school choice to improve student achievement, at least in this context.
The rest of this chapter is organized as follows. Section 1.2 provides background on the middle school system and the admission procedure of magnet schools in Wuhan. Section 1.3 introduces the data and presents some descriptive statistics. Section 1.4 presents the impact of winning a lottery on magnet school enrollment and peer achievement. Section 1.5 discusses the reduced-form effect of winning a lottery and the causal effect of attending a magnet school - identified by using lottery status as an instrument - on students' academic outcomes. Section 1.6 examines the magnitude and the likely sign of the potential biases in the main results due to differential sample attrition between lottery winners and losers. Section 1.7 discusses possible explanations for parental school choice that are consistent with the empirical evidence here. Section 8 provides concluding remarks.
1.2
Background
With a population of over 4.5 million, Wuhan is the fourth most populous city in China. Situated at the confluence of the Yangzi River and its longest tributary, the Hanshui River, the city comprises three parts: North Bank (Hankou), West Bank (Hanyang), and South Bank (Wuchang) (see Figure 1-1). The three parts can be considered as independent enroll-ment areas as students rarely commute across river for schooling. In this chapter, I focus on all three school districts (Districts 1-3) in the North Bank for which data are available. The middle school system in the North Bank includes 74 middle schools and enrolls approx-imately 60,000 students, accounting for about 45 percent of the city's enrollment in middle school.
assigned to a neighborhood middle school through an assignment mechanism that works at the neighborhood level. But all eight of the magnet schools in the North Bank - two to three from each district - have opted out of the assignment mechanism and opened their enrollment to all interested students from the entire school district or even beyond district boundaries. Before 2002, these magnet schools required applicants to take entrance exams and admitted almost all the top-scoring students in each school district. To ease the exam pressure on children and reduce the across-school inequality in student ability, starting in 2002, the city education council banned the use of any form of entrance exam in middle school admissions and required admissions to all public schools to be based on residence.. In order to retain their open enrollment policy, all these magnet schools transformed into privately sponsored public schools.4 Public middle schools are tuition-free under China's Nine-Year Compulsory Schooling Law. By switching to a semi-private financing structure, these magnet schools could continue to receive funding from the local government but also charge tuition to students.5 All magnet schools set their tuition at US $400 per year,6 the price ceiling allowed by the city education council. (For reference, the average annual disposable income of a three-person family was roughly $3,000 in the city during the period under study.)
4The semi-privatization had started even before 2002 for a few magnet schools, some of which had by
then been transformed into privately sponsored public schools in order to charge discriminatory tuitions to students who scored below the admission cutoff score on the entrance exams. The tuition varied between $400 and $800 per year, depending on how far a student's test score was away from the admission cutoff. The 2002 reform, however, caused the semi-privatization movement to sweep through all magnet schools.
5
Revenue from tuition was divided among the magnet school, the school district, and the city education council in a 5:4:1 ratio. School districts and the city education council used their share of revenue to fund capital expenditures on neighborhood middle schools with poor facilities. Basic salaries of magnet school teachers were paid from the local government budget, which was why these magnet schools were not purely private schools. But magnet schools provided much higher overall compensation to their teachers via school-funded benefits and performance pay.
6
All monetary amounts in the paper refer to U.S. dollars, converted by the exchange rate at the time of the study.
Each student could apply to only one magnet school in the city and would be disqualified from enrolling in any magnet school if caught submitting multiple applications. Districts 2 and 3 allowed magnet schools in their district to set aside a fraction (up to 50 percent) of their admission quota for advance admission exclusively for qualified applicants: applicants with award records in city- or district-level academic, artistic, and athletic contests. In order to attract the most talented students, all magnet schools guaranteed admission (through formal or informal channels) and offered full or half tuition waivers to students with extra-ordinary award records. As magnet schools differed in the selectivity of their criteria for advance admission and tuition waivers as well as the competitiveness of their admissions lotteries, students might be strategic in selecting which magnet school to apply to and did not necessarily choose their most preferred school.
All magnet schools were oversubscribed for the period studied here as demand at the regulated tuition far exceeded the admissions quotas. In a few cases, because the number of qualified applicants of a magnet school exceeded its advance admission quota, an advance lottery was conducted to select among qualified applicants. Qualified applicants who had lost out in the advance lottery, however, could get a second chance to gain admission (to the same magnet school) through the main lottery. Every year, a main lottery was conducted for each magnet school among its general applicants, plus its qualified applicants who did not win admission in the advance lottery (if any), to assign the rest of the admission quota randomly. In each lottery, a computer program randomly assigned a lottery number to each student. The magnet school enrolled students with the lowest numbers first until it filled its admission quota for that lottery. All admissions lotteries were certified by notaries public to verify their randomness to prevent tampering. Lottery winners were required to make
an upfront payment of their three-year tuition (net of the waiver provision, if any) by the deadline announced by the school, and those who did not pay their tuition by the deadline were considered to have declined their admission offer. A significant portion of applicants who had lost the main lottery, however, still managed to get into the magnet school they applied to through the "back door."7 A typical magnet school in the city admitted about one-third of their students by advance admission, one-third through the main lottery, and one-third through the "back door."
For students from District 2 (where pre-lottery test scores are available), Figure 1-2-A shows the Kernel density curves of their 6th grade combined math and Chinese test scores (standardized to have zero mean and unit variance for each cohort) by their magnet school enrollment status. There is clear evidence that magnet schools removed a disproportionate share of high-achieving students from their assigned neighborhood middle schools. Students enrolled in magnet schools had a mean 6th grade test score that was 0.47 SD above the district average. In contrast, students enrolled in neighborhood middle schools had a mean 6th grade test score 0.10 SD below the district average. Figure 1-2-B shows two sources of student sorting: advance admission recipients and main lottery participants had mean 6th grade test scores that were about 0.68 SD and 0.31 SD above the district average, respectively, leaving the nonparticipants a mean test score 0.21 below the district average.
7
The tuition paid by students who entered through the "back door" varied between $400 and $800 per year, with the latter being set by the city education council as the maximum allowable charge. But being willing to pay the maximum allowable charge was not sufficient for an applicant to gain admittance to a magnet school. The most important factor determining whether a lottery loser could be admitted through the "back door" was whether she had a referee who was important enough to influence the decision of the principal (e.g., a government official her parents found through their personal social network). The student's academic performance at primary school was another factor, but of secondary importance. The final tuition charged for a student admitted through the "back door" was determined by taking into account the importance of her referee, the closeness of her relationship with her referee, and her academic performance at primary school.
Another schooling option for students is to attend a private middle school, which receives no public funding and is financed entirely by student tuition. Most private middle schools are boarding schools located in neighboring counties outside the city's urban boundary. Private middle schools are generally considered as inferior to magnet schools and only account for a very small share (less than two percent) of middle school enrollment. Nonetheless, private middle schools were still likely to be the option some lottery participants might choose, especially lottery losers who could not get into the magnet school they applied to through the "back door."
1.3
Data Description and Summary Statistics
With the cooperation of the notary public office in the North Bank, I have obtained the administrative data of three cohorts of students who participated in the main lotteries of all the eight magnet schools in the North Bank during 2002-2004. The lottery data include each applicant's name, gender, qualification status, lottery outcome, and primary school graduated from. I exclude a small fraction (3.5 percent) of applicants who were enrolled in primary schools outside the North Bank at the time of the application. (Note that excluding these students does not affect the validity of the randomization because their primary school enrollment status was predetermined at the time of the lottery.) The final sample consists of 13,769 applicants who participated in 21 lotteries of all the eight magnet schools in the North Bank during 2002-2004,8 including 997 qualified applicants in eight of the lotteries
8
Three lotteries conducted in the year 2003 in District 2 are excluded because the notary public office's records for these lotteries only contain information on the lottery winners, but not the losers.
of four of these magnet schools.9 Students in the full sample constitute approximately 23 percent of all students who transitioned from primary school to middle school in the North Bank during this three-year period. For applicants from District 2, I have obtained their 6th grade test scores from the school district. But no pre-lottery test scores are available for applicants from the other two districts.
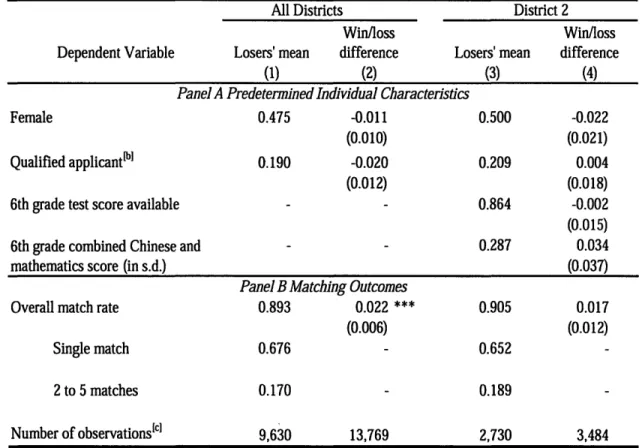
Overall, these admissions lotteries were competitive: on average, only three out of ten participants won their lottery. There is little evidence of any association between win/loss status and students' predetermined individual characteristics at the time of the lottery. This can be seen in Panel A of Table 1-1. Columns 1 and 2 present lottery losers' means for each dependent variable and the coefficients from separate regressions of each dependent variable on an indicator variable for winning a lottery and a full set of lottery fixed effects, respectively. The full sample of all lottery participants who applied from the North Bank is used in column 2, providing a test of the randomness of the lotteries among applicants from the North Bank. Columns 3 and 4 report lottery losers' means for each predetermined individual characteristic and the win/loss difference for a subsample of applicants from District 2, where students' 6th grade test scores are available. For 87 percent of the applicants from District 2, I find their 6th grade test score by matching their name, gender, and primary school to the district's test score records." In both samples, lottery winners and losers were balanced on all the predetermined characteristics. There is no evidence that the lotteries favored qualified applicants or applicants with higher pre-lottery test scores. As a further check of
9No qualified applicants participated in the other 13 lotteries.
0oNonmatching is largely due to name misspelling or gender misidentification in either the lottery records
or the 6th grade test score records. Students' 6th grade test scores, which were coded from the school district's handwritten records, might be subject to some degree of data entry error.
the randomness, I compare the winning rates by primary schools for schools with more than 20 applicants participating in a lottery to the winning rate of this lottery for the full sample. In only 9 (4.3 percent) out of the 207 comparisons does the winning rate of the primary school differ from the lottery winning rate at the five percent level.
Individual information in the lottery data is used to match lottery participants to admin-istrative records of the HSEE database, which includes student information on middle school enrollment, HSEE test scores, and secondary school admission status. All middle school grad-uates are required to take the HSEE as it also serves as the middle school graduation exam. Unfortunately, the lottery records do not contain perfect identification information that can guarantee unique tracking of students in the HSEE database. Specifically, I can only use the combination of an applicant's name and gender to search for matches in the HSEE records, which sometimes leads to multiple matches due to common names. As dropping out and repeating a grade were almost nonexistent in middle school and students rarely commuted across river to attend middle school, I limit the matching search to the HSEE records of the corresponding cohort that graduated from middle school in the North Bank three years after each lottery.11
Panel B of Table 1-1 reports the matching statistics by lottery status within the universe of all middle school graduates from the North Bank. The overall match rate is high, though not perfect: about 90 percent of the lottery participants are matched to HSEE records, including 68 percent uniquely matched and 85 percent matched to no more than five records. 11Expanding the source data to middle school graduates from the entire city only reduces the nonmatch rate by about two percentage points, suggesting that very few applicants opt for middle school in the West Bank and South Bank. However, expanding the source data significantly increases the probability of multiple matches. In this paper, I only report the results using matched records in the North Bank. But the main results remain similar if I instead use matched records in the entire city.
I estimate the empirical results of this chapter using the single-matched sample and the combined single- and multi-matched sample consisting of applicants with up to five matches in the HSEE records, respectively. When an applicant has two to five matches in the HSEE database, I assign the applicant the mean value of the multi-matched HSEE records and a weight that is equal to the number of matches. However, I exclude applicants matched to more than five HSEE records out of concern that noise due to matching errors may outweigh information for those individuals.
The missing outcomes can be due to either name misspelling, gender misidentification, families moving out of the city, or students opting for middle schools outside the North Bank (i.e., middle schools in the West Bank and South Bank or private middle schools outside the city). Though sample attrition due to the first three reasons is likely to be exogenous to the randomly determined lottery status, whether a student would opt for schooling outside the North Bank may depend on her lottery outcome. Column 2 shows that winning a lottery increased the likelihood of being matched by two percentage points, suggesting that a small fraction of applicants - who would have opted for schooling outside the North Bank had they lost their lottery - were induced to enroll in the North Bank after winning their lottery. As the degree of differential attrition was very small in practical terms, I first present the main results in Sections 1.4 and 1.5 by comparing the matched winners and losers under the assumption that the differential sample attrition was nonselective, i.e., the characteristics of the small group of applicants whose enrollment status in the North Bank depended on their lottery status did not differ from those who would enroll in the North Bank, irrespective of their lottery status. I then discuss in Section 1.6 the magnitude and the likely sign of the potential biases due to the differential sample attrition between the winners and losers.
1.4
Impact on Magnet School Enrollment and Peer
Achievement
1.4.1
The First-stage Effect on Magnet School Enrollment
Let i = 1,..., N index students,
j
= 1, ..., J index magnet schools, and t = 1, .., T index years (cohorts). For each of the J x T independently conducted lotteries, I can estimate a lottery-specific first-stage effect 6jt that measures the impact of winning the admission lottery of magnet school j in year t on the probability of enrolling in that magnet school:6jt = E[SilDi = 1, Al = jt] - E[SID = 0, Ai = jt] (1.1)
where Si is a dummy variable denoting applicant i's enrollment status in the magnet school she applied to, Di is a binary variable denoting whether applicant i won her lottery, and Ai is a categorical variable denoting which lottery applicant i participated in. Note that each applicant in the sample participated in one and only one of the J x T lotteries.
For ease of interpretation, I estimate a regression-adjusted single-parameter first-stage effect of winning a lottery on enrolling in the magnet school of one applied to by the following model:
J T
Si = 6D% + EETjl(Ai = jt) + Ei (1.2)
j=1 t=1
where 1(Ai = jt) is an indicator for student i having participated in the admission lottery
As shown in Cullen et al. (2006), the coefficient 5 can be expressed as a weighted average of 's wih he P(-P) where Nt is the number of participants in
of 6t's with the weight wjt = Cj~ Et NjtPjt(1-Pjt) lottery jt and Pit is the winning rate of lottery jt.
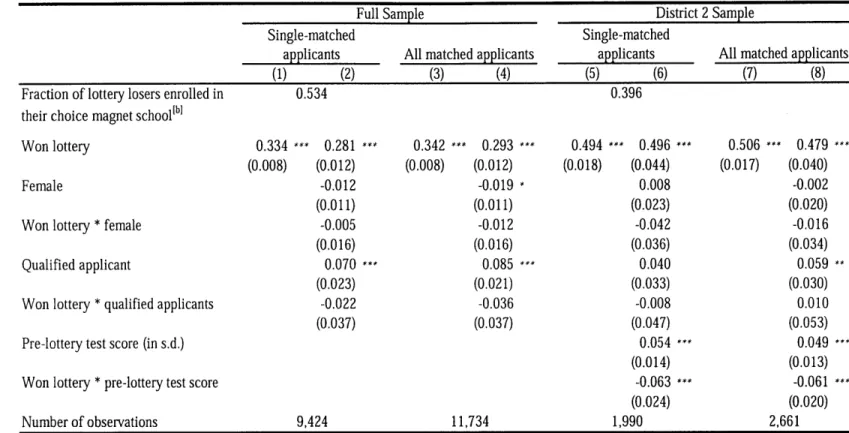
Columns 1 and 5 of Table 1-2 present the ordinary least squares regression estimates of Equation (1.2) using the single-matched applicants of the full sample and the District 2 sample, respectively. The top row reports the "back door" entry rates among the lottery losers (P[S = 1IDi = 0]). Over one-half (53 percent) of the lottery losers in the full sample managed to get into the magnet school they applied to through the "back door." Despite the high baseline enrollment rate among the lottery losers, winning a lottery still had a substantial first-stage effect in the full sample: increasing the probability of enrolling in the magnet school for which the lottery was held by 33 percentage points. Compared to the full sample, the District 2 sample had a lower "back door" admission rate (only two-fifths of the lottery losers were enrolled in their choice magnet school), and a correspondingly higher first-stage effect of winning a lottery on enrolling in the magnet school one applied to (about 49 percentage points).
Selection in "Back Door" Entry
Columns 2 and 6 of Table 1-2 report the OLS regression estimates for specifications that include covariates - such as gender, qualification status, and pre-lottery test scores, if avail-able - and their interactions with the lottery status for the single-matched applicants of the full sample and the District 2 sample, respectively. Results using the full sample show that being a qualified applicant increased the "back door" entry rate by about seven percentage points, suggesting evidence of positive selection on student ability via "back door" admission.
Results of the District 2 sample confirm the positive "back door" selection: a one standard deviation increase in the pre-lottery test score raised the probability that a lottery loser would attend the magnet school she applied to by five percentage points. After controlling for students' pre-lottery test scores, the marginal impact of being a qualified applicant on the "back door" entry rate remained positive, though statistically insignificant. Figure 1-3-A plots the Kernel density curves of the pre-lottery test scores for the single-matched lottery losers in District 2 by their enrollment status at the magnet school of their choice. Lottery losers who attended the magnet school they applied to through the "back door" had higher pre-lottery test scores (with a mean of 0.42 SD) than those who did not (with a mean of 0.25 SD).
The take-up rate among lottery winners was about 90 percent, indicating that ten percent of the winners gave up their admission offer. Next, I check whether lottery winners who gave up their option to attend a magnet school differed from those who exercised their option in their lottery achievement. Figure 1-3-B plots the Kernel density curves of the pre-lottery test scores for pre-lottery winners in District 2 by their take-up status. The two-sample Kolmogorov-Smirnov test (with a p-value of 0.948) cannot reject the equality of the two
distributions.
Columns 3-4 and 7-8 of Table 1-2 report the weighted (by number of matches) least squares regression estimates using applicants with one to five matches of the full sample and the District 2 sample, respectively. The results are qualitatively the same and quantitatively very similar to those obtained using the single-matched applicants only.
1.4.2
Impact on Peer Achievement
According to the evidence from District 2 (the only district where primary school test scores are available), there were several channels through which winning a lottery could improve peers' test scores: (1) qualified applicants admitted by advance admission had very high 6th-grade test scores (with a mean of 0.68 SD); (2) participants in the main admission lottery also had above-average 6th grade test scores (with a mean of 0.31 SD); and (3) lottery losers who attended magnet schools through the "back door" had a higher average 6th-grade test score than lottery losers who did not attend (0.42 SD vs. 0.25 SD).
In the following, I examine the impact of winning a lottery on the achievement of a student's peers measured by their test scores on the HSEE. Let Y(-i)gt stand for the peer mean HSEE test score of student i, i.e., the average HSEE test score of the cohort t of the middle school g that student i attended excluding her own test score.12 The effect of winning a lottery on peer achievement Y(-i)jt is estimated using the following regression model:
J T
Y(-i)gt = aD + X I1 + ZZ pjtl(Ai = jt) + higt (1.3)
j=1 t=1
where X! is a vector of the predetermined characteristics of the applicant, such as gender, qualification status in application, and pre-lottery test scores, if available; pjt is a lottery fixed effect; and qigt is a stochastic error. For all the HSEE takers from the North Bank every year, their test scores are standardized to have zero mean and unit variance.
12
In practice, I do not have the HSEE test scores for all students in the North Bank, but instead obtained a 3.5 percent random sample of all HSEE takers from the North Bank. For most of the lottery participants not in the random sample, their mean peer achievement is estimated as the average among all students in the random sample who belong to the cohort of the middle school of their enrollment; while for a small fraction of lottery participants who happen to be in the random sample, their own HSEE test scores are excluded when calculating their mean peer achievement.
Table 1-3 shows the impact of winning a lottery on the school-grade-level average peer achievement on the HSEE. In the full sample, winning a lottery increased the school-grade-level average peer achievement on the HSEE by about 0.11 SD (from the losers' mean of 0.19 SD); while for the District 2 sample, winning a lottery increased the average peer achievement on the HSEE by about 0.19 SD (from the losers' mean of 0.10 SD). Lottery losers from District 2 had a lower mean peer achievement than those from other districts for two reasons. First, District 2 is a relatively disadvantaged inner-city district in terms of students' average HSEE test scores. Second, the "back door" entry rate among lottery losers was lower in District 2 than in the other two districts in the North Bank. However, because of the relatively larger first-stage effect of winning a lottery on magnet school enrollment in District 2, the win/loss difference in the peer mean HSEE test scores was larger in the District 2 sample than in the full sample.
1.5
Impact on Student Outcomes
1.5.1
The Intent-to-Treat Effect on Student Outcomes
In an ideal random assignment of treatment with no missing outcomes, winners and losers of a particular lottery are balanced, on average, in terms of both their observable and unob-servable characteristics. Consequently, a simple difference between the observed outcomes of the winners and losers of a particular lottery provides a consistent estimate of the intent-to-treat (ITT) effect: the impact of being offered the option to attend that magnet school for students who applied to it in that year. Let Y denote an outcome measure of student i.
Then the ITT effect of winning magnet school j's lottery in year t can be expressed as:
7rjt = E[Y[Di = 1, Ai = jt] - E[Y ID = 0, A = jt] (1.4)
where Ai is a categorical variable denoting which lottery applicant i participated in. The parameter 7rjt is of direct interest if the focus is the impact of having magnet school j in the choice set of students of cohort t who expressed an interest in it. The regression-adjusted ITT effect of winning a lottery on student outcome Y can be estimated using the following regression model:
JT
Y = rD + Xi 2 + Z t jtl(Ai = jt) + vi (1.5)
j=1 t=1
In this study, I construct five measures of students' ex post academic outcomes based on their performance on the HSEE and their secondary school enrollment status: total test scores on the HSEE, a dummy for scoring above the threshold for elite high school admission, a dummy for being admitted by an elite high school, a dummy for scoring above the threshold for regular high school admission, and a dummy for being admitted by any high school. Every year, the city education council announces the minimum score requirements for attending a regular high school and an elite high school, respectively. The two thresholds were usually around the 40th percentile and the 70th percentile of the HSEE test scores of that year.'3 13In addition to these two thresholds, the city education council also sets minimum score requirement for different subcategories of vocational secondary schools. Each senior secondary school then announces a guaranteed admission score that cannot be lower than the threshold the city education council sets for the category it belongs to. After knowing their own HSEE test scores and the guaranteed admission scores of their interested schools, students then submit their ranked preferences for secondary schools - high schools and vocational secondary schools. As the eventual admission score of a school might be lower than its announced guaranteed admission score, students might be strategic in ranking their preferences. The admission process
If winning a lottery could improve students' (elite) high school enrollment status through channels beyond raising their HSEE test scores, we would expect a larger ITT effect on enrollment status than on scoring above the corresponding threshold.
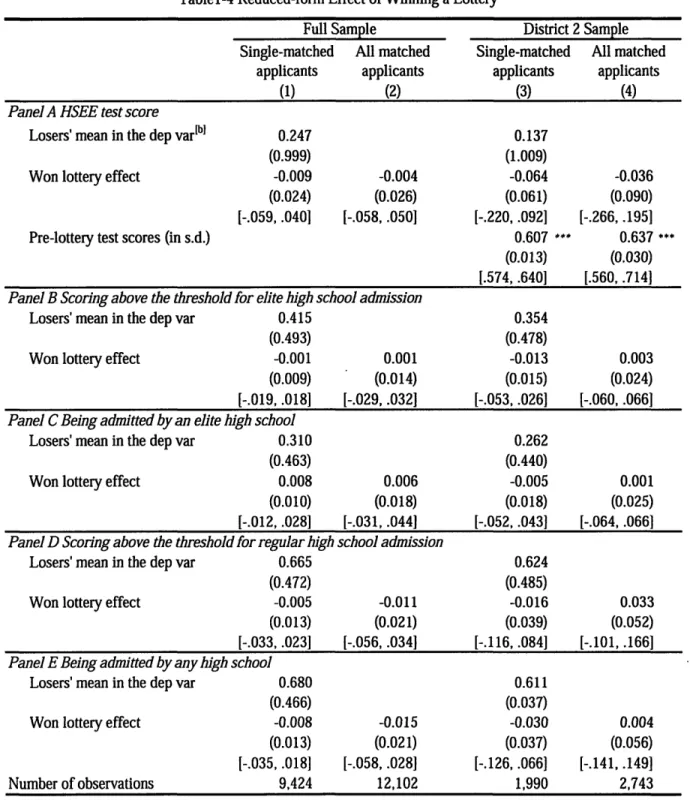
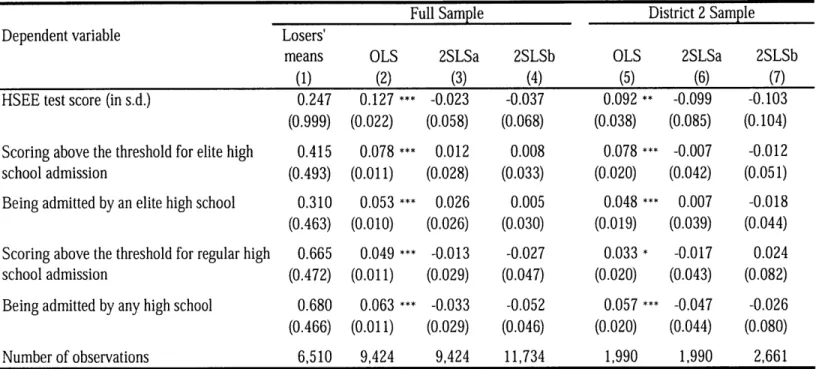
Panels A through E of Table 1-4 present the losers' means and the ITT effects of winning a lottery for each of these five outcome measures. Each column reports an estimated ITT effect using a separate sample. Despite the significant and substantial positive effects of winning a lottery on magnet school attendance and peer achievement, I find little evidence that winning a lottery improved students' academic outcomes three years later. None of the 20 ITT coefficient estimates are significant at the 10 percent level, with 13 coefficients being estimated to be negative (though statistically insignificant). The ITT coefficient estimates of the full sample can reject a positive effect of 0.05 SD on the HSEE test scores and a gain of three percentage points for any of the other four binary outcome measures at the five percent level. The ITT effects on being admitted by an elite high school do not seem to be larger than the effects on scoring above the threshold for elite high school admission, suggesting no evidence that winning a lottery improved students' enrollment status at elite high schools through any nonacademic channel. The same conclusion holds when examining (elite and regular) high school enrollment status in general. The ITT coefficients using the District 2 sample are less precisely estimated, but are qualitatively similar to the results using the full sample. Estimates using the District 2 sample indicate that much of the variation in students' HSEE test scores can be explained by their 6th grade test score difference: a one-standard-deviation rise in the 6th grade test score would lead to a 0.61 SD increase in the is computerized and under direct control of the admission office of the city education council. Even though
"back door" admission is not eliminated, it plays a much smaller role in high school admission than it does in middle school admission.
HSEE test score.
1.5.2
Instrumental Variable Estimates of Magnet School Effects
Section 1.5.1 focuses on the ITT effects of winning a lottery on student academic outcomes. The lottery results, however, were not completely binding. As discussed in Section 1.4, a substantial fraction of lottery losers (about one-half) attended the magnet schools they chose through the "back door", while a small fraction (about one-tenth) of lottery winners did not exercise their choice option. Using applicants' lottery status as an instrument, this section presents the two-stage least squares (2SLS) estimates of the effects of attending a magnet school on students' academic outcomes. Under the exclusion assumption that winning a lottery only affected students' outcomes through its effect on their enrollment status in the magnet school they chose, the 2SLS regression estimates the following model:J T
Y = +ySi + X'3 + E jt(A = jt) + yj (1.6)
j=1 t=1
The associated first-stage relationship instruments the enrollment status at the magnet school they chose (Si) using their lottery status (Di):
J T
Si = OjtD + Xi04 + Z Tj1tl(Ai = jt) + vi (1.7)
j=1 t=1
In addition to including a vector of individual characteristics Xj as controls, Equation (1.7) differs from equation (1.2) in that equation (1.7) allows the first-stage effect to vary across lotteries, while equation (1.2) estimates a single parameter for the weighted average first-stage effect.
Table 1-5 presents both the OLS and 2SLS estimates of the effects of attending the magnet school students applied to on the five outcome measures discussed in Section 1.5.1. The general picture of the OLS results is that applicants who attended the magnet school they chose outperformed those who did not. All the ten OLS coefficient estimates are positive and statistically significant at the 10 percent level, with eight being significant at the one percent level. Because of the positive selection on student ability via "back door" admission as discussed earlier, the OLS estimates of magnet school enrollment effects are biased upward. Following the previous literature on treatment effects under imperfect compliance (e.g., Imbens and Angrist, 1994), the 2SLS estimates of - should be interpreted as the local average treatment effects (LATE) of attending a magnet school on the academic outcomes for a subgroup of lottery winners who would not have attended magnet schools had they lost their lottery. Similar to the results of the ITT coefficient estimates, none of the 20 2SLS coefficients (estimated for the five outcome variables using four samples) is significant, suggesting no evidence of any significant effect of attending a magnet school on students' academic outcomes after controlling for selection via "back door" entry. Though statistically insignificant, the 2SLS estimates of the treatment effects on the HSEE test scores are negative for all of the four samples. The point estimates and standard errors of these four samples all allow me to reject a modest gain of 0.1 SD in HSEE test scores at the five percent level.
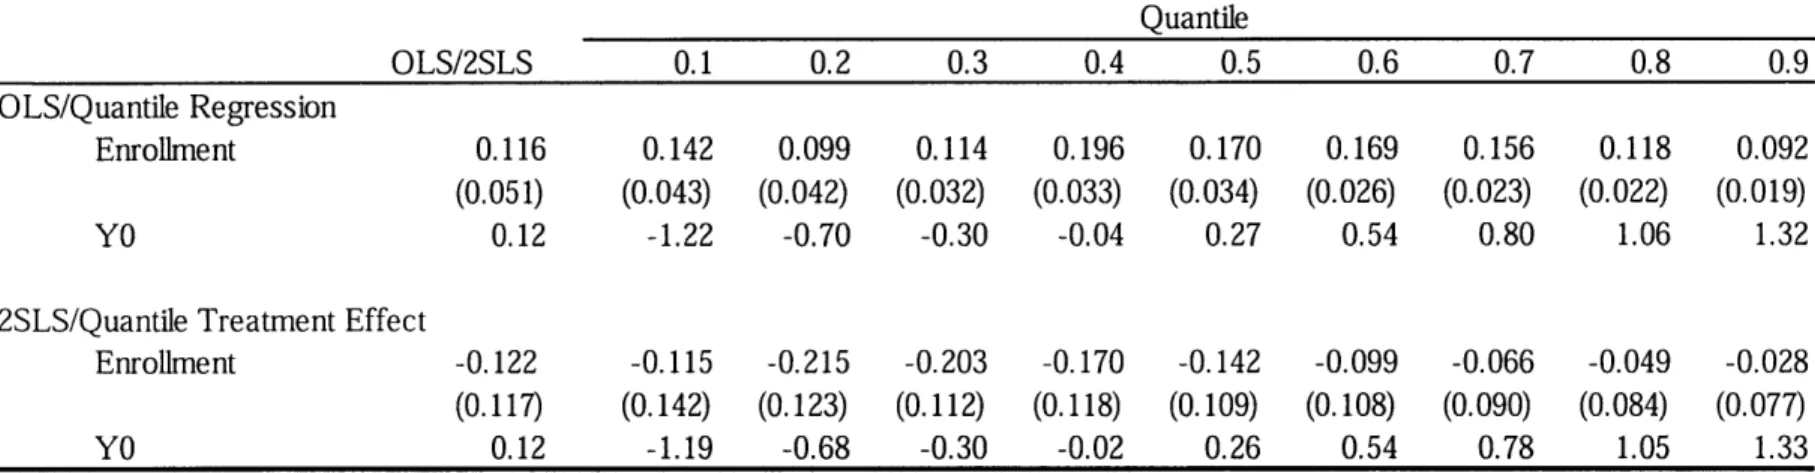
Table 1-6 shows the quantile regressions and the quantile treatment effects of attending a magnet school on students' HSEE test scores. The quantile regression indicates that applicants who attended a magnet school had higher HSEE test scores than those who did not for all deciles, with the gap by enrollment status around the median being larger than
that at the lower or upper tail. The quantile treatment effects are estimated using lottery status as an instrument based on the methodology presented in Abadie et al. (2002). There is some suggestive evidence that low-achieving students might have been worse off by attending these high-achieving magnet schools. But there is no evidence that students at the upper tail of the test score distribution benefited by attending these magnet schools.
1.6
Accounting for Differential Attrition
As discussed in Section 1.3, the outcome data are subject to a small degree of differential sample attrition between the winners and losers in the study. A small fraction of applicants
- who would have opted for schooling outside the North Bank had they lost their lottery
-were induced to enroll in the North Bank after winning their lottery. If the characteristics of these applicants (whose outcomes would be observed only if they had won their lottery) differed from those whose outcomes would be observed, irrespective of their lottery status, the main empirical results presented above would be biased.
In the following, I outline a framework using the easily analyzed difference in the means of the observed winner and loser samples to examine the magnitude and the likely sign of the potential biases in the estimated ITT effects due to the differential sample attrition. The framework is similar in spirit to earlier work on treatment effect analysis with missing outcomes (e.g., Manski, 1990; Lee, 2002).'4 Let Tli and Toi be the latent dummy variables denoting whether the outcome of an applicant is tracked when Di = 1 and Di = 0, re-'4The framework presented in the paper only considers the first-order issue of differential sample attrition between the lottery winners and losers and ignores the interaction between matching errors and differential sample attrition.
spectively. For example, Ti = 1 and Toi = 0 imply that the outcome would be tracked if Di = 1, but would not be tracked if Di = 0. Let Yli and Yoi be the potential outcomes of interest when Di = 1 and Di = 0, respectively. In practice, we observe (Yi, T, Di), where
T = Toi + (Tli - Toi)Di; Y = Yoi + (Yi - Yo)Dj if T = 1; and Y is missing if T = 0. Following the existing literature, I assume that winning a lottery has a monotone impact on sample selection.
Axiom 1 Winning a lottery, if it affects sample selection at all, only induce some individuals
who otherwise would drop out of the sample to stay in the sample, but not the opposite.
Ti > Toi
The monotonicity assumption excludes the possibility that an applicant would be induced to drop out of the sample because of winning a lottery, but still allows Pr(Tli = 1, Toi = 0) to be positive, i.e., some individuals might be induced to stay in the sample after winning a lottery. The difference between the means of the observed treatment and control groups can be expressed as:
E[YI ITi = 1] - E[Yol|To = 1] = E[YuI Toi = 1] Pr[Toi = 1ITj1 = 1] +
E[Yi~IT = 1, Toi = 0] Pr[Toi = 0ITui = 1] - E[YolToi = 1]
= E[Y~ - YoilToi = 1] + {E[YlIT = 1, Toi = 0] - E[YilToi = 1]} Pr[Toi = OIjT = 1]
parameter of interest (1
(1.8)
where the first component E[Yi -Yo IToi = 1] is the parameter of interest - the ITT effect of a
subpopulation whose outcomes would be observed, irrespective of their treatment assignment status - and the second component ( ,) is the bias of using the observed difference between
the tracked winners and losers (E[YI T Ti2 = 1] - E[Yo IToj = 1]) as an estimate of E[Y,
-Yoi Toi = 1].
Given the small degree of differential sample attrition (Pr[Toi = OITi = 1] . 3%), the bias of using the difference in the means of observed winners and losers as an estimate of the ITT effect of the Toi = 1 subpopulation is likely to be very small. In addition, I examine whether and to what extent the contamination group (Toi = 0, T12 = 1) differed from the
group of interest (Toi = 1) in terms of students' pre-lottery test scores for applicants from District 2. This is a highly relevant test, as students' ex post academic outcomes were highly correlated with their pre-lottery test scores (see Section 1.5.1). In order to conduct the comparison, I impose a second assumption:
Axiom 2 The unidentified sampling error in the pre-lottery test scores (xi) for the To, = 1
subpopulation is the same as the sampling error for the entire population (which is identified):
E[xziID = 1, Toi = 1] - E[xjID, = 0, Toi = 1] = E[xIDj = 1] - E[xjIDj = 0]
Table 1-7 shows that, among the observed winners, the contamination group (D =
1, Toi = 0, T1i = 1) had an average 6th grade test score that was 0.53 SD higher than the
average of the subpopulation of interest (Di = 1, Toi = 1), and the difference is statisti-cally significant. This indicates that the estimated ITT effects and the corresponding 2SLS estimates of the treatment effects are likely to be biased upward. The magnitude of the potential upward bias, however, is very small. Given the point estimate of the impact of
the pre-lottery test score on the HSEE test score (0.60) and the degree of differential sample attrition (0.03), the magnitude of the bias in the estimated ITT effect on the HSEE test scores is on the order of 0.01 SD (.53 x .60 x 03), a size that is almost negligible.
1.7
Parental School Choice
Given the high tuition cost and the lack of systematic academic benefits, why is competition for entry into these magnet schools so intense? One possibility is that parents and students may prefer these magnet schools for reasons other than academic performance, such as physical environments, classroom discipline, and peer behavior. Anecdotal evidence does indicate that magnet schools are superior in such nonacademic school attributes compared to neighborhood middle schools. Considering the rigorous exam-based high school admission in China, it is hence unlikely that Chinese parents choose magnet schools primarily out of concern for these nonacademic attributes of magnet schools.
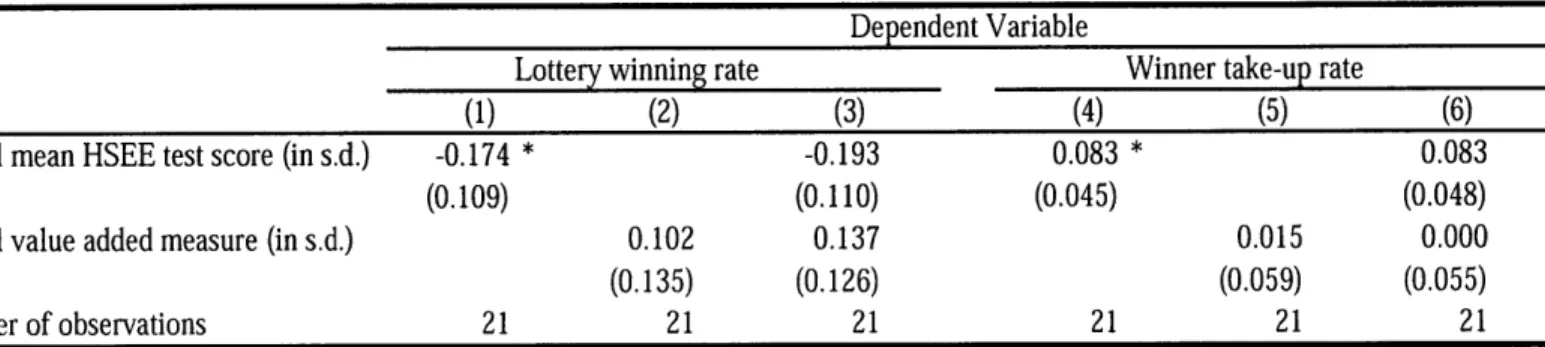
Another possibility is that parents place high value on average student achievement when choosing a school, either because they value peer quality beyond its effect on value added, or because they confuse average achievement with value added. Even though the empirical evidence cannot distinguish these two underlying reasons, either of them being true would lead schools to be sought for their observed student achievement. I construct two popularity measures for these magnet schools: lottery winning rates and winner take-up rates. Table 1-8 presents school-level mean statistics on the HSEE test scores (column 3), estimated value added effects (column 4), lottery winning rates (column 5), winner take-up rates (column 6), loser "back door" entry rates (column 7), and first-stage effects on enrollment (column
8) for all the eight magnet schools in the North Bank. Figures 1-4-A and 1-4-B show the two popularity measures plotted against schools' average HSEE test scores, respectively. Results demonstrate that the highly popular magnet schools are those with high student achievement on the HSEE, suggesting that parents might indeed use achievement measures to guide their school choice. Columns 1 and 4 in Table 1-9 report the OLS regressions of the lottery winning rates and the winner take-up rates on the average student achievement, respectively. The estimates confirm the results shown in Figures 1-4-A and 1-4-B. Columns 3 and 6 further show that the impact of average student achievement on school popularity remains marginally significant even after controlling for the value added measure I estimate for each magnet school.
One explanation is that parents may value peer quality beyond its effect on test scores. It could be that parents place high intrinsic weight on value added, but modest intrinsic weight on peer quality (beyond its effect on value added), in choosing a school. However, because value added effects are very imprecisely measured, while peer quality can be observed accurately, the high intrinsic weight on value added is swamped by the noisy measure, resulting in schools being chosen mainly for their observed peer quality.
Another explanation is that, given the lack of any reliable value added measure, parents may instead use the easily obtainable achievement measure as a proxy for value added (Figlio and Lucas, 2004). Using achievement to proxy for value added is not a big problem if the former is indeed a good proxy for the latter, i.e., the two measures are highly positively correlated. Figure 1-5 plots the estimated value added effects against schools' average HSEE test scores for these magnet schools and shows that the two measures are largely uncorrelated (with a correlation coefficient of 0.08). This echoes the previous finding of a weak correlation
between school grades and value added in the U.S. school accountability literature (see Kane and Staiger, 2002, for a survey). Figures 1-6-A and 1-6-B show the two popularity measures plotted against the estimated value added effects, respectively. If parents indeed preferred and were able to identify high value added schools, we would expect to see higher value added magnet schools to have lower lottery winning rates but higher take-up rates of lottery winners. Figure 1-6-A shows a positive correlation between lottery winning rates and schools' value added effects, opposite to what one would otherwise expect. Figure 1-6-B also shows little evidence that the take-up rates of lottery winners are higher for schools with higher value added - the correlation between the two measures is 0.07. These results are consistent with an explanation that parents using the easily obtainable achievement measure to proxy for value added fail to identify schools with higher value added when the quality of the proxy is poor.
1.8
Conclusion
This chapter evaluates the impact of attending a magnet school in China on student achieve-ment by exploiting random school admissions lotteries in Wuhan. Magnet school graduates had much higher HSEE test scores compared to those graduated from neighborhood middle schools. However, the cross-sectional superiority is likely to be spurious, largely attributable to student selection in lottery participation and "back door" entry, as well as the advance admission policy that favored the gifted and talented students. Despite that lottery winners had access to a better peer group, better qualified teachers, and a school of their choice (and hence might better suit their learning needs), I find little evidence that winning a lottery is
associated with any academic benefit to students. The point estimates of the two-stages least squares (2SLS) regressions of students' HSEE test scores on their magnet school enrollment status using lottery results as an instrument are all insignificant, and allow me to reject a modest gain of 0.1 standard deviation (SD) at the five percent level.
I find that magnet school popularity, measured by either the competitiveness of the admission lottery or the take-up rate of lottery winners, is highly positively correlated with the average student achievement, but largely unrelated to the treatment effect on student achievement that I estimate for each school. This evidence suggests that parents value peer quality beyond its effect on achievement gains, or confuse average student achievement
with value added. The finding that magnet schools are sought mainly for their observed superiority in average student achievement rather than for their academic value added casts doubt on the potential of school choice to improve student achievement, at least in this context.
Bibliography
[1] Alberto Abadie, Joshua Angrist, and Guido Imbens. Instrumental variable estimates of the effect of subsidized training on the quantiles of trainee earnings. Econometrica, 70(1):91-117, 2002.
[2] Joshua D. Angrist, Eric Bettinger, Erik Bloom, Elizabeth King, and Michael Kremer. Vouchers for private schooling in colombia: Evidence from a randomized natural exper-iment. American Economic Review, 92(5):1535-1558, 2002.
[3] Joshua D. Angrist, Eric Bettinger, and Michael Kremer. Long-term educational conse-quences of secondary school vouchers: Evidence from administrative records in colombia.
American Economic Review, 96(3):847-862, 2006.
[4] Martin Carnoy, Frank Adamson, Amita Chudgar, Thomas F. Luschei, and John F. Witte. Vouchers and Public School Performance. Economic Policy Institute, Washing-ton,DC, 2007.
[5] John Chubb and Terry Moe. Politics, Markets, and America's Schools. Brookings Institution Press, 1990.
[6] Julie Berry Cullen, Brian A Jacob, and Steven Levitt. The effect of school choice on participants: Evidence from randomized lotteries. Econometrica, 74(5):1191-1230,
2006.
[7] D. Figlio and C Rouse. Do accountability and voucher threats improve low-performing schools? Journal of Public Economics, 92:239-55, 2006.
[8] David N. Figlio and Maurice E. Lucas. What's in a grade? school report cards and the housing market. American Economic Review, 94(3):591-604, 2004.
[9] Milton Friedman. Capitalism and Freedom. University of Chicago Press, Chicago, 1962.
[10] Jay P. Greene, Paul E. Peterson, and Jiangtao Du. Effectiveness of School Choice: The Milwaukee Experiment. Education and Urban Society, 31:190-213, 1999.
[11] Justine S. Hastings, Thomas J. Kane, and Douglas O. Staiger. Parental preferences and school competition: Evidence from a public school choice program. Working Paper 11805, National Bureau of Economic Research, 2005. NBER Working Paper 11805.
[12] Justine S. Hastings, Thomas J. Kane, and Douglas O. Staiger. Preferences and het-erogeneous treatment effects in a public school choice lottery. Working Paper 12145, National Bureau of Economic Research, 2006.
[13] W. Howell, P. Wolf, D. Campbell, and P. Peterson. School vouchers and academic performance: Results from three randomized field trials. Journal of Policy Analysis and Management, 21(2):191-217, 2002.
[14] Caroline M. Hoxby. "does competition among public schools benefit students and tax-payers. American Economic Review, 90(5):1209-38, 2000.
[


![Table 1-8 School Level Statistics [a] District (2) 1 1 2 2 2 3 3 3 EstimatedMean HSEE value added](https://thumb-us.123doks.com/thumbv2/123dok_us/577896.2568852/48.918.120.794.347.610/table-school-level-statistics-district-estimatedmean-hsee-value.webp)