1
1 2 3
Frontoparietal action-oriented codes support novel task set
4
implementation
5 6
Carlos González-García*, Silvia Formica, David Wisniewski, and Marcel Brass
7
Department of Experimental Psychology, Ghent University, Belgium
8 9
*Corresponding author: Carlos González-García
10
2 Abstract
12
A key aspect of human cognitive flexibility concerns the ability to rapidly convert
13
complex symbolic instructions into novel behaviors. Previous research proposes
14
that this fast configuration is supported by two differentiated neurocognitive states,
15
namely, an initial declarative maintenance of task knowledge, and a progressive
16
transformation into a pragmatic, action-oriented state necessary for optimal task
17
execution. Furthermore, current models predict a crucial role of frontal and parietal
18
brain regions in this transformation. However, direct evidence for such
19
frontoparietal formatting of novel task representations is still lacking. Here, we
20
report the results of an fMRI experiment in which participants had to execute novel
21
instructed stimulus-response associations. We then used a multivariate
pattern-22
tracking procedure to quantify the degree of neural activation of instructions in
23
declarative and procedural representational formats. This analysis revealed, for the
24
first time, format-unique representations of relevant task sets in frontoparietal
25
areas, prior to execution. Critically, the degree of procedural (but not declarative)
26
activation predicted subsequent behavioral performance. Our results shed light on
27
current debates on the architecture of cognitive control and working memory
28
systems, suggesting a contribution of frontoparietal regions to output gating
29
mechanisms that drive behavior.
30 31
3 INTRODUCTION
32
Some of the most advanced collaborative human achievements rely on our ability
33
to rapidly learn novel tasks. Instruction following constitutes a powerful instance of
34
this ability as it combines the flexibility to specify complex abstract relationships
35
with an efficiency far superior to other forms of task learning such as trial and error,
36
or reinforcement learning. These unique characteristics make it a distinctive skill
37
that separates humans from other species1. While recent years have witnessed
38
substantial progress in our understanding of instruction following, the neural and
39
cognitive mechanisms underlying this rapid transformation of complex symbolic
40
information into effective behavior are still poorly understood. Specifically, a critical
41
question that remains unresolved is whether a declarative representation of task
42
information is sufficient or whether an additional representational state, closely
43
linked to action, precedes optimal performance.
44
Previous behavioral studies have consistently reported an intriguing signature of
45
instruction processing, namely, a reflexive activation of responses on the basis of
46
merely instructed stimulus-response (S-R) associations (defined as
“intention-47
based reflexivity”, or IBR). IBR occurs even when instructions are task-irrelevant
48
and have not been overtly executed before2–7, which suggests a rapid
49
configuration of instructed content predominantly towards action. Instruction
50
implementation also has a profound impact on brain activity, as shown by
51
electroencephalography and fMRI studies. In particular, the intention to execute an
52
instruction induces automatic motor activation8,9, engages different brain regions to
4 coordinate novel stimuli and responses10–14, and alters the neural code of the
54
encoded instruction15,16.
55
These and other findings propose a crucial role of a frontoparietal network (FPN) in
56
the instantiation of a highly efficient task readiness state11–17. Accordingly,
57
evidence coming from frontal patients18 and healthy participants10,15,19, as well as
58
prominent theoretical models20 support a serial coding hypothesis, a two-step
59
process in which the FPN first encodes instructed information into a primarily
60
declarative representation, that is, a persistent representation of the memoranda
61
conveyed by the instruction. Crucially, when this information becomes behaviorally
62
relevant, FPN declarative representations are transformed into an independent
63
state that is optimized for specific task demands20. This procedural state would
64
entail a proactive binding of relevant perceptual and motor information into a
65
compound representation that leads to the boost of relevant action codes related to
66
behavioral routines16.
67
However, evidence for such serial coding in control regions is lacking, primarily
68
due to the fact that previous analytical approaches were unable to track
69
representational formats of specific nature. Previous work thus identified some
70
properties of the FPN during the implementation of novel instructions, such as
71
enhanced decoding of stimulus category11,16, or altered similarity within
to-be-72
implemented S-R associations13,15, but failed to determine the functional state
73
underlying such representational effects. Therefore, currently, it cannot be
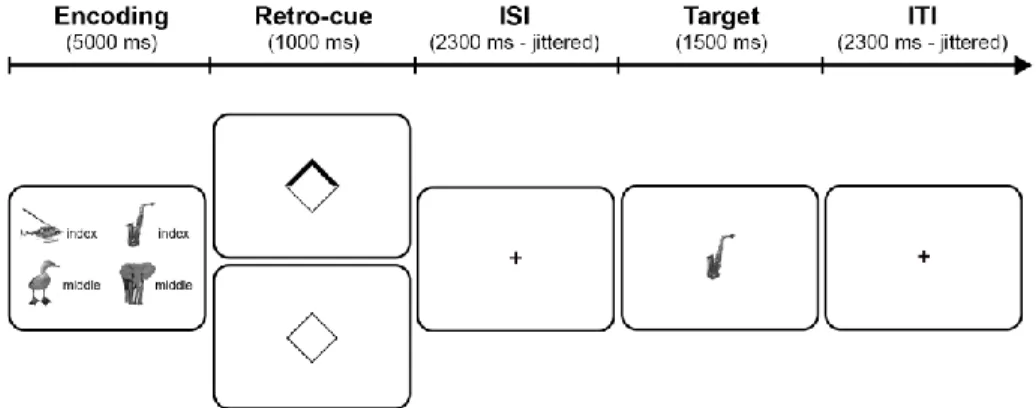
74
discerned whether novel task setting is achieved through the proposed
75
frontoparietal formatting. In fact, at least two alternatives to the serial coding
5 hypothesis could explain previous results. First, an amplification hypothesis
77
disputes the notion of two independent representational states and proposes that
78
the intention to implement rather induces deeper declarative processing of the
79
initial semantic information conveyed by the instruction2. Under this proposal, the
80
FPN would support instruction implementation through the preservation of relevant
81
declarative signals rather than through a transformation of these signals into an
82
action-oriented code. Last, an intermediate alternative concerns the possibility that
83
implementation involves both the boost of an independent action-oriented signal
84
and, additionally, the preservation of declarative representations. This dual-coding 85
hypothesis thus predicts that novel task implementation is supported by
non-86
overlapping declarative and procedural task representations in the FPN.
87
Here, we aimed at adjudicating between these three options. In the current study,
88
participants performed a task in which 4 novel S-R associations were presented at
89
the beginning of each trial (each S-R consisted of an image and a response finger;
90
for instance, the picture of a cat and the word “index”). After the encoding screen, a
91
retro-cue would select a subset of two S-Rs, prior to the onset of a target screen.
92
Target screens displayed the image belonging to one of the selected mappings (for
93
example, a picture of a cat), prompting participants to execute the associated
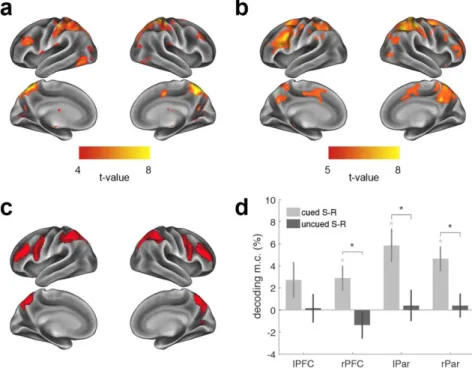
94
response (Fig. 1). Based on recent experimental results7,21,22 and theoretical
95
models of working memory (WM)23, we assumed that retro-cues (i.e. cues that
96
signal the relevance of one of the already encoded representations in WM) would
97
prioritize relevant S-R associations into a behavior-optimized state, akin to
98
implementation. As such, retro-cues served as a tool to locate in time the moment
6 after initial encoding in which implementation-specific signals should be magnified.
100
Our primary goal was to capture which signals governed FPN activity during such
101
implementation stage, prior to execution20. To discern the hypothesized procedural
102
and declarative traces, we had participants perform two functional localizers that
103
encouraged either a declarative or action-oriented maintenance of novel
104
instructions. Using data from the localizers, we derived a canonical multivariate
105
pattern of activity for each S-R in both declarative and procedural formats. We then
106
assessed the extent to which these traces were independently activated in the
107
main task, during the implementation stage.
108
We first predicted that the intention to implement would boost the representation of
109
retro-cued S-R associations in the FPN, compared to encoded but not cued S-Rs.
110
We then tested whether this representational boost reflected the activation of the
111
relevant S-R in two unique formats, namely, declarative and procedural. If so, this
112
would indicate the extent to which multiple, non-overlapping representations of the
113
same instructed content underlie novel task setting.
114 115
RESULTS
116
Task set prioritization enhances instruction execution
117
Twenty-nine healthy human participants (mean age = 23.28, 17 females; 3 more
118
participants were excluded after data acquisition, see Methods) were shown 4
119
novel S-R associations at the beginning of each trial. Importantly, even though
120
specific S-R associations were presented only once throughout the experiment,
7 they could be grouped in categories depending on the specific combination of
122
stimulus and response dimensions (for instance, “animate item and index finger
123
response”; see Methods for a full description of S-R categories). Immediately after
124
the encoding screen, a retro-cue signaled the relevance of two specific mappings
125
(informative retro-cues in 75% of trials; in the remaining trials a neutral retro-cue
126
did not select any mapping). The two selected mappings always belonged to the
127
same S-R category, although the specific associations remained unique. Such
128
grouping was crucial for analysis purposes since it allowed us to identify the
129
selected, unselected, and not presented S-R categories on each trial. After the
130
retro-cue, a target image prompted participants to provide the corresponding
131
response (Fig. 1). To ensure that participants encoded all 4 S-R associations, ~6%
132
of trials (regardless of the retro-cue validity) displayed a new, catch image,
133
prompting participants to press all four available buttons simultaneously.
134
135
Figure 1. Behavioral paradigm. On each trial, participants first encoded four novel
136
S-R mappings consisting in the association between an (animate or inanimate)
8 item and a response (index or middle fingers; response hand defined by the
138
position of the mapping on the screen; e.g. “helicopter-index” on the left-hand side
139
of the screen requested participants to press the left index if the target screen
140
displayed a helicopter). After the encoding screen, an informative retro-cue (75%
141
of the trials) signaled the relevance of two of the mappings. In the remaining 25%
142
of trials, a neutral retro-cue appeared, and none of the mappings were cued. Last,
143
after a jittered retro-cue-target interval, a target stimulus prompted participants to
144
provide the associated response (in this example, “right index” finger press).
145 146
Analysis of participants’ behavioral performance revealed that retro-cues helped
147
participants in prioritizing novel S-Rs. Specifically, participants were faster (t28,1 =
148
13.51, p < 0.001, Cohen’s d = 2.51; Fig. 2a) and made less errors (t28,1 = 7.96, p <
149
0.001, Cohen’s d = 1.47; Fig. 2b, left panel) in trials with informative retro-cues,
150
compared to neutral.
151
9 Figure 2. Behavioral results. (a) Reaction times in neutral and informative
retro-153
cue trials. (b) Error rates in neutral, informative, and catch trials. The thick line
154
inside box plots depicts the second quartile (median) of the distribution (n = 29).
155
The bounds of the boxes depict the first and third quartiles of the distribution.
156
Whiskers denote the 1.5 interquartile range of the lower and upper quartile. Dots
157
represent individual subjects’ scores. Grey lines connect dots corresponding to the
158
same participant in two different experimental conditions.
159 160
Identifying task set prioritization activity
161
As a first step, we investigated which brain regions were predominantly involved in
162
instruction prioritization. Our intuition was that prioritization would boost
163
implementation signals and, as such, we expected a frontoparietal network to be
164
particularly crucial, as it is usually involved in the implementation of novel task
165
sets11,14–17,24. We thus established a set of a priori candidate regions that
166
encompassed frontal (inferior and middle frontal gyri) and (inferior and superior)
167
parietal cortices (see Fig. 3c, and the Region-of-interest definition section in the
168
Methods). We then performed two whole-brain analyses to find regions sensitive to
169
task set prioritization (defined as informative vs. neutral retro-cues) in their overall
170
activation magnitude or voxel-wise activity patterns, using a general linear model
171
(GLM) and multivariate pattern analysis (MVPA), respectively. First, we found that
172
informative retro-cues elicited significantly higher activity in regions of the FPN,
173
including the inferior and middle frontal gyri, inferior and superior parietal cortices,
174
as well as regions outside the FPN, such as the lateral occipital cortex (Fig. 3a,
10 primary voxel threshold [p < 0.001 uncorrected] and cluster-defining threshold
176
[FWE p < .05]). Furthermore, a searchlight decoding analysis25 revealed that the
177
FPN contained information in its patterns of activity about the prioritization status
178
(Fig. 3b, primary voxel threshold [p < 0.0001 uncorrected] and cluster-defining
179
threshold [FWE p < .05]; see also Methods for details on how this analysis
180
controlled for univariate differences in activity magnitude). Overall, the resulting
181
statistical maps of these two analyses roughly overlap with the set of a priori
182
defined regions of interest (ROIs; Fig. 3C), confirming the involvement of the FPN
183
in task set prioritization.
184
To test our hypothesis that implementation would boost the representation of
retro-185
cued S-R categories, we performed two similar decoding analyses in the 4 FPN
186
ROIs. First, we tested if in the moment of the retro-cue the patterns of activity in
187
these four regions carried information about the category of the cued S-R. We
188
found significant category decoding in the right PFC and bilateral parietal ROIs
189
(one-sample t-tests against chance level, all ps < 0.013, FDR-corrected for multiple
190
comparisons), and close to significance decoding in the left PFC (t25,1 = 1.69, p =
191
0.052). Next, we tested the extent to which the FPN also carried information about
192
the encoded, but not cued category. In contrast with the previous results, decoding
193
did not reach significance in any of the ROIs (all ps > 0.6). Finally, we directly
194
compared the decoding accuracies for the cued and uncued categories. This
195
analysis revealed significantly stronger decoding of the cued category compared to
196
the uncued one in right PFC and bilateral parietal cortices (paired t-tests, all ps <
197
0.034, FDR-corrected; Fig. 3d).
11
199
Figure 3. Task set prioritization induced changes in frontoparietal neural activity.
200
(a) GLM contrast of informative > neutral retro-cue trials. Warm colors show
201
regions with significantly higher activity magnitude during informative compared to
202
neutral retro-cues (primary voxel threshold [p < 0.001 uncorrected] and
cluster-203
defining threshold [FWE p < .05]). (b) Searchlight decoding of prioritization
204
(informative vs. neutral retro-cue). Warm colors show regions with significant
205
decoding (primary voxel threshold [p < 0.0001 uncorrected] and cluster-defining
206
threshold [FWE p < .05]). (c) Set of regions-of-interest defined prior to analyses,
207
encompassing frontal (inferior and middle frontal gyri) and (inferior and superior)
208
parietal cortices. (d) Mean S-R category decoding (minus chance) within each
209
region of interest. Error bars denote between-participants s.e.m. Grey asterisks
210
denote significant decoding (chance level = 25%, one-sample t-test,
12 corrected). Black asterisks denote significantly higher decoding of cued compared
212
to uncued S-R categories (paired t-test, FDR-corrected).
213 214
Tracking format-unique task set patterns
215
Altogether, these results show that instruction implementation has a profound
216
impact on FPN activity, boosting the representation of prioritized task sets over
217
encoded, but irrelevant ones. However, similarly to previous studies, they are
218
agnostic regarding the nature of the signals underlying such effect. The main goal
219
of our study was to test the extent to which, during this implementation stage,
220
relevant task information was represented in a declarative and/or procedural
221
format. In a first scenario (amplification hypothesis), implementation would merely
222
preserve relevant declarative information. Alternatively, it could transform the initial
223
representation of task information into a primarily action-oriented format (serial
224
coding hypothesis). Last, action-oriented representations could coexist with
225
preserved declarative representations (dual coding hypothesis). To adjudicate
226
between these options, we implemented a canonical template tracking procedure
227
that allowed us to estimate the degree of neural activation of specific S-R
228
categories under the two functional formats of interest (see Figure 4, for a visual
229
representation of the procedure). To do so, for each subject, we first obtained
230
whole-brain templates of each S-R category in procedural and declarative formats,
231
using data from two functional localizers. Subsequently, we estimated the extent to
232
which these two traces governed the data of the main task, specifically during the
233
presentation of informative retro-cues. We performed this step in an ROI-based
13 fashion. For each ROI and trial type, we extracted the pattern of activity during the
235
retro-cue, keeping track of which S-R categories were either cued, uncued, or not
236
presented in that trial. Then, we computed the semi-partial correlation between this
237
pattern of activity and the declarative and procedural templates of each S-R
238
category. Importantly, we used semi-partial correlations as they allowed us to
239
estimate the amount of shared variance between task data and a given template
240
(e.g. S-R category 1 in procedural state) that is not explained by the same
241
template in the alternative state (e.g. S-R category 1 in declarative state).
242
Therefore, processes common to both localizers (e.g. arousal, domain-general
243
attention and/or task preparation) cannot inflate correlations, and any significant
244
result rather reflects the activation of S-R information in a specific format during the
245
main task.
14
247
Figure 4. Schematic of the canonical template tracking procedure. For each region
248
of interest, we extracted the pattern of activity of specific S-R categories during
249
informative retro-cues (upper panel, in yellow) and computed similarity with
250
canonical templates of such categories in declarative (bottom left, in blue) and
251
procedural (bottom right, in green) formats, obtained in two separate localizers.
252
Importantly, similarity was assessed via semi-partial correlations, obtaining the
253
proportion of uniquely shared variance between task and template data (middle,
254
Venn diagram) of the cued, uncued and not-presented S-R categories. Graphs
255
represent a hypothetical set of results, in which implementation recruits
non-256
overlapping procedural and declarative representations of cued S-R category. This
15 informational boost, relative to baseline (not-presented S-R categories), is superior
258
to that of the uncued category.
259 260
To validate this procedure outside the FPN, we created an ROI comprising the
261
primary motor cortex, since predictions for this regions were straightforward: (1)
262
boost of action-oriented information of the cued S-R category, compared to the
263
uncued and not-presented ones; and (2) no boost of declarative information. The
264
results obtained (Fig. 5) matched the predictions, revealing a specific
265
enhancement of procedural information of the cued category compared to the
266
uncued (t25,1 = 4.08, p < 0.001, Cohen’s d = 0.80), and critically, to the empirical
267
baseline defined by the not-presented categories (t25,1 = 5.45, p < 0.001, Cohen’s d
268
= 1.07). No reactivation of the uncued S-R category was found (t25,1 = 1.32, p =
269
0.2, Cohen’s d = 0.26). As predicted, no differences between cued, uncued and
270
baseline categories were found in declarative signals (all ts < 1.53, all ps > 0.14).
271
272
Figure 5. Template tracking procedure results in the primary motor cortex. Bars
273
represent the normalized semi-partial correlation between task data and the
16 procedural and declarative templates of cued, uncued and not presented S-R
275
categories. Error bars denote within-participants s.e.m26. Asterisks denote
276
significant differences (p < 0.05, paired t-test).
277 278
Declarative and procedural representations in frontoparietal cortices (and
279
beyond)
280
To elucidate which signals govern implementation in control-related regions, we
281
carried out the template tracking procedure on each FPN region separately.
282
Furthermore, we decided to include the ventral visual cortex (VVC) in this analysis
283
to explore the effect of implementation in higher-order visual regions, since these
284
have been consistently shown to be involved in instruction processing11,13,14,16.
285
This analysis (Fig. 6a) revealed that all FPN regions contain unique action-oriented
286
information of relevant S-R categories during the presentation of the retro-cue
287
(two-tail paired t-test against empirical baseline [not-presented rules], all ts > 2.16,
288
all ps < 0.04, all Cohen’s d > 0.42). Critically, procedural information of cued
289
categories was significantly more activated than uncued categories (all ts > 2.26,
290
all ps < 0.04, all Cohen’s d > 0.44). Regarding declarative information (Fig. 6b),
291
parietal nodes of the FPN showed a specific enhancement of declarative
292
information of the cued S-R category, compared to the uncued one (ts > 2.16, all
293
ps < 0.02, all Cohen’s d > 0.49), whereas no significant differences were found in
294
the right (t = 1.24, p = 0.28) and left (t = 2.05, p = 0.051) frontal nodes. To assess
295
the reliability of these not significant findings, we performed Bayesian paired t-tests
17 with the same factors as before. The BF10 (evidence in favor of H1 against
297
evidence for H0) for the Cued – Not presented comparison was 0.27 and 0.24 for
298
the left and right frontal nodes, respectively. Similarly, the comparison Cued –
299
Uncued yielded a BF10 = 1.25 in the left frontal node, and a BF10 = 0.41 in the right
300
frontal node. Overall, this constitutes moderate evidence27 for the null hypothesis
301
that declarative information of the cued category was not specifically enhanced in
302
frontal regions.
303
Last, higher-order visual regions showed a similar pattern to parietal nodes of the
304
FPN, with significant enhancement of both procedural (t = 6.19, p < 0.001, Cohen’s 305
d = 1.21) and declarative (t = 5.84, p < 0.001, Cohen’s d = 1.15) information of the
306
cued S-R category, compared to the uncued one.
307
308
Figure 6. Canonical template tracking procedure results in frontoparietal cortices
309
and ventral visual cortex. Bars represent the normalized semi-partial correlation
310
between task data and (a) the procedural and (b) declarative templates of cued
311
and uncued S-R categories, relative to empirical baseline (not-presented S-Rs).
312
Error bars denote within-participants s.e.m. Gray asterisks denote a significant
18 increase from baseline (p < 0.05, paired t-test, FDR-corrected). Black asterisks
314
denote significant differences between cued and uncued categories (p < 0.05,
315
paired t-test, FDR-corrected). (c) Across-participant correlation of Inverse
316
Efficiency Scores and procedural activation index in frontoparietal cortices. (d)
317
Correlation of Inverse Efficiency Scores with declarative activation index in
318
frontoparietal cortices. In c and d, dots represent individual participants, thick lines
319
depict the linear regression fit, and asterisks denote significant Pearson’s
320
correlation (p < 0.05).
321 322
Action-oriented codes support novel task setting
323
What might be the behavioral relevance of declarative and procedural signals? We
324
reasoned that if action-oriented representations are boosted during implementation
325
in control-related regions, and implementation can be conceived as a
behavior-326
optimized state, then the degree of action-oriented activation should predict the
327
efficiency of instruction execution. To test this hypothesis, we first converted RTs
328
and error rates of informative retro-cue trials into a single compound measure
329
(Inverse Efficiency Scores; IES. IES were obtained by dividing each participant’s
330
mean RT by the percentage of accurate responses28). Then, we derived a
331
template activation index by subtracting the degree of activation of cued categories
332
to that of uncued categories for each region and format (procedural and
333
declarative). Finally, we correlated individual IES with the activation indices on
334
each region of the FPN. This analysis revealed significant negative correlations in
335
all FPN regions between IES and procedural activation (all Pearson’s rs > -0.475,
19 all ps < 0.02). In contrast, IES did not correlate with declarative activation in any
337
region (all rs < -0.34, all ps > 0.09). When averaging activation indices across FPN
338
regions, an identical pattern was found, namely, a significant correlation of IES with
339
procedural (r = -0.679, p < 0.001) but not declarative (r = 0.06, p = 0.77) activation
340
(Fig. 6c-d). Similar results were obtained when using RTs (procedural: r = -0.67, p
341
< 0.001; declarative: r = 0.076, p = .71) and error rates (procedural: r = -0.54, p =
342
0.004; declarative: r = -0.019, p = 0.93) as behavioral measures. Altogether, these
343
results show that the more the FPN represented procedural information of relevant
344
S-Rs, the faster and more accurate participants executed the instruction. In
345
contrast, the strength of declarative signals of the same S-R association did not
346
predict behavioral performance.
347 348
DISCUSSION
349
In the current study, we report a pervasive effect of novel task sets implementation
350
across behavioral and neural data. Our results provide support for a frontoparietal
351
dual coding of instructed task information. A canonical template tracking procedure
352
revealed the boost of unique declarative and procedural representations in the
353
FPN, prior to execution. This boost was specific to prioritized S-Rs and did not
354
happen for irrelevant mappings. Critically, our results show that procedural (but not
355
declarative) activation in the FPN predicted efficient execution of novel instructions.
356
Frontoparietal flexible coding of relevant task sets
20 Previous research has highlighted the important role of the FPN in the
358
implementation of novel instructions10–16,29. Accordingly, our results show that FPN
359
involvement during implementation reflects the boost of relevant S-R categories.
360
However, these results remain agnostic regarding the nature of the signals
361
underlying this effect. In principle, as proposed by the serial-coding hypothesis,
362
they could reflect the emergence of procedural representations, in detriment of
363
merely declarative signals16,20. However, the same pattern of results could be
364
explained by a mere amplification of preserved declarative representations2. Last,
365
the results could reflect both declarative preservation and procedural activation, as
366
predicted by a dual-coding hypothesis. Using a canonical template tracking
367
analysis we were able to adjudicate between these options and, for the first time,
368
obtain evidence in favor of the dual coding hypothesis. As such, our results show
369
that implementation engages independent procedural and declarative
370
representations of relevant task information in the FPN.
371
A first consideration concerns the exact nature of the reactivated signals. In the
372
declarative localizer, participants had to remember specific S-R associations and
373
match them to another S-R probe. In contrast, in the procedural localizer,
374
participants’ goal was to execute the correct response associated with a target
375
stimulus. The different readout from WM thus encouraged different strategies, as
376
suggested by previous studies3,7,16. Therefore, it is conceivable that templates will
377
contain unique information: a persistent maintenance of the memoranda in the
378
declarative localizer, and a proactive action-oriented representation, in the
379
procedural localizer. However, templates likely share further information, for
21 instance, related to specific perceptual stimulation and general-domain processes,
381
such as arousal or attention. We took several measures to reduce the influence of
382
information not specifically related to declarative or procedural components. First,
383
template reactivation was derived from semi-partial correlations between data from
384
the main task and the localizers. Thus, our measure reflects unique shared
385
variance between the task and the representation of an S-R category in a given
386
localizer, partialling out the variance explained by the representation of the same
387
S-R in the remaining localizer. Shared variance between both localizers and the
388
main task could induce spurious similarity increases. For instance, domain-general
389
selective attention is likely engaged towards selected mappings in the main task,
390
as well as during the preparation interval of the localizers. Such a scenario would
391
inflate the correlations between the templates of the cued S-R associations and the
392
data from the main task, potentially leading to a significant difference from
393
baseline. In contrast, semi-partial correlations ensured that procedural and
394
declarative activation indices were derived from non-overlapping signals. Second,
395
templates were built for S-R categories rather than unique mappings, and therefore
396
a contribution of perceptual features to template reactivation seems unlikely.
397
Moreover, semi-partial correlations were computed between data from the
retro-398
cue screen (in the main task), and inter-stimulus interval (in the localizers), which
399
reduces the likelihood of significant correlations due to perceptual similarity
400
between templates and specific S-Rs. Therefore, we believe it is the most
401
straightforward interpretation to consider that our procedure succeeded at tracking
402
specific declarative and procedural signals, as also hinted by the validation results
22 in the motor cortex. From this standpoint, our results suggest that during task set
404
implementation, FPN regions can maintain the declarative memoranda conveyed
405
by the instruction and, simultaneously, an independent action-oriented S-R code
406
that primarily drives task execution.
407
Heterogeneous task set coding within the FPN
408
Although we did not have specific hypotheses for the role of individual FPN
409
regions, a second important finding concerns the heterogeneity of results within
410
this network. Whereas parietal nodes carried both procedural and declarative
411
information in their patterns of activity, only action-oriented representations were
412
found in frontal nodes. Given the overall low signal-to-noise ratio and pattern
413
reliability in prefrontal cortices30, one potential interpretation could be that slight
414
differences inherent in the templates could affect the reactivation measures. For
415
instance, it could be argued that signal quality of procedural templates in frontal
416
nodes is intrinsically higher than that of declarative templates, which in turn might
417
induce a lack of power to detect the reactivation of declarative templates in the
418
same regions during the task. To rule out these concerns, and inspired by previous
419
studies using similar canonical template tracking procedures31, for each template
420
and region of the FPN, we compared the signal-to-noise ratio (computed as mean
421
t-value across voxels of the ROI divided by the standard deviation), informational
422
content (computed as Shannon entropy) and correlationability of the templates (i.e.
423
the degree to which individual templates correlated with other templates from the
424
same localizer). This analysis revealed that procedural and declarative FPN
425
templates did not differ in any of these measures (Supplementary Table 1).
23 Thus, our results suggest, first, that prefrontal representations carry action-oriented
427
information during instruction following. This is line with previous studies that
428
propose a crucial role of the frontolateral cortex in the integration of stimulus and
429
response information into a task set based on verbal instructions12,32,33, as well as
430
in representing task rules17,24 and goals34. In contrast, parietal cortices contained
431
both declarative and procedural information of relevant S-Rs. Whereas the role of
432
parietal regions in representing goals and task set information is widely
433
acknowledged11,13,16,17,24,34,35, it is unclear what drives such declarative activation.
434
One possibility is that it reflects a category-specific top-down selection scheme,
435
driven by increased attention towards the cued S-R36,37. The fact that a similar
436
pattern was found in higher-order visual regions, which usually coordinate with
437
parietal cortices to represent relevant task dimensions in anticipation of future
438
demands38–40, further supports this possibility. This tentative interpretation would
439
be coherent with goal neglect effects reported in patients with frontal lobe
440
damage18. These patients are capable of selecting, maintaining, and remembering
441
task-relevant information, yet their ability to transform relevant information into
442
goal-driven actions is impaired. Such dissociation goes at least partially in line with
443
our results in that (1) prioritization of goal-oriented representations depends
444
critically on prefrontal cortices (impaired in goal neglect patients), and (2) the
445
involvement of other control-related regions, intact in these patients, boosts the
446
declarative representation of specific task information, such as particular S-R
447
categories, presumably in coordination with posterior category-selective regions.
448
Implementation as a selective output gating process
24 Remarkably, despite both signals coexisted in the FPN during implementation, only
450
procedural representations predicted efficient behavior. The fact that
451
implementation is signaled by retro-cues renders this effect relevant to current
452
debates on information prioritization and WM architecture. In this regard, our
453
results are consistent with the notion of an output gating mechanism. Similar to the
454
idea of an input gate that limits what information enters WM, some computational
455
models propose an additional gate that determines which pieces of this information
456
will drive behavior41. Recent theoretical frameworks suggest a role of prioritization
457
not only in selecting relevant content from WM but also in reformatting such
458
content into a “behavior-guiding representational state”23, analogous to an output
459
gating mechanism. Interestingly, these models propose that whereas other
control-460
related regions might be involved in attention-driven representations of relevant
461
content, frontal regions are thought to be especially important in transferring this
462
content into a state that is optimal for behavior. In line with these ideas, we show
463
that an action-oriented representation of task sets dominates activity in frontal
464
cortices and that this representational format, and not a declarative one, is tightly
465
linked to behavioral efficiency. Importantly, our results reveal, first, that the neural
466
substrate of task set prioritization involves further brain regions, such as
category-467
selective and parietal cortices. Second, action-oriented representations might
468
coexist with declarative-like information in some of these regions. It should be
469
noted, however, that fMRI data lacks the temporal resolution to discern whether
470
these two signals fully overlap in time or whether action-oriented,
behavior-471
optimized representations emerge after declarative information of relevant task
25 sets has been prioritized. Future studies should employ time-resolved techniques
473
that can succeed at characterizing the dynamical contribution of different brain
474
regions to separate control and WM processes42.
475
In summary, the present study reveals the strong impact of novel task setting in
476
frontoparietal regions. Following task prioritization, we observed a boost in
477
information of the relevant S-R category in detriment of the irrelevant ones. This
478
boost was accompanied by the activation of two non-overlapping neural codes in
479
the FPN, one reflecting the declarative maintenance of task, and another, more
480
pragmatic, action-oriented coding of the instruction. Importantly, only this
481
procedural activation predicted behavioral performance. Altogether, our results
482
support the idea that novel instructed content can be represented in multiple
483
formats, and highlight the contribution of frontoparietal regions to output gating
484
mechanisms that drive behavior.
485 486
METHODS
487
Methods are reported, when applicable, in accordance with the Committee on Best
488
Practices in Data Analysis and Sharing (COBIDAS) report43.
489
Participants 490
Thirty-two participants (mean age = 23.16, range = 19-33; 20 females) recruited
491
from the participants’ pool from Ghent University participated in exchange of 40
492
euros. They were all right-handed (confirmed by the Edinburgh handedness
493
inventory), clinically healthy and MRI-safe. The study was approved by the UZ
26 Gent Ethics Committee and all participants provided informed consent before
495
starting the experiment. Of the initial 32 participants, 3 were excluded after
496
acquisition (1 participant performed at chance during the task; 1 participant had an
497
error rate of 1 in catch trials (see below); 1 participant’s within-run head movement
498
exceeded voxel size), resulting in a final sample of 29 participants. Due to an
499
incomplete orthogonalization of the cued and uncued S-R categories, the first three
500
participants were excluded from multivariate analyses (n = 26).
501
Materials 502
S-R associations were created by combining images with words that indicated the
503
response finger. Each S-R association was presented just once during the entire
504
experiment to prevent the formation of long-term memory traces6. Given this
505
prerequisite, images of animate (non-human animals) and inanimate (vehicles and
506
instruments) items were compiled from different available databases44–48, creating
507
a pool of 1550 unique pictures (770 animate items, 780 inanimate). To increase
508
perceptual similarity and facilitate recognition, the background was removed from
509
all images, items were centered in the canvas, and images were converted to
510
black and white.
511
The response dimension was defined by the combination of a word (“index” or
512
“middle”) and the position of the mapping in the encoding screen. For instance, if
513
an S-R pair containing the word “index” was displayed on the left-hand side of the
514
screen, this informed participants that the correct response associated with that
515
particular stimulus would be “left index”. This allowed us to have 2 mappings on 516
27 screen that involved the same response category (e.g. index finger) but different
517
effectors (e.g. left index finger vs right index finger).
518
The combination of the 2 stimulus dimensions (animate/inanimate items) and the 2
519
response dimensions (index/middle finger) lead to 4 S-R categories: Category 1
520
(animate-index), Category 2 (inanimate-index), Category 3 (animate-middle), and
521
Category 4 (inanimate-middle). Although images were always unique and therefore
522
the specific image-finger mapping changed on every trial, S-R associations were
523
grouped into these 4 categories for analysis purposes.
524
Task and design specifications 525
Each trial started with an encoding screen (5000 ms) that displayed 4 S-R
526
associations. The two mappings on the upper half of the encoding screen
527
belonged to one S-R category, and the other two belonged to another S-R
528
category. Immediately after the encoding screen, a retro-cue appeared. Informative
529
retro-cues (75% of trials) consisted of an arrow centered in the middle of the
530
screen pointing either upwards or downwards. Therefore, informative retro-cues
531
did not select a specific S-R mapping but rather two mappings belonging to the
532
same S-R category (e.g. “animate - index finger”). Neutral retro-cues did not select
533
any mapping. The retro-cue was displayed for 1000 ms and was followed by a
534
fixation point (cue-target interval; CTI), which duration was jittered following a
535
pseudo-logarithmic distribution (mean duration = 2266 ms, SD = 1276 ms, range =
536
[600-5000]). Directly after the CTI, a target was on screen for 1500 ms. Target
537
screens displayed the image belonging to one of the selected mappings, prompting
538
participants to execute the associated response by pressing the corresponding
28 button in an MRI-compatible button box. In neutral trials, the target could be the
540
stimulus of any of the 4 S-R encoded mappings. Additionally, in ~6% of trials, a
541
catch target appeared. This consisted of a new image, different from any of the
542
encoded stimuli, to which participants had to answer by pressing the 4 available
543
buttons in the response box. Catch trials were included to ensure that participant
544
encoded all four S-R associations. Last, after the target screen, a fixation point was
545
shown between trials (inter-trial interval, ITI) for a jittered duration (following the
546
same parameters as the CTI jitter). Each trial lasted on average 12 seconds.
547
The main task was divided into 4 runs. Each run contained 51 trials (48 regular and
548
3 catch trials). Of the 48 regular trials, 75% contained an informative retro-cue, and
549
the remaining trials displayed neutral retro-cues. The S-R categories selected and
550
unselected by the retro-cue were fully counterbalanced, resulting in 36 trials per
551
category across the entire experiment. For instance, there were 36 trials in which
552
Category 1 mappings were selected by the retro-cue. Of these 36 trials, in one
553
third, the unselected mappings (that is, mappings shown in the encoding screen
554
but not selected by the retro-cue) belonged to Category 2, another third to
555
Category 3, and the last third to Category 4. Each run lasted around 10 minutes,
556
and the main task, containing 204 trials, lasted around 40 minutes in total. Prior to
557
the main task, outside of the scanner, participants performed a practice session
558
with trials following the same structure described above with the exception that
559
feedback was included to help familiarization. The practice session was structured
560
in blocks of 11 trials. Participants performed these blocks until they achieved at
29 least 9 correct responses. S-R mappings used during the practice were never used
562
again.
563
After the main task, participants performed two localizer tasks aimed at obtaining a
564
canonical representation of each S-R category in the two formats of interest
565
(declarative and procedural). The structure of the task was almost identical in the
566
two localizers and was designed to encourage either implementation or
567
memorization strategies. In both localizers, trials started with an encoding screen
568
(2000 ms) that contained two mappings of the same S-R category, followed by an
569
inter-stimulus interval of jittered duration (same parameters as in the main task).
570
Last, a target screen appeared (1500 ms) followed by a jittered ITI. The target
571
screen differed in the two localizers and was inspired by previous studies
572
investigating the dissociation of implementing vs. memorizing new instructions2,3,16.
573
In the procedural localizer, the target was identical to the one in the main task. It
574
consisted of a single image that prompted participants to execute the associated
575
response. The declarative localizer, in contrast, displayed a memory probe
576
consisting of one image and one response finger. Participants were trained to
577
answer whether the displayed mapping was correct (same association as the
578
encoded one) or incorrect (different association) by pressing both left-hand buttons
579
(when “correct”) or both right-hand buttons (when “incorrect”). Therefore, in the
580
memorization localizer, participants never had to prepare to execute the encoded
581
mapping but rather just maintain its information. As in the main task, catch trials
582
consisted of new images, to which participants had to respond by pressing all 4
583
available buttons. Each trial lasted around 8 s on average, and each localizer
30 contained 66 trials (15 per rule + 6 catch trials), resulting in a total of 9 minutes per
585
localizer.
586
All tasks were presented in PsychoPy 249 running on a Windows PC and
back-587
projected onto a screen located behind the scanner. Participants responded using
588
an MRI-compatible button box on each hand (each button box contained two
589
buttons, on which participants placed their index and middle fingers).
590
Data acquisition and preprocessing 591
Imaging was performed on a 3T Magnetom Trio MRI scanner (Siemens Medical
592
Systems, Erlangen, Germany), equipped with a 64-channel head coil. T1 weighted
593
anatomical images were obtained using a magnetization-prepared rapid acquisition
594
gradient echo (MP-RAGE) sequence (TR=2250 ms, TE=4.18 ms, TI=900 ms,
595
acquisition matrix=256 × 256, FOV=256 mm, flip angle=9°, voxel size=1 × 1 × 1
596
mm). Moreover, 2 field map images (phase and magnitude) were acquired to
597
correct for magnetic field inhomogeneities (TR=520 ms, TE1=4.92 ms, TE2=7.38
598
ms, image matrix=70 x 70, FOV=210 mm, flip angle=60°, slice thickness=3 mm,
599
voxel size=3 x 3 x 2.5 mm, distance factor=0%, 50 slices). Whole-brain functional
600
images were obtained using an echo planar imaging (EPI) sequence (TR=1730
601
ms, TE=30 ms, image matrix=84 × 84, FOV=210 mm, flip angle=66°, slice
602
thickness=2.5 mm, voxel size=2.5 x 2.5 x 2.5 mm, distance factor=0%, 50 slices)
603
with slice acceleration factor 2 (Simultaneous Multi-Slice acquisition). Slices were
604
orientated along the AC-PC line for each subject.
31 For each run of the main task, 373 volumes were acquired, whereas 330 volumes
606
were acquired during each localizer. In all cases, the first 8 volumes were
607
discarded to allow for (1) signal stabilization, and (2) sufficient learning time for a
608
noise cancellation algorithm (OptoACTIVE, Optoacoustics Ltd, Moshav Mazor,
609
Israel). Before data preprocessing, DICOM images obtained from the scanner
610
were converted into NIfTI files using HeuDiConv
611
(https://github.com/nipy/heudiconv), in order to organize the dataset in accordance
612
with the BIDS format50. Further data preprocessing was performed in SPM12
613
(v7487) running on Matlab R2016b. First, anatomical images were defaced to
614
ensure anonymization. They were later segmented into gray matter, white matter
615
and cerebro-spinal fluid components using SPM default parameters. In this step,
616
we obtained inverse and forward deformation fields to later (1) normalize functional
617
images to the atlas space (forward transformation) and (2) transform ROIs from the
618
atlas on to the individual, native space of each participant (inverse transformation).
619
Regarding functional images, preprocessing included the following steps in the
620
following order: (1) Images were realigned and unwarped to correct for movement
621
artifacts (using the first scan as reference slice) and magnetic field
622
inhomogeneities (using fieldmaps); (2) slice timing correction; (3) coregistration
623
with T1 (intra-subject registration): rigid-body transformation, normalized mutual
624
information cost function; 4th degree B-spline interpolation; (4) registration to MNI
625
space using forward deformation fields from segmentation: MNI 2mm template
626
space, 4th degree B-spline interpolation; and (5) smoothing (8-mm FWHM kernel).
627
Multivariate analyses were conducted on the unsmoothed, individual subject’s
32 functional data space and results were later normalized and smoothed (in
629
searchlight analyses) or pooled across participants (in region-of-interest analyses).
630
General Linear Model (GLM) estimations 631
Four GLMs were estimated for each participant in SPM. First, a GLM was used to
632
assess changes in activation magnitude between informative and neutral
retro-633
cues during the main task. A model was constructed including, for each run,
634
regressors for the encoding screen (zero duration), informative/neutral retro-cues
635
(with duration), informative/neutral CTI interval (with duration), probe (zero
636
duration) and ITI interval (with duration). Trials with errors were included as a
637
different regressor that encompassed the total duration of the trial. All regressors
638
were convolved with a hemodynamic response function (HRF). At the population
639
level, parameter estimates of each regressor were entered into a mixed-effects
640
analysis. To correct for multiple comparisons, first we identified individual voxels
641
that passed a ‘height’ threshold of p < 0.001, and then the minimum cluster size
642
was set to the number of voxels corresponding to p < 0.05, FWE-corrected. This
643
combination of thresholds has been shown to control appropriately for
false-644
positives51. A second GLM was estimated on the non-normalized and unsmoothed
645
main task data for all multivariate analyses. This GLM contained beta estimates
646
that specified the cued/uncued S-R categories during informative retro-cues. For
647
each participant and run, a model was built including the following regressors:
648
encoding (zero duration), neutral retro-cues (with duration), probes (zero duration),
649
CTI and ITI (with duration). For informative retro-cues, a regressor that
650
encompassed the total duration of the retro-cue was created for each S-R category
33 combination (e.g. CuedCategory1_UncuedCategory2), resulting in a total of 12
652
regressors (3 per category). Errors were included as a different regressor
653
encompassing the full duration of the trial. Last, a third and fourth GLMs were
654
performed on the non-normalized and unsmoothed data from the two localizers.
655
For each localizer, we built a model that contained regressors for the encoding
656
screen (zero duration), encoding-probe interval (ISI, with duration) for each S-R
657
category (total of 4 regressors), probe (zero duration), ITI (with duration), and
658
errors (full trial). As in the previous GLM, these models were not used in a
659
population-level GLM and were estimated for later use in the canonical template
660
tracking procedure.
661
Multivariate pattern analysis (MVPA) 662
MVPA was performed on the beta images of the second GLM using The Decoding
663
Toolbox52 (v3.99). First, to identify regions that contained information in their
664
patterns of activity about the validity of the cue (informative vs. neutral
retro-665
cues), a whole-brain searchlight analysis was conducted using 3-voxel radius
666
spheres and following a leave-one-run-out cross-validation scheme. In each fold,
667
all beta images but two (one from each class) were used to train the classifier
668
(linear support vector machine (SVM); regularization parameter = 1) which was
669
then tested on the remaining two samples. To rule out the effect of univariate
670
magnitude differences between classes, we z-scored the values of each condition
671
across voxels before the analysis (therefore, each condition that entered the
672
analysis had a mean activation of 0 and an s.d. of 1). The accuracy value was
673
averaged across folds and assigned to the center voxel of each sphere. To assess
34 significance at the population level, accuracy maps were normalized to the atlas
675
space and smoothed. The same analysis strategy as in the GLM analysis was
676
used to threshold the statistical map (given the magnitude of the effect, a
cluster-677
defining threshold of p < 0.0001 instead of p < 0.001 was used, and the minimum
678
cluster size was set to the number of voxels corresponding to p < 0.05,
FWE-679
corrected).
680
Furthermore, to assess the boost of cued S-R categories during implementation,
681
we carried out ROI-based multiclass decoding of S-R categories. In each fold of
682
the leave-one-run-out procedure, we trained a classifier on the identity of the cued 683
S-R category using all informative retro-cue betas but four (one from each class).
684
The classifier was then tested on the remaining samples. The accuracy was
685
averaged across folds. Only one decoding was performed per ROI, using all
686
voxels. To assess significance at the population level, for each ROI, we performed
687
an across-participant one-sample t-test against chance level (25%). We then
688
repeated the same procedure but now training and testing the classifier on the
689
identity of the uncued S-R category. Finally, we compared the decoding accuracies
690
of cued vs. uncued categories using across-participants paired t-tests. All statistical
691
tests were FDR-corrected for multiple comparisons.
692
Canonical template tracking procedure 693
The main goal of the current study was to assess the extent to which procedural
694
and declarative signals were activated during implementation. To do so, we
695
followed a canonical template tracking procedure31. The main rationale of this
696
analysis was (1) to obtain canonical representations of the different S-R categories
35 under the two different formats of interest (procedural and declarative), and later
698
(2) estimate the extent of variance during implementation uniquely explained by
699
each of these representations. The functional localizers performed after the main
700
task allowed us to obtain a participant-specific canonical pattern of activation for
701
each S-R category in declarative and procedural formats. All patterns were derived
702
from beta weights of the GLMs described in the section General Linear Model
703
estimations. Prior to analysis, betas were converted into t-maps and, to increase
704
the reliability of our estimation, we performed multivariate noise normalization on
705
each individual run of the main task and template separately53. To do so, we used
706
the residuals of each participant’s GLMs to estimate the noise covariance between
707
voxels. These estimates, regularized by the optimal shrinkage factor54, were used
708
to spatially pre-whiten the t-maps.
709
To measure the reactivation of the canonical patterns during the main task, for
710
each region, we computed the semi-partial correlation between the pattern of
711
activity during the retro-cue in the main task and the canonical template of each
S-712
R category in the two formats. Since our GLM included different retro-cue
713
regressors depending on the selected S-R category, we could obtain a specific
714
reactivation value for cued, uncued and not-presented categories. Importantly,
715
semi-partial correlations were used to obtain the amount of variance shared
716
between the main task and a template of an S-R category (e.g. in procedural state)
717
that is not explained by the template of that same category in the opposite state
718
(e.g. declarative). To statistically test the boost of cued information, we first
719
normalized the semi-correlation scores by using Fisher’s z transformation and then
36 performed paired t-tests between the cued, uncued and not-presented S-R
721
categories activation (FDR-corrected for multiple comparisons).
722
Region-of-interest (ROI) definition 723
Frontoparietal ROIs were obtained from a parcellated map of the multiple-demand
724
network55. Specifically, frontal ROIs comprised the inferior and middle frontal gyrus
725
regions of the map, and parietal ROIs comprised the inferior and superior parietal
726
cortex regions. All ROIs were registered back to the native space of each subject
727
using the inverse deformation fields obtained during segmentation.
728
We obtained a ventral visual cortex ROI by extracting the following regions in the
729
WFU pickatlas software (http://fmri.wfubmc.edu/software/PickAtlas): bilateral
730
inferior occipital lobe, parahippocampal gyrus, fusiform gyrus, and lingual gyrus (all
731
bilateral and based on AAL definitions). The primary motor cortex ROI was also
732
obtained using WFU pickatlas by extracting the bilateral M1 region.
733 734
Data availability
735
The data that support the findings of this study are available from the
736
corresponding author upon reasonable request.
737 738
37 References
739
1. Cole, M. W., Laurent, P. & Stocco, A. Rapid instructed task learning: A new
740
window into the human brain’s unique capacity for flexible cognitive control.
741
Cogn. Affect. Behav. Neurosci.13, 1–22 (2013).
742
2. Liefooghe, B. & De Houwer, J. Automatic effects of instructions do not
743
require the intention to execute these instructions. J. Cogn. Psychol. 1–14 744
(2018). doi:10.1080/20445911.2017.1365871
745
3. Liefooghe, B., Wenke, D. & De Houwer, J. Instruction-based task-rule
746
congruency effects. J. Exp. Psychol. Learn. Mem. Cogn. 38, 1325–1335
747
(2012).
748
4. Liefooghe, B., Houwer, J. De & Wenke, D. Instruction-based response
749
activation depends on task preparation. Psychon. Bull. Rev. 20, 481–487
750
(2013).
751
5. Meiran, N., Cole, M. W. & Braver, T. S. When planning results in loss of
752
control: intention-based reflexivity and working-memory. Front. Hum. 753
Neurosci.6, 104 (2012).
754
6. Meiran, N., Pereg, M., Kessler, Y., Cole, M. W. & Braver, T. S. The power of
755
instructions: Proactive configuration of stimulus–response translation. J. Exp. 756
Psychol. Learn. Mem. Cogn.41, 768–786 (2015).
757
7. González-García, C., Formica, S., Liefooghe, B. & Brass, M. Attentional
758
prioritization reconfigures novel instructions into action-oriented task sets.
38
Cognition194, 104059 (2020).
760
8. Everaert, T., Theeuwes, M., Liefooghe, B. & De Houwer, J. Automatic motor
761
activation by mere instruction. Cogn. Affect. Behav. Neurosci. 14, 1300–
762
1309 (2014).
763
9. Meiran, N., Pereg, M., Kessler, Y., Cole, M. W. & Braver, T. S. Reflexive
764
activation of newly instructed stimulus–response rules: evidence from
765
lateralized readiness potentials in no-go trials. Cogn. Affect. Behav. 766
Neurosci.15, 365–373 (2015).
767
10. Demanet, J. et al. There is more into ‘doing’ than ‘knowing’: The function of 768
the right inferior frontal sulcus is specific for implementing versus memorising
769
verbal instructions. Neuroimage141, 350–356 (2016).
770
11. González-García, C., Arco, J. E., Palenciano, A. F., Ramírez, J. & Ruz, M.
771
Encoding, preparation and implementation of novel complex verbal
772
instructions. Neuroimage148, 264–273 (2017).
773
12. Hartstra, E., Kühn, S., Verguts, T. & Brass, M. The implementation of verbal
774
instructions: An fMRI study. Hum. Brain Mapp.32, 1811–1824 (2011).
775
13. Palenciano, A. F., González-García, C., Arco, J. E. & Ruz, M. Transient and
776
Sustained Control Mechanisms Supporting Novel Instructed Behavior.
777
Cereb. Cortex bhy273 (2018). doi:10.1093/cercor/bhy273
778
14. Palenciano, A. F., González-García, C., Arco, J. E., Pessoa, L. & Ruz, M.
779
Representational organization of novel task sets during proactive encoding.
39
J. Neurosci. 719–725 (2019). doi:10.1523/JNEUROSCI.0725-19.2019 781
15. Bourguignon, N. J., Braem, S., Hartstra, E., De Houwer, J. & Brass, M.
782
Encoding of Novel Verbal Instructions for Prospective Action in the Lateral
783
Prefrontal Cortex: Evidence from Univariate and Multivariate Functional
784
Magnetic Resonance Imaging Analysis. J. Cogn. Neurosci. 30, 1170–1184
785
(2018).
786
16. Muhle-Karbe, P. S., Duncan, J., Baene, W. De, Mitchell, D. J. & Brass, M.
787
Neural Coding for Instruction-Based Task Sets in Human Frontoparietal and
788
Visual Cortex. Cereb. Cortex bhw032 (2016).