Copyright by
Benton Robb Greene 2014
The Thesis Committee for Benton Robb Greene
certifies that this is the approved version of the following thesis:
Control of Mean Separation in a Compression Ramp
Shock Boundary Layer Interaction Using Pulsed
Plasma Jets
APPROVED BY
SUPERVISING COMMITTEE:
Noel T. Clemens, Supervisor Jayant Sirohi
Control of Mean Separation in a Compression Ramp
Shock Boundary Layer Interaction Using Pulsed
Plasma Jets
by
Benton Robb Greene, B.S.A.S.E.
THESIS
Presented to the Faculty of the Graduate School of The University of Texas at Austin
in Partial Fulfillment of the Requirements
for the Degree of
MASTER OF SCIENCE in Engineering
THE UNIVERSITY OF TEXAS AT AUSTIN May 2014
Acknowledgments
This project and indeed this Masters’ thesis would not have been possi-ble without the support, both direct and indirect, of numerous people. Firstly I would like to thank my advisor Dr. Noel Clemens for his advice and sup-port. I would also like to thank Dr. Jayant Sirohi for agreeing to be my thesis reader. The project itself would not have been possible without the support of Dr. Daniel Micka and others at Creare, Inc., in both funding the project and providing the actuator models for testing. I am also indebted to Dr. Jeremy Jagodzinski for his technical assistance with the experimental facilities. Last, but in no way least, I also thank my parents, Dr. Thomas Greene and Anita Dugat-Greene for both their monetary and moral support and my sister, Mary-Margaret Greene, for her encouragement throughout my studies.
Control of Mean Separation in a Compression Ramp
Shock Boundary Layer Interaction Using Pulsed
Plasma Jets
Benton Robb Greene, M.S.E. The University of Texas at Austin, 2014
Supervisor: Noel T. Clemens
Pulsed plasma jets (also called “SparkJets”) were investigated for use in controlling the mean separation location induced by shock wave-boundary layer interaction. These synthetic jet actuators are driven by electro-thermal heating from an electrical discharge in a small cavity, which forces the gas in the cavity to exit through a small hole as a high-speed jet. With this method of actuation, pulsed plasma jets can achieve pulsing frequencies on the order of kilohertz, which is on the order of the instability frequency of many lab-scale shock wave-boundary layer interactions (SWBLI).
The interaction under investigation was generated by a 20◦ compression ramp in a Mach 3 flow. The undisturbed boundary layer is transitional with Reθ of 5400. Surface oil streak visualization is used in a parametric study to
determine the optimum pulsing frequency of the jet, the optimum distance of the jet from the compression corner, and the optimum injection angle of
the jets. Three spanwise-oriented arrays of three plasma jets are tested, each with a different pitch and skew angle on the jet exit port. The three injection angles tested were 22◦ pitch and 45◦ skew, 20◦ pitch and 0◦ skew, and 45◦ pitch and 0◦ skew. Jet pulsing frequency is varied between 2 kHz and 4 kHz, corresponding to a Strouhal number based on separation length of 0.012 and 0.023. Particle image velocimetry is used to characterize the effect that the actuators have on the reattached boundary layer profile on the ramp surface. Results show that plasma jets pitched at 20◦ from the wall, and pulsed at a Strouhal number of 0.018, can reduce the size of an approximate measure of the separation region by up to 40% and increase the integrated momentum in the downstream reattached boundary layer, albeit with a concomitant increase in the shape factor.
Table of Contents
Acknowledgments v Abstract vi List of Tables x List of Figures xi Chapter 1. Introduction 11.1 Shock Wave/Boundary Layer Interaction . . . 1
1.2 SWBLI Control Devices and Mechanisms . . . 4
1.2.1 Boundary Layer Suction and Blowing . . . 4
1.2.2 Vortex Generators . . . 5
1.2.3 Plasma Actuators . . . 6
1.2.4 Pulsed Plasma Jets . . . 8
1.3 Current Work . . . 10
Chapter 2. Experimental Program 12 2.1 Test Geometry . . . 12
2.1.1 Plasma Actuator Array . . . 12
2.1.2 Flow Conditions . . . 15
2.2 Oil Streak Flow Visualization . . . 16
2.2.1 Apparatus . . . 17
2.2.2 Analysis . . . 17
2.3 Particle Image Velocimetry . . . 20
Chapter 3. Results and Discussion 22
3.1 Parametric Study . . . 22
3.2 Repeatability . . . 29
3.3 PIV of Downstream Boundary Layer . . . 32
3.3.1 Analysis . . . 32
Chapter 4. Summary and Conclusions 38
Bibliography 41
List of Tables
2.1 Orientation of each actuator. The pitch angle is the angle up from the streamwise direction, and the skew angle is the angle from the streamwise direction toward the spanwise direction. . 15 3.1 Comparison of forced and unforced boundary layer profiles
List of Figures
1.1 Schematic diagram of a compression ramp interaction . . . 2 2.1 Schematic diagram of pulsed plasma jet . . . 14 2.2 Schematic diagram of jet actuator and compression ramp
as-sembly. . . 14 2.3 Diagram of plasma actuator circuit . . . 16 2.4 Model of plasma actuator experimental setup . . . 17 2.5 Example of oil streak flow visualization image, showing the
sep-aration line and compression ramp corner . . . 18 3.1 Example of downstream displacement of separation line. . . . 22 3.2 The effect of streamwise location of the compression ramp on
distance of the separation line from the compression corner, aggregated for all three actuators (including various forcing fre-quencies). A negative value for change in separation region length indicates a reduction in size. . . 24 3.3 Comparison of separation reduction for different jet configurations 25 3.4 Illustration of the separation reduction mechanism . . . 26 3.5 Percent change in separation length vs. pulse frequency . . . . 28 3.6 Percent change in separation length vs. unforced boundary layer
location . . . 30 3.7 Percent change in separation length vs. test section static pressure 30 3.8 Response of actuation effectiveness to variation in luminous
in-tensity of jet discharge, broken down by forcing frequency . . . 31 3.9 Forced and unforced boundary layer velocity profiles 3δ
down-stream of SWBLI on midplane between two plasma jets. . . . 33 3.10 Forced and unforced best-fit wall-wake model velocity profiles
Chapter 1
Introduction
1.1
Shock Wave/Boundary Layer Interaction
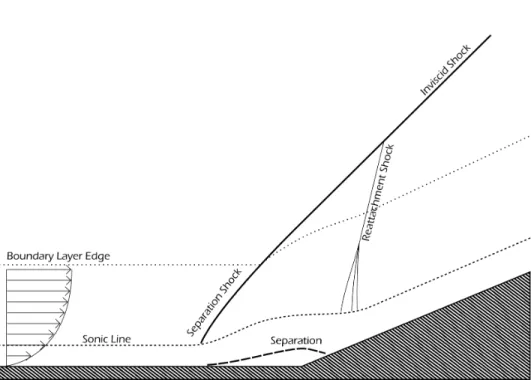
The phenomenon of shock wave/boundary layer interaction (SWBLI) has been extensively studied for almost as long as supersonic flight has been possible. When a shock wave impinges on a surface, a complex interaction between the shock wave and the fluid boundary layer on the surface occurs. Because part of the boundary layer is subsonic, information about the pressure increase due to the shock is allowed to spread upstream. This tends to cause the upstream boundary layer to grow larger, which in turn generates com-pression waves which spread out the impinging shock into a separation shock structure as seen in Figure 1.1. In an interaction with a sufficiently strong shock, the high adverse pressure gradient caused by the impinging wave can also cause the boundary layer to separate [1].
In addition to the time-averaged picture depicted in Figure 1.1, the sep-arated flow exhibits an unsteadiness in multiple time scales. A dominant mode is a low-frequency oscillation of the separation shock, up to several boundary layer thicknesses in amplitude, depending on the strength of the impinging shock. The exact cause of the unsteadiness in the separated flow is still up
Figure 1.1: Schematic diagram of a compression ramp interaction
for debate, but several candidate causes have been investigated. A review by Dussauge and Piponniau [2] found that for limited cases, the shock mo-tion could be explained by large-scale fluctuamo-tions in the upstream boundary layer. In another review, Clemens and Narayanaswamy [3] discuss research that points to both intrinsic instability of the separation region and turbu-lent fluctuations in the upstream boundary layer. Narayanaswamy et. al. [4] found that the frequency of the shock foot excursion could be locked into the frequency of pulsed synthetic jets upstream of the interaction.
SWBLI have the potential to affect the performance characteristics of any aerodynamic structure in a transonic or supersonic flow: helicopter blades, wings, aircraft control surfaces, supersonic inlets, etc. Even if the
interaction is not strong enough to cause separation, the adverse pressure gradient will cause the boundary layer to grow significantly [5]. In addition, studies in the 1980s showed that interaction with an impinging shock amplifies the turbulence intensity and Reynolds stresses in the boundary layer [6–9], which leads to increased skin friction around the interaction, in turn increasing thermal loads as well as drag.
In addition to affecting the downstream boundary layer, the instabilities in the separation bubble itself also can adversely affect aerodynamic structures. The rapid excursion of the upstream shock foot exposes the structure in the vicinity of the interaction to a high-frequency, high-amplitude pressure fluctu-ation. Such a fluctuation can lead to structural fatigue of these components. This problem can be mitigated by simply overbuilding components exposed to the SWBLI, but being able to control such interactions could lead to overall lighter and better optimized airframes.
Of particular interest is the effect of SWBLI on inlet efficiency. Mixed compression supersonic inlets utilize a series of oblique shock waves to com-press the oncoming flow before it enters the engine. However, the interaction between these oblique shocks and the wall of the inlet increases flow distortion, and decreases the amount of recovered stagnation pressure; thus it is advan-tageous to decrease the amount of flow separation induced by an impinging shock.
1.2
SWBLI Control Devices and Mechanisms
Control of SWBLI can focus on several different effects, including drag reduction, flow separation, cyclic loading from unsteady shock motion, and downstream stagnation pressure recovery, and can be achieved through a va-riety of basic mechanisms like introduction of boundary layer vorticity to en-hance the momentum of the boundary layer, direct addition of momentum through blowing or body forces, energy addition through surface heating, or removal of low-momentum fluid through suction. In some cases, multiple con-trol mechanisms can be utilized at different points in the flow to increase the overall control authority.
1.2.1 Boundary Layer Suction and Blowing
A common method of mitigating problems caused by SWBLI is bound-ary layer bleed, in which low-momentum fluid is removed from the flow through wall suction. This technique was first applied to supersonic flows in the 60s [10– 13], and Delery has an extensive discussion of it in his 1985 review paper [14]. The technique is commonly used in supersonic inlets and is highly effective at increasing overall stagnation pressure recovery and reducing flow separation inside the inlet, but it reduces the efficiency of the inlet because some of the mass flow into the inlet is discarded before reaching the engine.
Boundary layer bleed can be used upstream of the shock interaction to keep the boundary layer from separating in the first place. However, as Delery points out, this can make things worse in that it tends to make the shock
stronger which can cause the boundary layer to become even more distorted downstream. A way around this problem is to apply suction downstream of the interaction to remove distortions in the boundary layer after they have been created. Nagamatsu et. al. were able to passively induce suction down-stream of a transonic shock boundary layer interaction using a porous bleed plate [15]. A porous wall allowed air to flow from the downstream side of the interaction to the upstream side, naturally inducing suction downstream and blowing upstream. He concluded that such a device increased pressure recovery downstream of the shock.
The reverse, boundary layer blowing, can also be used to mitigate the effects of SWBLI by directly adding momentum to the boundary layer and reduce the propensity for separation [16]. Selig and Smits [17] found that periodic slot blowing at frequencies as high as 5kHz has a strong effect on compression ramp flow, exhibiting an ability to control the unsteadiness of the compression ramp shock interaction, as well as move the mean shock position upstream.
1.2.2 Vortex Generators
Sub-boundary layer vortex generators (SBVG) are devices on the scale of a boundary layer thickness or smaller which affect shock-induced boundary layer separation by inducing vorticity in the boundary layer, thereby mix-ing high-momentum fluid in the upper part of the boundary layer with low-momentum fluid near the wall. These can come in several types including
vanes [18, 19] and microramps [20, 21], as well as “virtual” or aerodynamic vortex generators which use air jets rather than surface features [22–24].
Vane-type SBVGs were investigated in the 1950’s and 60’s to reduce drag on transonic airfoils. Lina and Reed [25] found them to be effective at eliminating boundary layer separation downstream of the shock on a transonic airfoil, and Gartling was able to eliminate separation in a turbulent Mach 4.67 compression corner interaction if the vortex generators were located sufficiently close to the separation [19]. Similar techniques are still under investigation today using microramps [20, 21, 26, 27] to reduce flow distortion in supersonic inlets.
Air jets have some advantages over other types of vortex generators in that they can be turned off when not needed to minimize parasitic drag at off-design conditions. The effect of pulsing the jets at relatively high frequencies on shock-induced separation has also been investigated [17, 22]. In particular, Bueno et. al. were able to cause the interaction to move downstream by a quarter of a boundary layer thickness by using pulsed air jets [22]. Continuous air jet injection has also been shown to reduce the size of the separation bubble in a Mach 2.3 reflected shock interaction [23].
1.2.3 Plasma Actuators
A more recent development in the flow control community is the plasma actuator. These come in many different types, but all utilize an electrical dis-charge in some way to affect the flow. Some of the more commonly studied
are magnetohydrodynamic actuators [28–30], dielectric barrier discharge actu-ators [31], and localized arc-filament plasma actuactu-ators (LAFPAs) [32–35].
Magnetohydrodynamic actuators work by generating a plasma within the fluid under control and using magnetic fields to accelerate the plasma in a particular direction, dragging the rest of the fluid with it. Zaidi et al. [28] were able to show that such actuation could have an effect on the boundary layer of a Mach 2.8 flow. Specifically, they were able to increase the Mach number of the flow in the boundary layer by about 3.5% compared to an unforced case. Pafford et al. [30] used a rail-type MHD actuator, which uses the Lorentz-induced motion of an arc along a pair of conductive rails to generate a wall jet. They demonstrated an ability to achieve arc velocities on the order of 10 m/s and a peak induced fluid velocity of 16 m/s.
Dielectric barrier discharge (DBD) actuators use a glow discharge be-tween two electrodes separated by some sort of dielectric layer to generate a plasma, which is then accelerated by an electric field. A common configu-ration of this type of device generates a wall jet which can then be used to accelerate flow inside a boundary layer or separated region. DBDs have been shown to be quite effective in subsonic flow control applications, especially in mitigation of boundary layer separation [31, 36–41]. High speed applications have been more limited, but these devices have also been applied successfully to the control of high speed compressible boundary layers [42], and controlling bow shocks in a high speed flow [43].
in-teraction that can be pulsed at high voltage and frequency to generate arc filament plasma discharges in the boundary layer. Early results were encour-aging, showing that the actuators could improve certain characteristics of flow inside a reflected shock-boundary layer interaction region [33]. Initially, it was thought that the localized arc acted as a vortex generator. However, in a 2013 paper, Webb et al. [44] concluded that local surface heating from the discharge was the driving mechanism of control.
1.2.4 Pulsed Plasma Jets
Also called “SparkJets” by other researchers, pulsed plasma jets were developed by Grossman et. al. [45] for use as microactuators for flow con-trol. They are synthetic, or zero net mass flow, jets that are refilled from the freestream after each pulse rather than from an external supply of gas. The jet itself is driven by an electrical discharge in the plenum which heats the air in the plenum through Joule heating, causing it to rapidly expand out of the exit port.
Synthetic jets actuated by piezoelectric mechanisms have been studied extensively for applications to low-speed and high-speed flow control. Pulsed plasma jets, however, have several key advantages that make them promising for control of SWBLI. The main advantage is that the jet exit velocities are much higher, on the order of 250 to 600 m/s [4, 45], compared to piezoelectric synthetic jets, which drive on the order of 10 m/s jet flow [46]. The higher jet velocities mean that they can have higher momentum flux ratios in high-speed
flows and potentially add more momentum to the cross-flow. In addition, the character of the interaction of the jet with the cross flow is different as the jet velocity is close to or exceeds the speed of sound of the surrounding fluid.
Pulsed plasma jets have been most extensively studied for their ability to control SWBLI, as well as for hypersonic vehicle flight control. Specifically, Narayanaswamy et al. [4] developed a higher-frequency design capable of pulse frequencies up to 5kHz and successfully used them to control the shock foot instability in a compression ramp SWBLI. They showed that the motion of the shock foot could be locked into the pulsing frequency of the jets. Controlling the shock foot excursion frequency could lead to ways to reduce the fatigue loading on the airframe.
Narayanaswamy [47] also performed some studies to optimize the di-mensions of the cavities. Within their parameter space, they found that the velocity of the jet as measured by the velocity of the contact surface is insen-sitive to variations in both plenum cavity volume and jet exit diameter within the range tested. Multiple other studies have been performed since, investigat-ing various aspects of pulsed plasma jet efficiency. Haack et al. found that the efficiency of pulsed plasma jets decreases linearly with ambient pressure, and that the efficiency is limited by heat transfer through the walls of the plenum cavity [48]. This seems to disagree with findings by Narayanaswamy et al. that a pulsed plasma jet with a plenum cavity made from boron nitride, which has a thermal conductivity of 27 W/K, has a jet exit velocity 30% higher than a jet with a cavity made from Macor, which has a thermal conductivity of 1.46
W/K [47].
Beyond this work, pulsed plasma jets have been studied for flight con-trol as an alternative to moveable concon-trol surfaces. Anderson and Knight concluded in their 2012 paper [49] that arrays of plasma jets could be made to impart enough impulse to control the course of a hypersonic vehicle.
1.3
Current Work
Pulsed actuation has been shown by Narayanaswamy et al. [47]to affect the separation instability in SWBLI, but pulsed plasma jets also have the potential to energize the boundary layer through both streamwise vortices and through direct momentum addition from the jets [50]. Such momentum addition could be used to directly affect the size of the separated region as well as the characteristics of the boundary layer downstream of the interaction. The interaction of the pulse frequency with the natural frequency of the separation bubble and shock foot could also contribute to the control authority of pulsed plasma jets.
To this end, the current study focuses on the ability of the jets to re-duce the length scale of the separation bubble inre-duced by a 20◦ compression ramp in a Mach 3 flow. First, a parametric study was performed to determine the optimum jet exit orientation, jet exit location relative to the compression ramp, pulse frequency, and pulse duty cycle for reduction in separation length. The size of the shock-induced separation bubble was visualized using oil streak analysis because it was a quick diagnostic that could efficiently eliminate
in-effective combinations of parameters. Once an optimum configuration was found, particle image velocimetry (PIV) was used to determine the effective-ness of the pulsed plasma jets in increasing the momentum in the reattached boundary layer downstream of the SWBLI.
Chapter 2
Experimental Program
Experiments were performed in the Mach 3 blowdown-type pressure-vacuum tunnel in the Flowfield Imaging Laboratory at The University of Texas at Austin. The tunnel is supplied by a 7m3 storage tank at 900 kPa and
exhausts into a 50.8 m3 vacuum tank evacuated to 6.5 kPa. The test section
is 50.8 mm square and is designed with a full-span splitter plate in the nozzle to allow wake formation in the test section. However, for this experiment, the splitter plate was extended and used as a floor, effectively reducing the test section dimensions to 50.8 mm wide by 22.8 mm tall.
The boundary layer was allowed to form naturally on the splitter plate. Under the run conditions investigated, the boundary layer thickness was 4.5 mm, the momentum thickness, θ, was 0.26 mm, and the Reynolds number based on momentum thickness, Reθ, was 5400.
2.1
Test Geometry
2.1.1 Plasma Actuator Array
The design of the pulsed plasma jet itself is based on that used by Narayanaswamy [4]. Each jet consists of a cylindrical plenum bounded at
both ends by copper tungsten electrodes, and a jet exit port exhausting to the tunnel floor, as depicted in the cross-section diagram in Figure 2.1. The diameter of the jet exit port is 1.78 mm, and the diameter of the plenum is 2.38 mm. The large jet exit diameter as compared to the plenum diameter allows the plenum to refill from the freestream on a time scale of tens of microseconds, which allows the jets to be pulsed at frequencies up to 5 kHz. This frequency is of the same order as the order of the low-frequency unsteadiness in the separated region. The orientation of the jet exit is defined by the pitch and skew angle. As shown in Figure 2.1, the pitch angle is the angle from the streamwise direction toward the transverse direction; the skew angle is the angle of the jet from the streamwise direction towards the spanwise direction. The actuator body was machined from boron nitride ceramic for its thermal conductivity, high electrical resistance, and tolerance for high temper-ature. Jet cavities machined from boron nitride were found by Narayanaswamy et al. to produce the highest jet exit velocity [4].
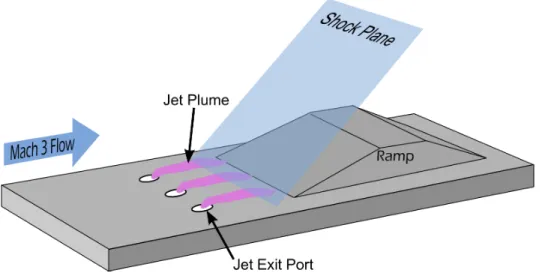
For all of the experiments, an array of three pulsed plasma jets arranged spanwise with a 8 mm center-to-center spacing was used. Three configurations of such arrays were investigated for their ability to reduce the separated flow in an interaction induced by an oblique shock from a 20◦ compression ramp, given in Table 2.1. The geometry of the jet actuator and compression ramp is shown in Figure 2.2.
The actuator cathode is connected to a Spellman SL1200 1200 W, 2 kV power supply, which provides the breakdown voltage. A 1000 Ω, 250 W
Figure 2.1: Schematic diagram of pulsed plasma jet
Table 2.1: Orientation of each actuator. The pitch angle is the angle up from the streamwise direction, and the skew angle is the angle from the streamwise direction toward the spanwise direction.
Designation Pitch Skew
1 40◦ 0◦
2 22.5◦ 45◦
3 20◦ 0◦
power resistor is used as ballast to stabilize the arc, while a 0.25µF capacitor between the voltage supply and ground smooths the pulse signal so the power supply only sees a constant DC current draw. The anode is connected to ground through a STP4N150 PowerMESH MOSFET, which is then pulsed at a frequency between 2500 Hz and 4000 Hz and a duty cycle of between 8% and 15% using a variable-frequency pulse generator. The circuit diagram is shown in Figure 2.3.
2.1.2 Flow Conditions
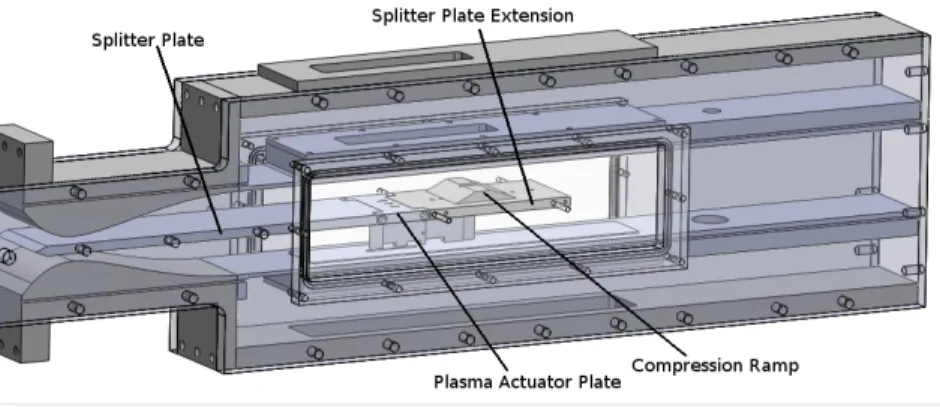
Each array body is integrated into the splitter plate such that the top surface of the array body is flush with the “floor” of the test section, as shown in the diagram of the wind tunnel in Figure 2.4. An oblique shock is generated downstream of the array by a 20◦ compression ramp whose position, x can be adjusted in the streamwise direction between 0 and 30 mm downstream of the jet exit ports. In order to reduce unwanted interaction with the wall boundary layer, the compression ramp is 3.8cm, which is 75% of the tunnel span.
Figure 2.3: Diagram of plasma actuator circuit
a Reθ of 5400 and a thickness of 4 mm, as measured by Narayanaswamy et
al. [47] under similar flow conditions in the same facility. The static pressure in the test section is between 8 and 9 kPa.
2.2
Oil Streak Flow Visualization
To test the efficacy of using pulsed plasma jets to reduce the separated flow due to a compression ramp shock boundary layer interaction, a means of determining the separated flow length scale is needed. Surface oil streak visu-alization is an effective method for determining the location of mean boundary layer separation, and so was used to screen different configurations of actuators to find the configuration with the highest effectiveness.
Figure 2.4: Model of plasma actuator experimental setup
2.2.1 Apparatus
Oil streak visualization is done using a mixture of approximately three parts SAE-30 motor oil to one part TiO2 powder. The floor of the tunnel
was painted black to provide contrast with the oil mixture. The mixture was applied to the surface of the splitter plate before every run. The oil streaks were imaged through a fused silica window in the ceiling of the tunnel using a Kodak Megaplus ES-1 camera at 10 Hz so the evolution of the surface oil streaks could be observed throughout the run. The field of view of the image spans 2.5cm: 70% of the ramp width and half the test section width.
2.2.2 Analysis
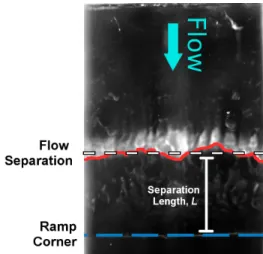
When the tunnel is started, a streak of oil forms at the upstream edge of the separated region. An example oil streak image is given in Figure 2.5. In the figure, the flow is from top to bottom. The separation line is visualized
Figure 2.5: Example of oil streak flow visualization image, showing the sepa-ration line and compression ramp corner
by the white oil streak and is highlighted with a solid red line in the image. The ramp corner is indicated with a blue dashed line.
For analysis purposes, the location of the separation line was taken to be the downstream edge of the oil streak as defined by a drop in the intensity by one half of the image between the white color of the oil streak and the black underlying surface. In the unforced case, the separation line was observed to be straight across the entire field of view of the image. The forced case, on the other hand, is highly convoluted. Because of this nonuniformity, the maximum absolute displacement of the observed oil streak was taken to be representative of the effect of the jets, and this displacement was normalized by the mean unforced position of the oil streak. Uncertainty in the location values measured from the images was estimated from the size in pixels of the gradient between the high intensity oil streak and the low intensity of the floor. This spread
was found to be approximately 5 pixels, which when multiplied by the field of view over the image resolution, gives a resolution uncertainty of 0.1mm. Since this resolution uncertainty applies to both the unforced separation line location and to the separation line displacement, the overall uncertainty in the measured values is assumed to combine as the root of the sum of the squares. The separation line could be reliably determined from the images, but the reattachment line was difficult to discern and so data on the motion of the separation point could not be related to overall reduction of the size of the separated flow. Instead the distance between the separation line and the corner of the compression ramp was used as the definition of the separated flow length. It is important to note that one cannot draw conclusions about the state of the overall separated region from this metric as the effect of the jets on the reattachment line has not been quantified. However, for the pur-poses of comparison to other researchers a quantification of the discrepancy between this separation length metric and the true separation length assum-ing the reattachment line is stationary is made usassum-ing data from Settles et al., 1979 [1]. For a 20◦ compression ramp, the separation point occurs approxi-mately 0.5δ upstream of the compression corner, and the reattachment point occurs approximately 0.1δ downstream of the corner. Therefore, neglecting the downstream section of the separated region incurs an error of 17%.
2.3
Particle Image Velocimetry
PIV was used to obtain the velocity field on the ramp downstream of the separation region in order to characterize the effect the pulsed plasma jets have on the flow downstream of the shock-induced separation. The measurement plane was streamwise-transverse with a field of view of 30 mm that extended 25 mm downstream of the jet exits. The plane was located 4 mm from the center jet exit centerline in the spanwise direction, placing it directly between the center jet and the outermost jet. This location was chosen because it was the location at which the maximum reduction in separation length was observed in the oil streak analysis.
2.3.1 Apparatus and Processing
The freestream flow was seeded with 1 µm diameter olive oil droplets using a TSI model 9306 six-jet atomizer pressurized to 85 psi. The parti-cles were illuminated using a dual-cavity, frequency-doubled Nd:YAG laser (Spectra Physics PIV 400), with a pulse separation of 0.5µs. Images were cap-tured at 10 Hz using a frame-straddling 2k x 2k pixels CCD camera (Princeton Instruments Megaplus ES4020).
Image pairs were processed using the LaVision software DaVis 7.2. The processing procedure used was based on that of Narayanaswamy [47], for which a very similar wind tunnel and imaging setup was used. The final interrogation window size was 16 x 16 pixels, and the maximum pixel displacement was 17 pixels, corresponding to the freestream. Ensemble-averaged vector fields were
calculated for each test case from approximately 200 uncorrelated instanta-neous fields. The root-mean-square deviation from the mean vector field was calculated to be between 120 m/s and 166 m/s. These relatively high values indicate that the ensemble average did not have enough vector fields to fully converge. They also indicate a high degree of variability in the instantaneous flow fields.
Chapter 3
Results and Discussion
3.1
Parametric Study
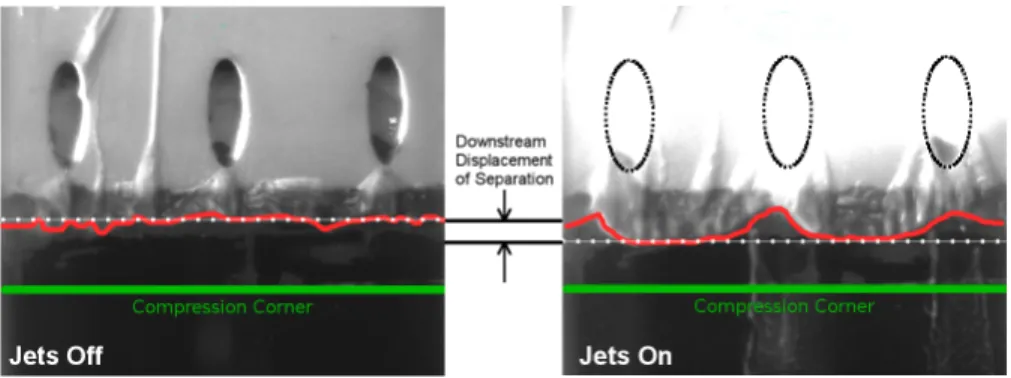
To find the optimal jet configuration, multiple parameters were inves-tigated: frequency of pulses, duty cycle, jet orientation, and downstream dis-tance of the ramp. Figure 3.1 shows an example of a case for which actuation by the jets produced downstream motion of the separation line.
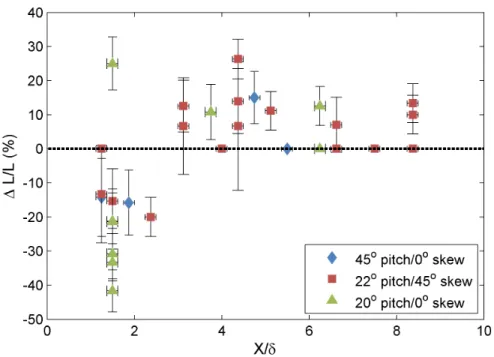
The distance, x, between the jet centerline and the compression ramp corner was varied between 6 mm and 28 mm (x/L of 1.7 and 8, respectively), and the effect on the separation length scale is shown in Figure 3.2. From the plot, it is clear that there is a distinct cutoff distance at approximately 3δ, above which the jets have the effect of increasing the separation length scale
and below which they decrease the separation length. The former effect is consistent with the findings of Narayanaswamy et al. [51], where the jets were placed at an x/L of 6 upstream of the separated flow and they observed an overall upstream motion of the forced separation shock. One possible reason for this cutoff point is an interplay between two effects: streamwise vorticity and heat addition. The jets serve to generate streamwise vorticity, which tends to decrease the separation length scale but this effect weakens with downstream distance. On the other hand, the discharges also serve to heat the boundary layer, which tends to lead to more instability.
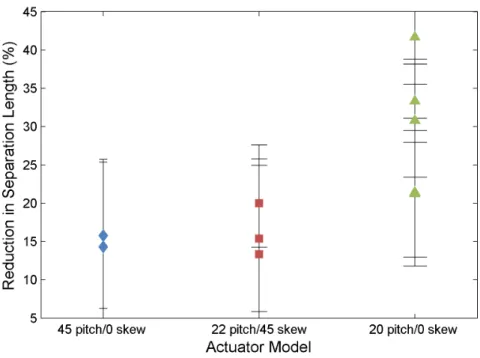
It also turns out that the higher-angle pitched jets (45◦) perform worse than either of the other two configurations, as illustrated by Figure 3.3. The figure shows a scatter plot of the performance of each jet for the cases in which separation was reduced. The 20◦ pitch/0◦ skew jets performed the best, with a reduction in separation length between 20% and 40% for all forcing frequencies tested. The skewed jets reduced the separation length by between 15% and 20%, and the 45◦ pitched configuration only reduced the separation length by about 15%.
Looking at the separation line visualized by the surface oil streaks, we can also get an idea of the flow structures causing this reduction in the separation length scale. In the oil streak image in Figure 3.4, one can see that between the jets the separation line is pushed significantly downstream, whereas directly downstream of the jet exits, the separation line is moved upstream slightly. These observations suggest that the reduction in separation
Figure 3.2: The effect of streamwise location of the compression ramp on distance of the separation line from the compression corner, aggregated for all three actuators (including various forcing frequencies). A negative value for change in separation region length indicates a reduction in size.
is caused by the interaction of two counter-rotating vortices between the two jets. The interaction of each jet with the flow generates a horseshoe vortex structure. Between the jets, these vortices interact to create regions of upwash and downwash. A schematic diagram below the image in Figure 3.4 outlines the probable flow structure. Between the jet exits, these downwash regions pull higher-velocity fluid from the top of the boundary layer down close to the wall, increasing the boundary layer’s resistance to separation. However, downstream of the jet exits, the vortices generate an upwash region which pulls lower velocity air into the upper boundary layer and decreasing the resistance to separation in that region.
After fixing the ramp location at the optimal distance of 1.5δ down-stream of the jet exits, the effect of jet pulsing frequency was investigated. The forcing frequency of the actuators was varied between 2 kHz and 4 kHz, corresponding to Strouhal numbers of 0.012 and 0.023. The upper limit of 4 kHz is a limitation of the power rating of the power supply that was used. Figure 3.5 shows the effect of forcing frequency on the change in separation length. There is a lot of scatter in the data caused by problems with the power supply for the jets, as well as the occurrence of arcing exterior to the jet cavities which affected the amount of discharge energy in the jets from run to run. However, in the figure there is a clear peak in effectiveness at a forcing frequency of 3200 Hz.
The frequency of 3200 Hz corresponds to a Strouhal number of 0.018, based on a separation length,L, of 3.4 mm and aU∞of 615 m/s. This is similar
Figure 3.5: Percent change in separation length vs. pulse frequency to the Strouhal number associated with the instability in a compression ramp interaction found by Erengil and Dolling [52]. Caraballo et al. [33] found that pulsing their plasma actuators with a Strouhal number of 0.03 proved most effective at increasing the momentum of the flow inside the interaction region of a SWBLI. This suggests that in addition to the vortex generator effect of the plasma jets, the forcing frequency also seems to couple into the natural instability of the separated region to push the shock foot farther downstream.
3.2
Repeatability
A large amount of scatter is evident in the oil streak data, though it does not appear to obscure the overall trends in separation line motion versus frequency, jet location, and jet orientation. Several possible sources of scatter were investigated to find the cause: variations in tunnel conditions, boundary layer conditions, and variations in jet energy. The tunnel is manually operated and must be continually adjusted during the run to keep a constant pressure in the test section. This introduces an element of human error that could cause variation in run conditions. In addition, the power supply was being operated near the top of its design power output limitations, causing the built-in protection circuitry to reduce the actual power output below nombuilt-inal.
To determine the degree to which run-to-run variations in the boundary layer and test section conditions affected the oil streak results, the separation motion for each run was plotted with respect to the average unforced separa-tion length for each run, shown in Figure 3.6, as well as with respect to tunnel static pressure, shown in Figure 3.7. The observed variation in the unforced separation line location is indicative of a somewhat transitional boundary layer, however there doesn’t seem to be an obvious trend in how this variation af-fects the actuation of the plasma jets. The variation in the test section static pressure, on the other hand, seems to show a peak around 50 Torr.
A more interesting picture emerges when the effect of jet discharge luminous intensity is investigated. Figure 3.8 shows how the percent change in separation line location changes with the luminous intensity of the discharge
Figure 3.6: Percent change in separation length vs. unforced boundary layer location
Figure 3.8: Response of actuation effectiveness to variation in luminous inten-sity of jet discharge, broken down by forcing frequency
in the jet plenum. All runs in the figure are nominally the same average power, but there is some variation in the observed luminosity of the jets, likely due to inconsistent operation of the power supply. For plotting purposes, this luminous intensity is calculated as a ratio of the mean intensity of the image with the jets on to that with the jets off. Room lighting and camera exposure settings were controlled throughout the data gathering phase, so image intensity provides a consistent metric for jet luminosity.
For every forcing frequency case except 3400 Hz, there is a clear trend with actuation effectiveness increasing with luminous intensity of the dis-charge. This seems to indicate that the observed scatter in the separation line motion is at least partly due to inconsistent operation of the jets.
3.3
PIV of Downstream Boundary Layer
To characterize the effect of the pulsed plasma jets on the boundary layer profile downstream of the SWBLI, PIV was performed for the most effec-tive case found: 3200 Hz forcing frequency with a 1.5δ ramp location and 20◦ pitch 0◦ skew jets. The measurement plane was positioned at the centerline between two jets, where the maximum effect was noted during the oil streak analysis phase. To characterize the boundary layer, a velocity profile was cal-culated from the average velocity field along a line normal to the surface of the compression ramp, centered approximately 3δdownstream of the compression corner. This point is on the ramp surface just upstream of where the flow starts to expand around the top of the ramp. Laser reflection from the floor eliminated data points below ay/δ of 0.4.
3.3.1 Analysis
A wall-wake profile described by Sun and Childs [53, 54] was used to extrapolate the boundary layer profile down to the floor. This technique is an extension of the law of the wall and the law of the wake for turbulent boundary layers to compressible flow using the Van Driest transformation. It has been shown by Mathews et al. [55] to give physically realistic values forδandCf for
a variety of flows including reattaching flow after a shock-induced separation, which is most relevant for this research.
To generate the fit profiles as well as calculate the boundary layer in-tegral properties, it was necessary to make the assumption that the tunnel
Figure 3.9: Forced and unforced boundary layer velocity profiles 3δ down-stream of SWBLI on midplane between two plasma jets.
walls are adiabatic so a density profile could be inferred. This assumption could be violated if the tunnel walls temperature were considerably different from the recovery temperature of the flow or if the pulsed plasma jets were a significant source of boundary layer heating. The tunnel wall temperature and the adiabatic wall temperature of the flow are both approximately room temperature, so from this standpoint an adiabatic assumption is valid.
A rough estimate of the heating from the jets also shows that it does not significantly affect the validity of the adiabatic assumption. Based on
Figure 3.10: Forced and unforced best-fit wall-wake model velocity profiles 3δ downstream of SWBLI.
measurements of the peak current in a jet pulse, the jets dissipate, on average, approximately 100 W per jet, or a total of 300W for the entire array. Based on measurements taken by Narayanaswamy et al. [4], only 10% of the power goes toward heating the gas, and the rest raises the vibrational temperature. Thus, approximately 30W of power goes directly toward gas heating. If one assumes complete mixing of the heated jet exhaust with the ambient bound-ary layer (unlikely, but useful for illustration purposes), then activation of the jet only increases the total enthalpy of the boundary layer by 0.6%—a neg-ligible amount. Even if we assume all of the electrical energy is eventually
converted to thermal energy, the heating varies the enthalpy by 6%, which for this analysis can be neglected.
The fit boundary layer profiles are also shown in Figure 3.10. From the fit profile the momentum thickness and shape factor for the forced and unforced boundary layers were calculated and are given in Table 3.1.
The boundary layer thickness for the forced case is significantly de-creased from that of the unforced flow, which can also be seen in Figure 3.9, meaning it has more integrated momentum. At first glance, this would seem to be inconsistent with the lower friction coefficient for the forced case. However, the shape factor of the forced case is also higher, indicating a less-full profile, which would have a smaller velocity gradient near the wall.
Table 3.1: Comparison of forced and unforced boundary layer profiles down-stream of SWBLI. Forced Unforced Cf 6.21×10⁻⁴ 7.05×10⁻⁴ δ 3.3 mm 3.5 mm δ? 0.747 mm 0.77 mm θ 0.476 mm 0.517 mm H 1.57 1.49
Since the flow downstream of the separation has been affected by both the plasma jets and the SWBLI, determining the exact cause of the differences between the forced and unforced cases is difficult. The reduction in overall boundary layer thickness for the forced case is likely directly caused by the reduction in size of the separated region. A larger separated region causes the flow to more gradually compress upstream of the compression corner rather
than abruptly compressing at the corner, which decreases the pressure gra-dient. Reducing the size of the separated region increases the abruptness of the compression and strengthens the shock. It is instructive to compare these results with outgoing boundary layer profiles found by Settles et al. [56] They determined that for a 20◦ compression in Mach 2.85 flow, the ratio of incom-ing to outgoincom-ing boundary layer thickness was 0.75, whereas a calculated value using continuity predicted a value of 0.65, which suggests that the presence of the separated region inflates the outgoing boundary layer. It would then make sense that reducing the size of the separated region would reduce the overall thickness of the outgoing boundary layer.
One interesting question these results raise is why the downstream boundary layer appears to be more prone to separation when previous ob-servations indicate that the shock-induced separation and the overall outgoing boundary layer thickness are reduced. It is possible that reducing the separated flow directly destabilizes the boundary layer. Settles et al. [56] showed that higher ramp angles exhibited more distortion in the outgoing boundary layer, and the boundary layer took longer to evolve back to the equilibrium wall-wake profile. Reducing the size of the separated region increases the strength of the separation shock, which could destabilize the boundary layer more even while reducing its overall thickness. This suggests that if the goal is to improve the flow conditions downstream of the SWBLI, it may be counter-productive to eliminate the separated region. Rather, one might improve the quality of the boundary layer downstream of the SWBLI by deliberately increasing the
size of the separated region in order to decrease the strength of the separation shock.
Chapter 4
Summary and Conclusions
Pulsed plasma jets were studied for their effectiveness at reducing the size of the shock-induced separation and the degree of boundary layer distor-tion in a compression corner SWBLI. An array of three pulsed plasma jets arranged in a spanwise line were used to control the interaction of a shock from a 20◦ compression ramp with a turbulent boundary layer. Oil streak visualization showed that the actuators have significant control authority over the mean separation location, reducing the distance between the separation line and the compression ramp corner by up to 40% for the most optimal configuration studied.
Oil streak analysis was used to perform a study of multiple actuation parameters—injection angle, pulsing frequency, duty cycle, and actuator loca-tion—to determine the configuration with optimum control authority. It was determined that the optimum injection angle is a low pitch angle and that the skew angle makes little difference. The most important variable in how effective pulsed plasma jets are is the distance between the jets and the com-pression ramp corner, with optimum jet placement being 1.5δupstream of the compression ramp corner. Above 3δ, the effect of the jets abruptly reverses in
magnitude, causing the length scale of the separated region to increase rather than decrease. This suggests the boundary layer mixing induced by the jets dies out relatively quickly. A peak actuation effectiveness was also found at a pulse frequency Strouhal number of 0.018, which agrees with similar findings by Caraballo et al.[33] and is consistent with findings that the instabilities in the separated region have a maximum amplitude at a Strouhal number of about 0.025.
Finally, it was shown using PIV that pulsed plasma jets can also de-crease the skin friction and overall thickness of the boundary layer downstream of the shock interaction at the expense of making the boundary layer some-what more prone to separation. This would seem to indicate that reducing the size of the separated region is counterproductive if the goal is to mini-mize flow distortion downstream of the SWBLI. It might be more productive to move the jets farther upstream of the separated region and increase the size of the separated region in order to reduce the strength of the separation shock and possibly reduce distortion in the boundary layer downstream of the interaction.
A significant amount of work remains to turn pulsed plasma jet actu-ation into a practical solution to the problem of SWBLI. Specifically, a large amount of optimization can still be done within the actuator parameter space to find a configuration which maximizes the observed effects. The effect of larger arrays is also an important consideration which needs to be addressed. However, this approach shows promise, and should be an important line of
Bibliography
[1] Gary S. Settles, Thomas J. Fitzpatrick, and Seymour M. Bogdonoff. Detailed study of attached and separated compression corner flowfields in high reynolds number supersonic flow. AIAA Journal, 17(6), June 1979.
[2] J-P Dussauge and S Piponniau. Shock/boundary-layer interactions: Possible sources of unsteadiness. Journal of Fluids and Structures, 24(8):1166– 1175, 2008.
[3] Noel T Clemens and Venkataswaran Narayanaswamy. Shock/turbulent boundary layer interactions: review of recent work on sources of unsteadi-ness. AIAA Paper, 3710:2009, 2009.
[4] Venkateswaran Narayanaswamy, Laxminarayan L Raja, and Noel T Clemens. Characterization of a high-frequency pulsed-plasma jet actuator for su-personic flow control. AIAA journal, 48(2):297–305, 2010.
[5] J E Green. Interactions between shock waves and turbulent boundary layers. In Progress in Aerospace Sciences 11, pages 235–340, 1970. [6] J Smits Alexander and Kin-Choong Muck. Experimental study of three
shock wave/turbulent boundary layer interactions. Journal of Fluid Mechanics, 1(182):291–314, 1987.
[7] Joshua C Anyiwo and Dennis M Bushnell. Turbulence amplification in shock-wave boundary-layer interaction. AIAA Journal, 20(7):893–899, 1982.
[8] Jean M Delery. Experimental investigation of turbulence properties in transonic shock/boundary-layer interactions. AIAA Journal, 21(2):180– 185, 1983.
[9] J Andreopoulos, KC Muck, JP Dussauge, AJ Smits, and MS Selig. Turbulence structure in a shock wave/turbulent boundary-layer interaction. AIAA journal, 27(7):862–869, 1989.
[10] W R Seebaugh, M E Childs, and Gerald C Paynter. Shock-wave reflection from a turbulent boundary layer with mass bleed. Journal of Aircraft, 5(5):461–467, 1968.
[11] Jan Syberg and Joseph L Koncsek. Bleed system design technology for supersonic inlets. Journal of Aircraft, 10(7):407–413, 1973.
[12] R. W. Cubbison, E. T. Meleason, and David F. Johnson. Effect of porous bleed in a high-performance axisymmetric mixed compression inlet at mach 2.5. Nasa tm x-1692, Lewis Research Center, Cleveland, OH, November 1968.
[13] George McLafferty and E. Ranard. Pressure losses and flow coefficients of slanted perforations discharging from within a simulated supersonic inlet.
Technical report, United Aircraft Corporation, Research Department, 1958.
[14] J. M. Delery. Shock wave/turbulent boundary layer interaction and its control. Prog. in Aerospace Sci., 22:209–280, 1985.
[15] H. T. Nagamatsu, W. B. Brower, Jr. L. Bahi, and J. Ross. Investigation of passive shock wave-boundary layer control for transonic airfoil drag reduction final report. Technical report, Rensselaer Polytechnic Institute, Troy, NY, April 1982.
[16] D. J. Peake. The use of air injection to prevent separation of the turbulent boundary layer in supersonic flow. Technical report, Ministry of Aviation Aeronautical Research Council, 1966.
[17] Michael S. Selig and Alexander J. Smits. Effect of periodic blowing on attached and separated supersonic turbulent boundary layers. AIAA Journal, 29(10):1651–1658, 1991.
[18] JC Westkaemper and JW Whitten. Drag of vane-type vortex generators in compressible flow. Journal of Spacecraft and Rockets, 7(10):1269–1271, 1970.
[19] David K Gartling. Tests of vortex generators to prevent separation of su-personic flow in a compression corner. Technical report, DTIC Document, 1970.
[20] H. Babinsky, Y. Li, and C. W. Pitt Ford. Microramp control of supersonic oblique shock-wave/boundary-layer interactions. AIAA Journal, 47(3), March 2009.
[21] Paul L. Blinde, Ray A. Humble, Bas W. van Oudheusden, and Fulvio Scarano. Effects of micro-ramps on a shock wave/turbulent boundary layer interaction. Shock Waves, 19:507–520, 2009.
[22] P. Bueno, Y. Hou, N. Clemens, and D. Dolling. A piv study on the effect of pulsed-jet injection upstream of a mach 2 shock wave/turbulent boundary layer interaction. InICIASF ’03. 20th International Congress on Instrumentation in Aerospace Simulation Facilities, pages 59–69, aug. 2003.
[23] L. J. Souverein and J. F. Debi`eve. Effect of air jet vortex generators on a shock wave boundary layer interaction. Experiments in Fluids, 49:1053– 1064, 2010.
[24] R. A. Wallis. A preliminary note on a modified type of air jet for bound-ary layer control. Technical report, Ministry of Aviation, May 1956. [25] Lindsay J. Lina and III Wilmer H. Reed. A preliminary flight
investiga-tion of the effects of vortex generators on separainvestiga-tion due to shock. Naca rm l50j02, Langley Aeronautical Laboratory, Langley, VA, November 1950.
[26] John C Lin. Review of research on low-profile vortex generators to control boundary-layer separation. Progress in Aerospace Sciences, 38(4–5):389– 420, 2002.
[27] Piotr Doeffer and Ryszard Szwaba. Shock wave-boundary layer interac-tion control by streamwise vortices. In XXI ICTAM, aug 2004.
[28] S. H. Zaidi, T. Smith, S. Macheret, and R. B. Miles. Snowplow surface discharge in magnetic field for high speed boundary layer control. In44th AIAA Aerospace Sciences Meeting and Exhibit, January 2006.
[29] Chiranjeev S. Kalra, Mikhail N. Shneider, and Richard B. Miles. Numerical study of boundary layer separation control using magnetogasdynamic plasma actuators. Physics of Fluids, 21(10):106101, 2009.
[30] Brent Pafford, Jayant Sirohi, and Laxminarayan L Raja. Propagating-arc magnetohydrodynamic plasma actuator for directional high-authority flow control in atmospheric air. Journal of Physics D: Applied Physics, 46(48):485208, 2013.
[31] Jesse Little, Keisuke Takashima, Munetake Nishihara, Igor Adamovich, and Mo Samimy. Separation control with nanosecond-pulse-driven dielec-tric barrier discharge plasma actuators. AIAA journal, 50(2):350–365, 2012.
[32] Yurii G. Utkin, Saurabh Keshav, Jin-Hwa Kim, Jeff Kastner, Igor V. Adamovich, and Mo Samimy. Development and use of localized arc
filament plasma actuators for high-speed flow control. Journal of Physics D: Applied Physics, 40:685–694, 2007.
[33] E. Caraballo, N. Webb, J. Little, J.-H. Kim, and M. Samimy. Supersonic inlet flow control using plasma actuators. In 47th Aerospace Sciences Meeting, January 2009.
[34] Nathan Webb, Christopher Clifford, and Mo Samimy. Preliminary results on shock wave/boundary layer interaction control using localized arc fil-ament plasma actuators. In41st AIAA Fluid Dynamics Conference and Exhibit, 2011.
[35] Nathan Webb, Christopher Clifford, and Mo Samimy. Control of oblique shock wave-boundary layer interactions using plasma actuatorsa. In 6th AIAA Flow Control Conference, 2012.
[36] Thomas C Corke, C Lon Enloe, and Stephen P Wilkinson. Dielectric barrier discharge plasma actuators for flow control*. Annual Review of Fluid Mechanics, 42:505–529, 2010.
[37] J Reece Roth, Daniel M Sherman, and Stephen P Wilkinson. Boundary layer flow control with a one atmosphere uniform glow discharge surface plasma. American Institute of Aeronautics and Astronautics, 1998. [38] David M Schatzman and Flint O Thomas. Turbulent boundary-layer
sep-aration control with single dielectric barrier discharge plasma actuators.
[39] Martiqua L Post and Thomas C Corke. Separation control on high angle of attack airfoil using plasma actuators. AIAA journal, 42(11):2177– 2184, 2004.
[40] David Greenblatt, Berkant Goeksel, Ingo Rechenberg, Chan Yong Sch¨ule, Daniel Romann, and Christian O Paschereit. Dielectric barrier dis-charge flow control at very low flight reynolds numbers. AIAA journal, 46(6):1528–1541, 2008.
[41] D. V. Roupassov, A. A. Nikipelov, M. M. Nudnova, and A. Yu Starikovskii. Flow separation control by plasma actuator with nanosecond pulsed-periodic discharge. AIAA Journal, 47(1), January 2009.
[42] S Im, H Do, and MA Cappelli. Dielectric barrier discharge control of a turbulent boundary layer in a supersonic flow. Applied Physics Letters, 97(4):041503–041503, 2010.
[43] Munetake Nishihara, Keisuke Takashima, JW Rich, and IV Adamovich. Mach 5 bow shock control by a nanosecond pulse surface dielectric barrier discharge. Physics of Fluids (1994-present), 23(6):066101, 2011.
[44] N Webb, C Clifford, and M Samimy. An investigation of the control mechanism of plasma actuators in a shock wave-boundary layer interac-tion. 2013.
[45] K. R. Grossman, B. Z. Cybyk, and D. M. VanWie. Sparkjet actuators for flow control. In 41st Aerospace Sciences Meeting and Exhibit, January
2003.
[46] Samuel G Mallinson, John A Reizes, Guang Hong, and M Buttini. Synthetic jet actuators for flow control. International Society for Optics and Photonics, pages 146–156, 1999.
[47] Venkateswaran Narayanaswamy. Investigation of a pulsed-plasma jet for separation shock/boundary layer interaction control. PhD thesis, The University of Texas at Austin, Texas, dec 2010.
[48] S. Haack, T. Taylor, B. Cybyk, C. Foster, and F. Alvi. Experimental estimation of sparkjet efficiency. In 42nd AIAA Plasmadynamics and Lasers Conference, volume 3. AIAA, June 2011.
[49] Kellie V Anderson and Doyle D Knight. Plasma jet for flight control.
AIAA journal, 50(9):1855–1872, 2012.
[50] Pierrick Hardy, Philippe Barricau, Antoine Belinger, Daniel Caruana, Jean-Pascal Cambronne, and Christian Gleyzes. Plasma synthetic jet for flow control. In 40th Fluid Dynamics Conference and Exhibit, AIAA-2010-5103, Chicago, Illinois, 2010.
[51] Venkateswaran Narayanaswamy, Laxminarayan L Raja, and Noel T Clemens. Control of unsteadiness of a shock wave/turbulent boundary layer interac-tion by using a pulsed-plasma-jet actuator. Physics of Fluids, 24:076101, 2012.
[52] Mehmet E Erengil and David S Dolling. Unsteady wave structure near separation in a mach 5 compression rampinteraction. AIAA journal, 29(5):728–735, 1991.
[53] C-C Sun and Morris E Childs. A modified wall wake velocity profile for turbulent compressible boundary layers. Journal of Aircraft, 10(6):381– 383, 1973.
[54] C-C Sun and ME Childs. Wall-wake velocity profile for compressible nonadiabatic flows. AIAA Journal, 14(6):820–822, 1976.
[55] Douglas C Mathews, Morris E Childs, and Gerald C Paynter. Use of coles’ universal wake function for compressible turbulent boundary layers.
Journal of Aircraft, 7(2):137–140, 1970.
[56] Gary S. Settles, Irwin E. Vas, and Seymour M. Bogdonoff. Details of a shock-separated turbulent boundary layer at a compression corner. AIAA Journal, 14(12):1709–1715, December 1976.
Vita
Benton Robb Greene was born in Bryan, Texas in 1988. After com-pleting high school in Belton, Texas in 2006, he attended the University of Texas at Austin. He received the Bachelor of Science degree in Aerospace Engineering with a minor in Spanish Language from the University of Texas at Austin in December, 2010.
Permanent address: [email protected]
This thesis was typeset with LATEX† by the author.
†LATEX is a document preparation system developed by Leslie Lamport as a special version of Donald Knuth’s TEX Program.


![Figure 3.5: Percent change in separation length vs. pulse frequency to the Strouhal number associated with the instability in a compression ramp interaction found by Erengil and Dolling [52]](https://thumb-us.123doks.com/thumbv2/123dok_us/276735.2528450/39.918.227.707.193.553/percent-separation-frequency-strouhal-associated-instability-compression-interaction.webp)
