Clemson University Clemson University
TigerPrints
TigerPrints
All Theses Theses
December 2019
Life Cycle Assessment of Small Modular Reactors Using U.S.
Life Cycle Assessment of Small Modular Reactors Using U.S.
Nuclear Fuel Cycle
Nuclear Fuel Cycle
Kara Michelle GodseyClemson University, [email protected]
Follow this and additional works at: https://tigerprints.clemson.edu/all_theses
Recommended Citation Recommended Citation
Godsey, Kara Michelle, "Life Cycle Assessment of Small Modular Reactors Using U.S. Nuclear Fuel Cycle" (2019). All Theses. 3235.
https://tigerprints.clemson.edu/all_theses/3235
This Thesis is brought to you for free and open access by the Theses at TigerPrints. It has been accepted for inclusion in All Theses by an authorized administrator of TigerPrints. For more information, please contact
LIFE CYCLE ASSESSMENT OF SMALL MODULAR REACTORS USING U.S. NUCLEAR FUEL CYCLE
A Thesis Presented to the Graduate School of
Clemson University In Partial Fulfillment
of the Requirements for the Degree Master of Science
Environmental Health Physics by
Kara Godsey December 2019
Accepted by:
Dr. Lindsay Shuller-Nickles, Committee Chair Dr. Timothy DeVol
ii ABSTRACT
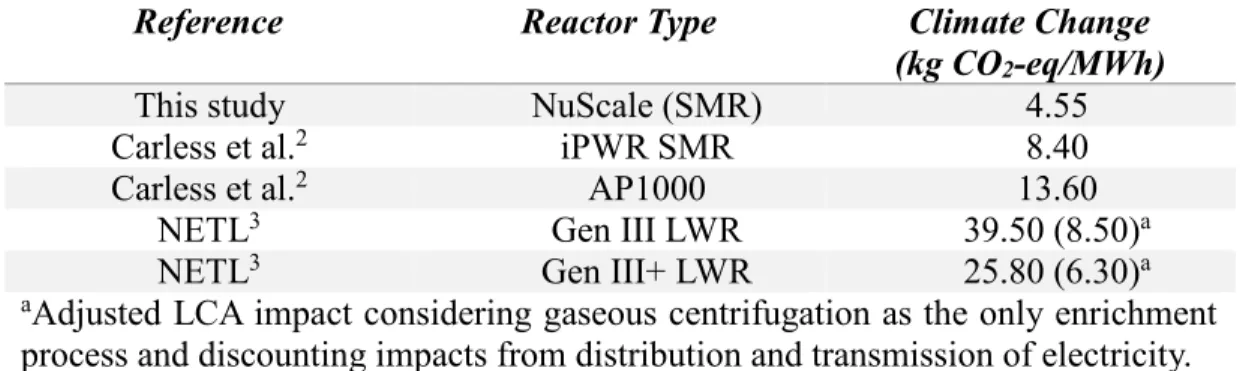
In an ever-evolving energy market, it is vital that nuclear technology adapts to become more economically and environmentally feasible. The promising economics and flexibility of small modular reactors (SMRs) may make them the technology of the future for the nuclear industry, offering a simple solution to many of the problems that have plagued the industry in the last decade. Though the economics of SMRs is often a topic of discussion, it is also important to understand the environmental aspects of this technology when implemented in a U.S. market. A life cycle assessment (LCA) of small modular reactors using a U.S. nuclear fuel cycle has been performed to this end, taking care to use U.S. technologies and facilities in every stage of the assessment where possible. The resulting impacts per MWh of electricity produced were found to be 7.64 m3 for water depletion, 0.88 kg oil-eq for fossil depletion, 2.03 kg Fe-eq for metal depletion, 4.55 kg CO2-eq for climate change, 18.02 1,4-DB-eq for human toxicity, and 441.07 kBq 235U-eq for ionizing radiation. In terms of climate change, the results were found to be comparable to the 8.4 kg CO2-eq found by Carless et. al1 for the Westinghouse SMR and like the 3.89 kg CO2-eq found by adjusting the findings of the National Energy Technology Laboratory.2 Most of the climate change impact was found to be in the fuel processing stages, due to high electricity and fossil fuel demands, as well as in construction because of concrete production. These assumptions were verified by performing a sensitivity analysis on electricity source, mine types, transportation, and material disposition during decommissioning. By comparison to other energy generators, nuclear energy, in general, performs similarly to renewable resources with respect to climate change, and small
modular reactors perform slightly better than their larger counterparts. These results aid in confirming the overall feasibility of small modular reactor technology in an energy market concerned with climate change impacts.
ACKNOWLEDGEMENTS
I would like to thank my advisor, Dr. Lindsay Shuller-Nickles, as well as my co-advisor Dr. Michael Carbajales-Dale for their support and guidance throughout this project. Additionally, I would like to thank the Energize! team for inspiring thought and discussion about the U.S. electricity grid and how future energy needs may be met, and I would like to thank NuScale Power for providing me with operational and construction data for SMRs and being available to answer my questions.
TABLE OF CONTENTS
Page
I. ABSTRACT ... ii
II. ACKNOWLEDGEMENTS ... iv
III. LIST OF TABLES ... vii
IV. LIST OF FIGURES ... viii
V. CHAPTER ONE ... 1
VI. CHAPTER TWO ... 5
Life cycle Assessment ... 5
The Nuclear Fuel Cycle ... 8
Mining ... 9
Milling ... 11
Purification and Conversion ... 12
Enrichment ... 13 Fuel Fabrication ... 14 Waste Management ... 14 SMR Technology ... 16 Construction ... 17 Operation ... 17 Decommissioning ... 18
VII. CHAPTER THREE ... 19
Life cycle Inventory Assumptions ... 19
Mining and Milling ... 20
Conversion ... 22
Enrichment ... 23
Fuel Fabrication ... 23
Construction of SMR ... 25
Operation of SMR ... 25
Decommissioning of SMR ... 26
Transportation ... 28
Impact Assessment ... 31
Data Quality Analysis ... 34
Sensitivity Analysis ... 35
VIII. CHAPTER FOUR ... 38
LCIA results ... 38
Data Quality Analysis ... 41
Sensitivity Analyses ... 43
Comparison with Other LCAs ... 50
Comparison to Other Energy Generators ... 53
Considerations for New Technology ... 54
IX. CHAPTER FIVE ... 55
X. APPENDICES ... 58
A: Equations Used ... 59
B: Inventory Data ... 60
LIST OF TABLES
Table Page
3.1. Distribution of uranium resources assumed in this analysis
by country and mine type. ... 21 3.2. Sources of uranium used in the conversion stage ... 22 4.1. Midpoint impacts based on the “base-case” inventory assessment. ... 38 4.2. Comparison of climate change impacts between Carless et. al,2
the National Energy Technology Laboratory,3 and this
assessment for nuclear energy technology. ... 53 B.1. Bill of Materials for the base case LCA, including the name,
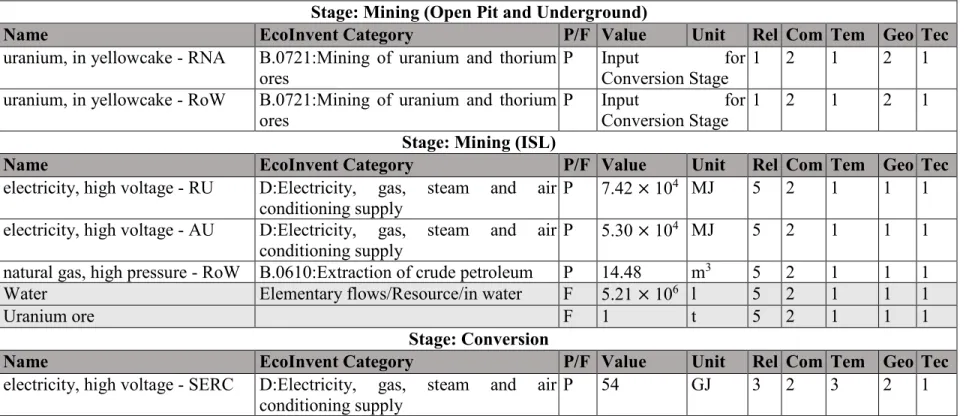
EcoInvent category (if applicable), designation of process (P) or flow (F), and the quantity for all inputs and outputs in the LCA stages. Output materials are denoted with light grey shading versus input materials without shading. Where applicable, the data quality assessment is also included for reliability (Rel.), completeness (Com.), temporal correlation (Tem.),
geographical correlation (Geo.), and technological correlation (Tec.). ... 60 B.2. Data used to determine impacts associated with transportation
throughout the fuel cycle based on total distance traveled,
LIST OF FIGURES
Figure Page
2.1 Diagram of the stages included in a typical life cycle assessment.15 ... 6 2.2. Illustration of SMR life-cycle phases (orange boxes) including
fuel cycle steps (blue boxes), where SMR operations connects both the nuclear fuel cycle steps with the
life-cycle phases. ... 8 2.3. Diagram of the traditional uranium milling process, which utilizes solvent
extraction (SX) to separate uranium from the dissolved ore.21 ... 11 2.4. Schematic of a dry cask for storage of SNF.30 ... 15 3.1. Map showing approximate locations for the U.S. fuel cycle
facilities as well as the line-of-sight transportation
paths between all stages of the LCA. ... 29 3.2. Overview of the analyses implemented in the impact
assessment as performed using the ReCiPe database. The flowchart is modified from
Dreicer et al. 199573 and Frischknecht et al. 2000.71 ... 34 3.3. EcoInvent pedigree matrix with descriptions of the quality
ranks 1-3. All data used in this work ranked 3 or below.61 ... 35 4.1. Distribution of impacts among the life cycle stages for
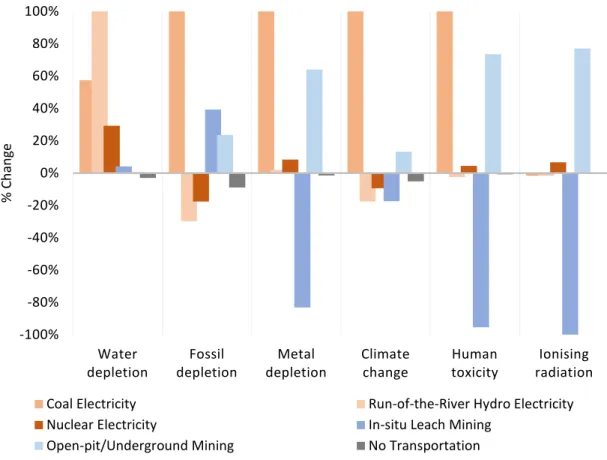
small-modular reactor technology. ... 40 4.2. Percent change in life cycle impacts (legend) based on
different scenarios (x-axis) as compared with the
base-case fuel cycle analysis. ... 47 4.3. Percent change in impacts based on materials usage
4.4. Bar graph marking the maximum and minimum LCA climate change impacts of various electricity generators (kg CO2-eq/MWh). The nuclear SMR minimum is from this study and the maximum is from Carless et al.2
All other maximum and minimum values are from OpenEI.82 ........ 54
CHAPTER ONE INTRODUCTION
Many questions about the future of the nuclear industry have arisen in the wake of the cancellation of two units under construction in Jenkinsville, South Carolina in 2018 after a decade of construction and $4.9 billion invested.3 Prior to their cancellation, Units 2 and 3 at the Virgil C. Summer Nuclear Operating Station (VC Summer) were among the first nuclear generators in the U.S. to be fully constructed and brought online in the 21st Century, alongside Southern Company’s Plant Vogtle Units 3 and 4 near Waynesboro, GA.4 Initially proposed in 2008, the hurdles of licensing, equipment procurement, engineering design, and actual construction have caused the project to go beyond its initial schedule, as well as the initially projected costs. In 2017, Westinghouse Electric Company, the primary construction contractor for the project, filed for bankruptcy, leading project partner Santee Cooper to withdraw. With construction only 33.7% complete,5 the future for these units is grim.
While the events at VC Summer were plagued with additional burdens, such as possible financial mismanagement, the fate of the new units at VC Summer are a hallmark of the nuclear industry - behind schedule and over budget. For a future energy market that is competitive, affordable, and largely composed of low-carbon technologies, it is necessary, at least with the current state of renewable energy technologies, that nuclear energy be a part of the picture. To remain competitive in the face of cheaper natural gas and subsidized renewable energy, the nuclear industry must find ways to reduce the cost of construction and overall investment burdens associated with the commissioning of a new facility. A
lesson in cost cutting is exemplified in the automobile industry, where mass manufacturing and standardization of products reduced the average price of an automobile from $825 in 1908 to $575 in 1912.6 This trend has continued for the production of many products into the 21st century, and, notably, the same solution has been proposed for the nuclear industry in the form of small modular reactors.
Small modular nuclear reactors (SMRs), defined by the Nuclear Regulatory Commission as any light-water reactor producing under 300 MWe,7 while a new actionable concept to the commercial nuclear power industry, are not a new technology. Designs for SMRs have been utilized in many places across the globe. In the United States, the most common use for a small reactor is in nuclear submarines and aircraft carriers for the Navy, but small reactors have also been used for various research applications.8 Despite the many historical applications of SMR technology, previous designs are not necessarily applicable in a commercial environment, particular due to the fact that naval small reactors operate using highly enriched uranium (HEU) fuel9—which is why many companies have taken on the task of developing SMR technology for use in a commercial fleet. In March of 2018, the U.S. Department of Energy (DOE) developed and sponsored the Small Modular Reactor Licensing Technical Support program to support various entities through cost-shared funding for the development and maturation of SMR designs.10 Thus far, mPower, NuScale, Westinghouse, and Holtec have submitted design applications and site permits to the NRC. 7
Some of the primary drivers for innovation in SMR technology are the reduced up-front construction costs and attractive technological and safety features offered by the small
modular design. As is exemplified by the example of VC Summer, projects undertaking the task of constructing a large nuclear power plant face significant capital investments, long construction, and they are also limited in siting by their large generation capacity. The smaller capacity offered by an SMR is beneficial in places where there are incremental changes in the electricity demand, the demand itself is smaller than the capacity offered by conventional nuclear reactors, or there are siting issues based on the safety risk presented by a large facility. Additionally, one of the major advantages for SMR technology is the ability for many of the major components in the steam cycle to be manufactured in a factory as a single module.11 Carless et al. found that, while SMRs do not differ greatly in overall costs of operation from their traditional counterparts, the flexibility, modularity, and adaptability of SMRs offer both a technological and economical advantage.1
If SMRs are to lead to a new generation of growth for the nuclear industry, then environmental implications, as well as the economic implications, of specific SMRs should be quantified. Part of the appeal of nuclear energy, beyond its ability to provide reliable energy, is its ability to deliver this energy with much lower carbon emissions compared to fossil fuel technologies. While there are obvious environmental footprints associated with the nuclear fuel cycle (i.e.,mining) and power plant construction, the generation of nuclear energy is relatively free of carbon emissions.12 While traditional nuclear technology has been the subject of some previous life cycle assessments (LCAs)13,14, the environmental impacts of the SMR life cycle has rarely been explored using life cycle assessment. This is, in part, due to the lack of available data on SMR fuel cycle processes, despite their frequent use in places, such as the U.S. Navy. However, design information for various
SMRs are available for review, and assumptions could potentially be made by scaling down certain resources from that of a large nuclear reactor. Considering the possibility of mass production would be relevant to include given the modular nature of this technology, though this is difficult to quantify given current information.
While the possibilities and implications of SMR technology may seem obvious to an expert in energy generation, many people do not know about the intricacies of energy generation. In general, the public does not fully grasp the cause of regional differences in how energy is produced or even know the expanse of energy generation technologies. For example, a layperson interested in sustainable energy options may believe that solar energy technology could be used to support the entire country, rather than as part of a much more diverse energy portfolio. However, solar energy is not economical for all regions and has a lower power density than most energy technologies. As such, solar energy is ideal as a component of a portfolio in certain areas of the world, but not as the sole provider of energy.
Energy education is an important aspect of a growing economy, where the energy demand continues to grow and the urgency of reducing the impact to the planet increases.
Energize! is an interactive, multi-player game funded by the Department of Energy with the goal of educating the technically oriented layperson about the impacts of various energy technologies and the importance of balancing the energy grid in the face of constant and growing demand. As a possible component of a future U.S. energy portfolio, SMRs will be implemented into this game alongside traditional light water reactors (LWRs) and other technologies such as coal, natural gas, hydro, wind, and solar. The work done in this thesis
contributes to the Energize! content, particularly regarding the environmental impacts of SMRs.
The overall goal of this study is to quantify the environmental impacts of producing electricity using small modular nuclear reactor technology. Life cycle assessment facilitates foresight of potential environmental implications of future technologies, which enables companies and taxpayers to make informed decisions about energy technology investments. In this life cycle assessment, the functional unit is the production of 3.6 x 10⁸ MWh of electricity by small modular technology (i.e., one SMR facility containing twelve 60 MWe modules operating at 95% capacity for 60 years).
CHAPTER TWO BACKGROUND Life cycle Assessment
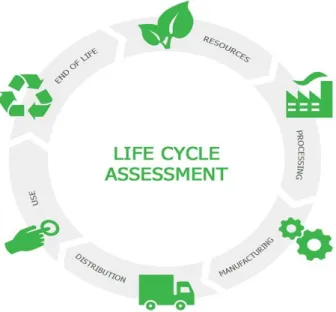
Life cycle assessments (LCAs) are a type of environmental analysis meant to highlight the impacts a product, system, or service has on the environment throughout its lifetime. In general, LCAs begin at resource extraction (the “cradle”) and end at disposal or recycling of the final product (the “grave”). A diagram of the components typically included in an LCA is shown in Figure 2.1.15
Typically, resource extraction is the initial stage considered in an LCA and accounts for sourcing all the resources needed for the product or process of interest. For most products or processes, the resource extraction stage consists of mining operations. The processing of the extracted materials is considered, which could include refining or purifying a mined material. The manufacturing stage includes the process(es) that bring the
product/service to its final form before being delivered to the consumer or user. For example, in the case of a water bottle, this would be the stage in which the bottle itself was constructed from the processed plastic. Distribution is the transportation that occurs between different stages of the life cycle, most notably between the manufacturing
and use stage. The use stage is the phase in which the product or service is utilized by the consumer for a specific purpose, such as the use of a washing machine to clean clothes. And, finally, the end of life stage considers the final disposal or storage of a product, including any recycling or reuse.16
In an LCA, material flows to and from the environment, as well as the economy, are typically tracked. These flows, in the case of life cycle assessment, must be quantifiable in terms of a given product and incudes both “inputs” and “outputs” to a process relative to the environment (or the technosphere). For example, it will take a certain number of kilograms of concrete to produce a building; the concrete is a flow into this process, and the building is the product. Because the effects of producing a single product are vast and difficult to capture in their entirety, it is necessary in an LCA to define the scope (or boundary conditions) of the assessment. For example, in assessing the impacts of
Figure 2.1. Diagram of the stages included in a typical life cycle assessment.15
producing a spiral notebook, it is probably irrelevant to consider the amount of coffee consumed by the employees of the wood pulping company. A clear goal definition is necessary to determine the appropriate project scope, which includes definition of key impact categories and the life cycle stages. These definitions of a goal and scope comprises the first of four phases in the LCA framework.16
The second phase in the LCA framework is the compilation of a life cycle inventory (LCI). An LCI is effectively a list of types and quantities of different inputs and outputs for each process in a life cycle. Results from the LCI are used to inform the life cycle impact assessment (LCIA), the third phase, which quantifies the effects of the resource use and releases associated with producing a certain product/service. An impact assessment can be performed using one of several cultural perspectives dictated in the OpenLCA software. The “cultural perspective’ dictates the weighting scheme applied to the various impacts when summarizing into impact categories, and the available options are Hierarchical (H), Individualist (I), and Egalitarian (E). These weighting schemes are based on differing assumptions about time periods and whether technological advancements will be available to deal with the impacts. The Individualist perspective is a short-term optimistic viewpoint; the Hierarchical perspective is one which assumes a medium-length time period and makes no assumption as to the ability of future technology to handle or avoid impacts; and the Egalitarian perspective focuses on a long-term time period with a more pessimistic approach to potential results of impacts.17 The third and final phase of the LCA framework, an interpretation, can, and should, be performed on these results, speculating on the cause of discrepancies, suggesting improvements to future studies,
acknowledging limitations, etc. The first three phases, however, are the only phases required for the LCA to meet the standards outlined by the International Standards Organization for LCA analyses.16
The Nuclear Fuel Cycle
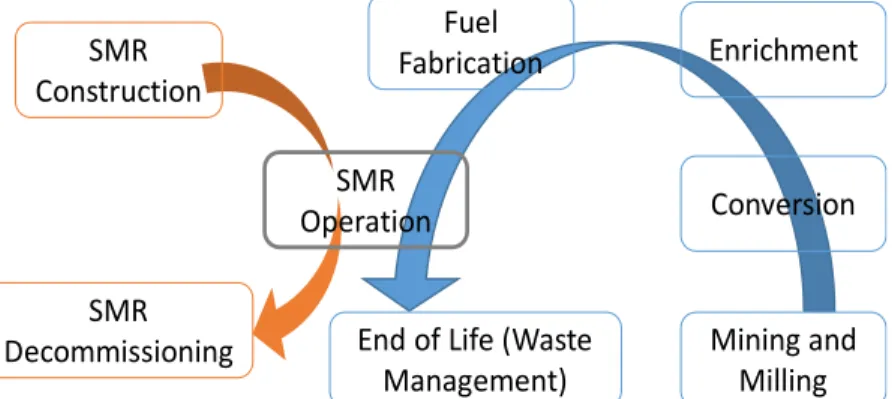
The nuclear fuel cycle, shown in Figure 2. 2, is composed of many stages, all of which contribute to the environmental footprint of a given nuclear energy technology. The U.S. currently utilizes the once-through nuclear fuel cycle, which will be modeled in the proposed LCA. A once-through (or open) nuclear fuel cycle does not include reprocessing and recycling of used nuclear fuel. That is, the fuel fabricated for use in the reactor is only used once, after which the used fuel is cooled and stored on site for eventual disposition in a deep geological disposal facility. The proposed LCA is focused on a comparison of a small modular LWR with a traditional LWR; therefore, the comparison of an open vs. closed fuel cycle is beyond the scope of this work. While the amount of fuel used in a SMR differs from that of a traditional nuclear power plant, the front end and back end fuel cycle
Figure 2. 2. Illustration of SMR life-cycle phases (orange boxes) including fuel cycle steps (blue boxes), where SMR operations connects both the nuclear fuel cycle steps with the life-cycle
phases. SMR Operation SMR Construction SMR
Decommissioning End of Life (Waste
Management) Mining and Milling Conversion Enrichment Fuel
processes are the same. Differences are highlighted in construction, operation, and decommissioning, primarily related to reactor design in terms of the fuel needed per energy produced.
Many life cycle assessments on nuclear technology utilize the EcoInvent inventory database, which is based on a European “closed” fuel cycle. In the EcoInvent inventory database, all entries for nuclear technology are derived from a closed fuel cycle and a Swiss reactor design.18 Though this method may be appropriate for rough estimates of nuclear impacts, it does not truly capture the impacts of an open fuel cycle utilizing domestic, U.S. facilities and U.S.-based technologies. Thus, in order to assess the environmental impacts of the small modular reactor technology, a life-cycle inventory was built for a closed, U.S. fuel cycle utilizing domestic facilities where possible. Transportation between the fuel cycle steps, including the often-vast distances traveled between the mine site and conversion facilities, is captured. These fuel cycle processes are detailed in the following sections.
Mining
One of the most environmentally impactful steps of any industry, mining presents significant ecological and human health risks. In the nuclear power industry, the primary element that is mined for use as fuel is uranium. Uranium ore is found in many locations across the globe and is procured in several fashions. The method by which the uranium is mined largely depends on the geology of the region, a factor which also helps determine the purity and accessibility of the uranium that is mined. The countries that produce the largest amounts of uranium are Kazakhstan, Niger, Namibia, Australia, and Canada.19 The
three primary modes by which uranium is extracted from the earth include underground, open-pit, and in situ leach mining. Worldwide, open-pit and underground mining efforts represent 42% of all uranium mined, in situ leach mining represents 51%, and the remaining 7% is mined as a by-product of other resources, such as gold or copper.19
Open-pit mining can be employed for near-surface uranium deposits and entails removing the layer of earth from above the uranium deposit, resulting in large accumulation of waste rock. For a uranium deposit further below the surface, underground mining is traditionally used.19 Both open-pit and underground mining lead to environmental concerns due to oxidation of heavy elements and transition metals found in the waste rock and in the remaining exposed rock. Oxidation of the heavy elements and transition metals leads to acid mine drainage, which can greatly impact the pH conditions of local water bodies and devastate associated ecosystems. Further, the oxidation of uranium from a +4 to a +6 oxidation state mobilizes the metal, allowing for transport of uranium in surface or ground water.20 Enhanced mobility due to oxidation contributes to the environmental impact from other heavy metals found in mines (e.g., As, Hg) and presents a significant human health hazard. In addition to the production of heavy metals and acid mine drainage, uranium mines can also expose workers to radon and its alpha-emitting progeny, which presents a human health hazard.
In situ leach mining involves oxidizing and extracting uranium via the use of either an acid or alkaline solution, depending on what other minerals are present in the uranium deposit. The solution is pumped into a permeable geologic layer (e.g., sand) containing uranium and then extracted from the well after the uranium, along with the other metals in
the sand, are oxidized. Because uranium is mobilized underground in the in situ leach process, the use of this mining technology is limited to deposits encased by impermeable rock. Further, these types of deposits, which typically contain low-grade ore, become economical to mine using the in situ leach process.21 Despite the economic advantages of
in situ leaching, as well as the reduced amount of waste rock generated compared to other methods, in situ leaching can be of environmental concern due to the fact that it mobilizes uranium and other heavy metals.
Milling
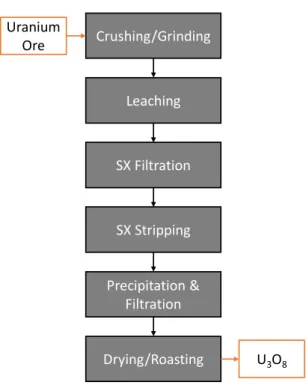
Uranium ore extracted via underground or open pit mining requires a milling process to purify the uranium or remove other metals and materials from the ore. Conventional milling involves crushing the uranium ore, leaching the uranium from the ore using an acidic or alkaline solution, depending on the characteristics of the ore itself, and concentrating the U-bearing solution by stripping solvents with an ammonium sulfate solution and precipitating
ammonium diuranate (ADU) with ammonium gas (Figure 2.3)21. Finally, the ADU is converted to U3O8 by drying/roasting, which yields the final product called “yellowcake”.
Figure 2.3. Diagram of the traditional uranium milling process, which utilizes solvent extraction (SX) to separate uranium from the dissolved ore.21 Crushing/Grinding Leaching SX Filtration SX Stripping Precipitation & Filtration Drying/Roasting Uranium Ore U3O8
The hazards associated with milling come primarily from the production and storage of the associated wastes, which are called mill tailings. The exact percentage of uranium ore that contributes to mill tailings depends on the grade of the ore being mined, but can be as much as 99.9% for a 0.1% grade ore.21 The heavy metals associated with the uranium ore can be mobilized during the milling process and present a risk to the environment. It should also be noted that, because the percentage of the ore contributing to mill tailings is so large and because these tailings include daughters in the 238U decay chain, a large fraction of the total radioactivity of the ore is present in the mill tailings; an estimated 85% of the radioactivity in the uranium ore goes to mill tailings.21
In general, mill tailings are stored in reinforced retention ponds on site. These ponds are typically exposed to the atmosphere and subject to erosion over time, which increases the risk of heavy metals and radionuclides spreading into the environment. Of interest is 222Rn, a daughter in the 238U decay chain. Because 222Rn is present as a gas, it presents an inhalation risk to workers or by persons nearby both uranium mining and milling operations. Further, the alpha-emitting radon daughters (particularly 218Poand 214Po) can cause significant damage to lung tissue and other respiratory organs.21
Purification and Conversion
Following milling, uranium in the form of yellow cake (i.e., either ammonium diuranate or U3O8) remains only 70-90% purified, and so milling is usually followed by the simultaneous purification and conversion of the yellow cake to UF6, which is the form of uranium used for enrichment.22 The most common methods for conversion are the dry hydrofluor and wet solvent extraction processes. The hydrofluor process first involves
grinding the impure-U3O8 into a very fine powder, feeding it into a fluidized bed reactor at high temperatures (between 1000-1200 °F), reducing by hydrogen, interacting with anhydrous fluorine, and then treating with fluorine gas to result in UF6. The wet solvent extraction process is very similar to the hydrofluor process, with the exception that the U3O8 is first treated via solvent extraction to remove impurities.22 In the U.S., only the hydrofluor, also called dry conversion, process is used.23 In fact, the U.S. conversion facility is the only facility that uses the hydrofluor process. Thus, a U.S.-specific inventory includes significantly different flows of material and energy associated with the conversion and purification processes.
Enrichment
Although many methods of uranium enrichment have been explored throughout the history of the nuclear industry and still more have been proposed, there is only one method that is currently employed in U.S. production: gas centrifugation.24 The gas centrifugation utilizes a series of rotating drums that force the heavier 238UF6 gas to the outer walls, separating the heavy 238UF6 from the light (and fissile) 235UF6. The heavy and light molecules are evacuated, separately, as a depleted and enriched uranium hexafluoride gas. In practice, thousands of gas centrifuges operate in sequence for increased throughput. Gas centrifugation is much more energy efficient than its predecessors, such as magnetic separation (via the calutrons) and gaseous diffusion.22
The only operating uranium enrichment plant in the United States is owned by Uranium Enrichment Corporation (URENCO) and located in Eunice, New Mexico. The URENCO plant is licensed to enrich uranium up to 5.5% U-235 and operates at 4.8 million SWU per
year, providing roughly 1/3 of the total enrichment demand for the United States nuclear reactor fleet, the remainder either being imported or a resulted of weapons-grade uranium down-blended. The down-blending of weapons uranium was not considered in this analysis. The energy requirements of gas centrifuge plants are, on average, 40 kWh per SWU.25
Fuel Fabrication
Once the uranium has been purified, converted, and enriched to the desired percentage, it is then shipped to one of three existing fuel fabrication facilities in the U.S.: Global Nuclear Fuel-Americas in Wilmington, North Carolina; Westinghouse Columbia Fuel Fabrication Facility in Columbia, SC; and AREVA, Inc. in Richland, Washington.26 The enriched UF6 is received from the enrichment plant as a solid and reheated to a gas. The UF6 gas is then chemically treated to produce UO2 powder, pressed into a pellet, and sintered. The sintered pellets are loaded into zircalloy fuel rods (also manufactured at the fuel fabrication facility), which are arranged into fuel-assemblies. The size of the fuel rods and fuel assemblies depends on the reactor design.26 There is little information about how this process might change with the introduction of SMR technology. One may presume that fuel fabrication facilities could also manufacture the modules, in addition to the fuel assemblies, for SMRs.
Waste Management
The waste management step in the nuclear fuel cycle pertains to the handling and storage of nuclear fuel after it has been irradiated, or “spent,” in the reactor. For traditional
the reactor core and replaced with fresh assemblies.27 Following this removal, the fuel assemblies are still extremely hot, both in terms of thermal heat and the high amounts of radiation being released due to the short-lived fission and activation products in the fuel. Therefore, the assemblies must be cooled for a period after their removal from the reactor core prior to any further storage or reprocessing. Initial cooling occurs in wet pool storage. At a nuclear facility, there are pools filled with borated water and reinforced with several feet of concrete and steel, typically 40 feet deep, where the assemblies are mechanically placed.28 This cooling period is typically between five and ten years,28 although lack of options for post-cooling storage has led many nuclear facilities to leave spent fuel in the cooling pools for much longer.
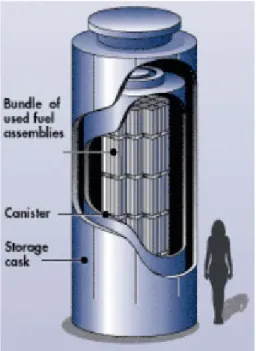
The current commercial fuel cycle in the U.S. is a once-through fuel cycle in which spent nuclear fuel (SNF) is eventually placed into a deep geological repository without any reprocessing or recycling.29 To date, no deep geological repository for spent nuclear fuel has been completed, requiring most nuclear facilities with SNF to move the spent fuel from wet to dry storage. Dry cask storage enables the storage of several SNF assemblies in a steel container, which is typically surrounded by layers of concrete and steel for shielding (Figure 2.4)30. Dry cask containers come in a variety of
Figure 2.4. Schematic of a dry cask for storage of SNF.30
designs and configurations, but they are typically found on concrete pads outside of the reactor building, yet within the facility perimeter.
SMR Technology
Small modular reactors (SMRs) utilize similar technology as a standard nuclear power reactor with the exceptions that the power produced is typically less than 300 MWe for LWR designs, and a large fraction of the equipment is modular by design.31 The modularity is typically captured in the reactor vessel components, such as with the pressurizer, steam generator, reactor core, etc. The advantage of the modular design is that many of these components could be manufactured, assembled into the reactor module, and fueled at a single facility, then shipped directly to the energy production site. This reduces the capital costs and construction time.32
Oregon State University (OSU) began developing an SMR design for a U.S. Department of Energy funded program in 2000 to encourage the development and licensing of commercial SMR technology. The DOE funding for this project officially ended in 2003, but OSU scientists and engineers continued research on the SMR design, with specific aims to implement cooling via natural circulation as a safety feature. In 2007, OSU transferred its SMR designs, as well as use of the test facility it had created for the SMR, to the newly founded NuScale Power.33 Currently, Fluor Corp. is the primary investor in NuScale and is steadily working toward commercialization, with an NRC Design Certification Application underway.34 This SMR design is the furthest in the licensing process of all designs currently seeking licensing from the NRC and thus is the design referenced most often in this analysis.7
Construction
The construction phase of an SMR is one of the ways that it differs the most from a standard LWR. The process of construction for a full-sized nuclear power plant requires a large capital investment and often requires long construction times. Thus, construction of a nuclear power plant often makes nuclear power production less competitive than other energy types. The United States, possibly due to high security standards, has the longest construction time for nuclear power plants than any other country in the world, with a median construction time of 100 months.35 SMRs, by contrast, have a much lower projected construction time. This is in part due to their reduced size as well as the fact that many of an SMR’s components are projected to be mass-producible and shipped to site for assembly. From the initial pouring of concrete to the final physical construction, the time to completion for an SMR is cited by NuScale as 28.5 months. From mobilization to completion, the time is projected to be 51 months.36
Operation
The operation of the NuScale SMR would not differ greatly from that of a LWR in the United States. Light water reactor technology uses water for cooling, moderation, and steam-generation. The NuScale SMR is a pressurized water reactor design, having a primary loop of pressurized water to absorb heat from the reactor core, which exchanges heat to a secondary loop of water in a steam generator.37 The steam generated in the secondary loop turns a turbine (located in the turbine buildings on site) to produce mechanical energy that will then become electricity. Unlike a large PWR, however, no pumps or additional valves are needed to direct the flow of the water in the primary or
secondary loop. Instead, the NuScale SMR design utilizes natural circulation to direct cooled water back into the reactor core after going through the steam generator. In addition to eliminating pumps and valves, the NuScale SMR design also eliminates the need for coolant control via spray systems and implements digital instrumentation and control design. From the digitalized control room, as many as 12 units (modules) can be operated.38
Decommissioning
The decommissioning step in the life cycle of a nuclear reactor includes the steps taken to shut down, decontaminate and/or isolate the radioactive materials residual to former energy production. In the U.S., there are two decommissioning methods typically employed: Decontamination (DECON) and Safe Storage (SAFSTOR). The DECON process involves removing all the major radioactive components from the reactor site, either by disposing as low-level radioactive waste or decontaminating before ultimate disposal. The DECON process is estimated to take approximately 7 years. By contrast, SAFSTOR involves in situ containment of the facility for later decontamination, allowing for much of the radioactivity to decay away before final disposal. The SAFSTOR process is estimated to take about 60 years, 10 of which are for the decontamination activities themselves.39 Like the fuel fabrication step of the fuel cycle, it is uncertain how this process may change with the implementation of modularity. Since the primary system, which contains most of the contamination upon shutdown, is contained within a nuclear module, the impact of modularity on the decommissioning process may be profound. Decommissioning can be a resource intensive process due to the cutting, decontamination, and disposal of contaminated equipment. If there were storage methods for the modules,
such as enlarged dry cask storage, the reduction in resources for this step could greatly impact the life cycle assessment results.
CHAPTER THREE METHODS
The methods employed for this life cycle assessment include the development of the life cycle inventory, the life cycle impact assessment, a data quality assessment, and sensitivity analyses.
Life cycle Inventory Assumptions
As previously discussed, the life cycle inventory includes all of the energy requirements and material flows (i.e., inputs and outputs) associated with each life cycle stage. The OpenLCA platform was used to perform the life cycle assessment in this study. OpenLCA is a convenient, free, and therefore, widely utilized software program within the life cycle assessment community. In fact, many of the processes and material flows necessary to model different stages of an energy production life cycle are readily accessible within OpenLCA through the use of variatious databases. In this work, the EcoInvent database (Version 3.1) was used, which includes datasets on the production of concrete, mining of particular resources, and regionally-produced energy, among other things. Database processes were manually constructed for in-situ leach mining, conversion, enrichment, fuel fabrication, construction, operation, decommissioning, waste management, as well as transportation between each stage. A built-in EcoInvent database was used for underground and open pit (conventional) mining and milling. Assumptions made for each life cycle
stage are detailed in the sections below and summarized in the bill of materials (Table B.1) in Appendix B.
Mining and Milling
The mining and milling of uranium ore extracted via underground or open pit mining were assumed to co-exist at the same site (as is often the case). Therefore, emissions, water and energy use, as well as other parameters for the facility operations are representative of both mining and milling. The distribution of natural uranium used in this study is normalized based on the country of origin, as well as the method of mining. Since the United States uses only 10% of domestically-produced uranium41, the source of natural uranium in this life cycle study assumes a redistribution based on the country of origin of uranium imports. Over 80% of uranium imported into the U.S. comes from only five different countries - Canada, Australia, Russia, Uzbekistan, and Kazakhstan.41 As such, the distribution of the uranium imports considered for this LCA were normalized to consider only uranium mined from these countries. Over 80% of uranium imported into the U.S. comes from only five different countries - Canada, Australia, Russia, Uzbekistan, and Kazakhstan.41 As such, the distribution of the uranium imports considered for this LCA were normalized to consider only uranium mined from these countries (Table 3.1). In 2017, 50% of the world’s uranium was mined via in situ leach mining.21 Of the countries that export uranium to the U.S., Uzbekistan and Kazakhstan have 100% in situ leach mining,42,43 while Australia has approximately 20% in situ leach mining.44 The remaining 80% of major Australian mines are distributed between underground and open pit mining technologies. In Canada, mining occurs entirely through underground and open pit
mining,45 while Russian mines are distributed almost evenly between in situ leach mining and open-pit and underground mining.46
Conveniently, the EcoInvent database includes a process that represents both underground and open-pit uranium mining processes called “uranium, in yellowcake.” The process includes some geographical specificity with options including Regional North America (RNA) and Rest of World (RoW). For countries whose primary production
method was either open-pit or underground mining, the default uranium mining process available in the EcoInvent database was used. The EcoInvent database does not have a process for in situ leach mining, which is responsible for most uranium mined from Kazakhstan and Uzbekistan.42,43 For the ISL mining process, the relationships between ore
Table 3.1. Distribution of uranium resources assumed in this analysis by country and mine type. Country % of U.S. Imports Underground/ Open-Pit (%) Leach (%)In Situ % Contribution of Mined Uranium
Canada45 29.63 100 0 29.63% uranium, in yellowcake
– RNA (EcoInvent) Australia44 22.22% 79.34 20.66
17.63% uranium in yellowcake – RoW (EcoInvent)
4.59% uranium ore from ISL (this study)
Kazakhstan43 24.69% 0 100 24.69% uranium ore from ISL (this study)
Russia46 16.05 55.93 44.07
8.98 % uranium in yellowcake – RoW (EcoInvent)
7.07 % uranium ore from ISL (this study)
Uzbekistan42 7.41 0 100 7.41 % uranium ore from ISL
grade, mine type, and associated emissions or resource usage were calculated to determine the flows for the ISL mining process (Equations 1-4 in Appendix A).47
Conversion
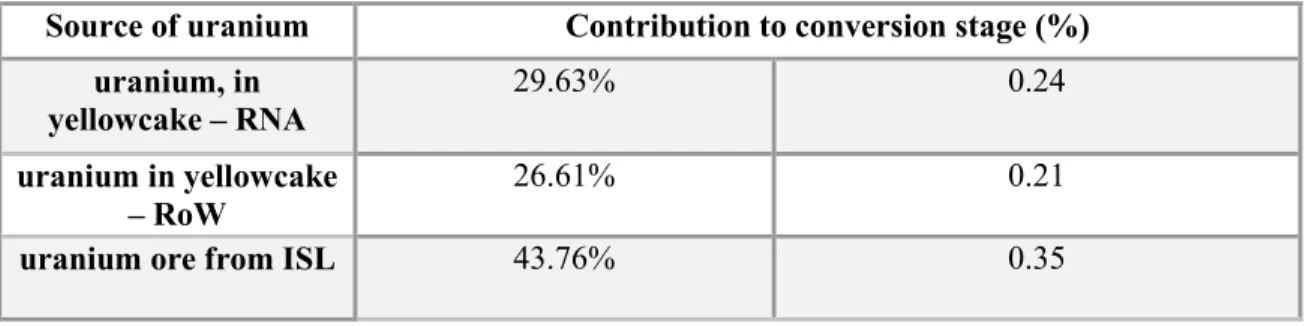
Conversion in the U.S. is accomplished through the dry hydrofluor process, as opposed to the wet solvent extraction method used at conversion facilities in other countries. The Conversion process built for this life cycle assessment used data from an Idaho National Laboratory study on the average environmental emissions and resources used by uranium conversion processes.47 While this data is not a direct correspondent to the dry hydrofluor process used by the U.S., the average includes information from the Honeywell Metropolis Works facility, where all U.S. uranium is converted to UF6. The feed to product ratio used in the life cycle inventory is 1:1.25 (Table 3.2) according to the World-Nuclear Association, which states that 249 tons of uranium ore is required to produce 312 tons of uranium hexafluoride.48
Table 3.2. Sources of uranium used in the conversion stage
Source of uranium Contribution to conversion stage (%) uranium, in
yellowcake – RNA 29.63% 0.24
uranium in yellowcake
– RoW 26.61% 0.21
Enrichment
All uranium enrichment in the U.S. is performed using gas centrifugation at the URENCO facility in Eunice, New Mexico. The Environmental Impact Statement (EIS) for the construction and operation of the facility is readily available and contains information about chemicals used throughout the process, environmental emissions, and water usage.25 The energy use of the facility was calculated based on the energy requirements of a typical gas centrifuge facility (40 kWh/SWU)25 and the capacity of the URENCO facility (4.7 million SWU/yr).49 Furthermore, since EIS data is given on a per year basis, the mass of enriched product was converted to a per year basis using URENCO SWU calculator,50 assuming a product assay of 4.95%51, a tails assay of 0.23%,50 and a feed assay of 0.711%.50 The number of SWUs required per kg of product is approximately 8.1 SWUs.
Fuel Fabrication
The inventory data for the fuel fabrication stage, much like the conversion stage, is based on an average of several facilities across the globe; however, the fabrication of uranium oxide fuel is differentiated from the fabrication of mixed oxide fuel, which is only produced in countries that reprocess used nuclear fuel.47 In addition to some of the more typical environmental flows considered for a manufacturing-type process, the amount of zirconium used in the production of a NuScale SMR fuel assembly was also included in the assessment. The NuScale SMR fuel assembly resembles that of a typical 17x17 PWR fuel assembly,52 but half the height. Therefore, the inventory assessment was performed by adjusting the volume of assembly material from approximately 4 meters52 for a standard
assembly and approximately 2 meters for the NuScale assembly.37 While this is sufficient information for the characterization of a fuel assembly, the materials and processes required for the manufacture of a NuScale module were not quantifiable given current available estimates. For this reason, the fuel fabrication stage of the life cycle may be an underestimate when compared with the potential impacts of fabricating the module as well.
Waste Management
There is little information available on the environmental flows of handling and storing used nuclear fuel at a dry cask facility on site, and essentially no information on how this process may change with the implementation of small modular reactor technology. For this assessment, only the materials required to construct the dry storage cask for the fuel were considered. This means that flows other than steel, concrete, and nuclear waste were disregarded. Because this evaluation is for small modular reactor technology and no specialized cask design has been proposed for the NuScale SMR design, it was assumed that a vertical, canistered used fuel cask that is standard for LWRs would be used for the storage of used nuclear fuel. Even though the NuScale assemblies are approximately half the height of a standard PWR assembly, stacking used assemblies is not expected due to the difference in heat profile after burn-up for stacked versus unstacked used fuel assemblies. Therefore, the used fuel casks for the used SMR assemblies are assumed to be about half the height of traditional dry casks. Outside the scope of this LCA are the design, testing, and licensing efforts that would be necessary to utilize a new dry casks storage container for onsite storage of used SMR fuel. This study considers nth-of-a-kind (NOAK)
deployment rather than first-of-a-kind (FOAK) deployment, so additional processes necessary to onboard the new technology are not considered.
The Nuclear Regulatory Commission has not, to date, specified any requirements for the storage of used nuclear fuel from a small modular reactor that would be different than that of a standard nuclear power plant.53 Furthermore, vendors of small modular reactor technology, such as NuScale Power, have also not specified a strategy for handling fuel discharged from the reactor specific to the modular nature of the technology. Therefore, it is assumed that the strategy will be the same as that of a standard nuclear power plant apart from perhaps a size difference in the storage cask.
Construction of SMR
Data for the construction of a small modular reactor facility was provided directly by NuScale Power, a U.S. company with a mature small modular reactor design. The numbers provided by NuScale Power were approximate estimates and are representative of a 720 MWe facility, which contains twelve 60 MWe modules. This information was supplemented with that from an Environmental Impact Statement from Westinghouse for the construction of a small modular reactor facility along the Clinch River in Oak Ridge, TN.54
Operation of SMR
Because the operation of a nuclear power plant impacts the environment very little outside of water consumption, this as well as passenger transport (transportation of workers from their homes) to the site were some of the only flows considered for this stage of the life cycle. Other flows considered were nitrogen oxides, carbon monoxide, particulates,
and some other emissions. Information for water usage was taken from publicly available literature on the NuScale SMR design,51 and the information about emissions is from the Westinghouse Environmental Impact Statement for the Clinch River Site.54 For fuel consumption, The NuScale design is cited to use approximately 1/20th the amount of fuel as that of a standard nuclear generator, where the initial loading of a standard, 1000MWe nuclear generator is 100 tonnes of UO255 making the initial loading of a NuScale SMR about 5 tonnes of UO2. For a refueling cycle of 24 months, where 1/3 of the reactor core is replenished with fresh fuel, and a lifetime of 60 years, the total amount of fuel used in a NuScale generator is 55 tonnes. For a facility of twelve modules, this totals to 660 total tonnes of UO2 fuel.
Decommissioning of SMR
As was mentioned in the discussion of waste management, the application of modular technology to nuclear energy production could make a definite difference in the way the fuel is handled at the end of life. Due to the modular nature of small modular reactors, it is possible that dry storage casks would evolve to accommodate this change in technology. The “plug and play” nature of small modular reactors may allow for the “unplugging” and storage of an entire module upon decommissioning, thus reducing much of the energy and material demands of the decommissioning process. Already, there are designs proposed for micro-reactors that include simplified decommissioning of an entire module.56 Furthermore, were it to be the case that this could be accomplished in a factory setting for individual modules, it is possible that the facility infrastructure could be used beyond the estimated 60-year lifetime of the modules themselves, thus reducing the impact per kWh
of energy produced from construction of the facility. However, this strategy is purely speculative. In lieu of reliable information about the decommissioning processes of a small modular reactor facility, it must be assumed that the practices will be the same as that of a standard nuclear power plant.
Over the last few decades, 32 nuclear facilities have undergone decommissioning in the U.S., with only a fraction of these facilities having completed their decommissioning.57 Of these facilities, fewer still have publicly accessible documentation quantifying the material and energy flows employed during the decommissioning process. The most detailed account of material and energy flows for a U.S. facility is available for the Maine Yankee facility in Wiscasset, Maine; however, this account only provides details for the waste shipped from the site, as well as the economics of the decommissioning.58 No information regarding the energy, water, or diesel-use at the facility during the decommissioning process is provided.
In the absence of detailed material and energy flows for decommissioning of a U.S. facility, data was used instead from a report on the decommissioning of a VVER facility in Lubmin, Germany.59 This report documents not only the wastes associated with the decommissioning of the facility but also the energy and material flows for each step in the decommissioning process, such as cutting and decontamination. The VVER design, while different than that of the standard LWR used in the U.S., differs primarily in the details of the reactor-specific equipment. The primary difference between a VVER design and standard LWR is in the orientation of the steam generators, shape of the fuel assemblies, design of the pressure vessel, and design of the pressurizers.60
While these differences in design can account for changes to the decommissioning strategy that must be employed, these differences would be minute compared to the entire facility. The difference that must be considered is not in the design of the facility, but in the decommissioning practices of the host country, Germany. Nuclear decommissioning practices in Germany differs from decommissioning in the U.S. in that much of the building materials (e.g., concrete and steel) are decontaminated and recycled for secondary use. Because the process of creating the cement for concrete is extremely energy intensive ,61 the reuse of this material could have profound impacts on the result of the life cycle assessment depending on the boundary conditions of the assessment. Of note, the process of recycling is also very energy intensive, requiring the use of an LCA approach to gauge any underlying environmental impacts.62 In the United States, the question of decontamination and recycling of these materials is handled on a state-by-state basis and is largely not practiced. While the data from the German VVER reactor decommissioning was utilized for the decommissioning stage of this LCA, a sensitivity analysis was performed to consider additional impacts associated with recycling the decontaminated concrete and steel.
Transportation
Transportation was considered as a separate stage between all the other stages in this life cycle assessment (Figure 3.1). For example, transportation from mining and milling facilities to the conversion facility was considered as a separate LCA stage than transportation from the conversion facility to the enrichment facility. For simplicity, all the transportation stages are combined in this subsection.
It was mentioned in the discussion of the mining and milling stage that most uranium used in the U.S. nuclear fuel cycle is imported from other countries. For this reason, consideration of transportation following this stage is important. For countries on a different continent than the U.S., transoceanic transportation from the major ports of each country to major ports in the U.S. were considered. The U.S. ports used in this analysis, Norfolk, VA and San Diego, CA, were chosen based on proximity to the source country as well as likelihood of accepting nuclear material based on U.S. Naval presence. For the calculation of the distance traveled by the freight, an online sea routes calculator was used.63 For Canadian imports, transportation was assumed to occur by rail from Saskatoon to Metropolis, IL, the location of the conversion facility in the U.S. The remaining travel for the uranium ore from Kazakhstan, Uzbekistan, Russia, and Australia was also assumed
Figure 3.1. Map showing approximate locations for the U.S. fuel cycle facilities as well as the line-of-sight transportation paths between all stages of the LCA.
Transoceanic Transport from Russia, Australia, Kazakhstan, and Uzbekistan to major U.S. ports most likely to accept
nuclear material
San Diego Port
Norfolk Port From Canadian Mines Conversion in Metropolis, IL Enrichment in Eunice, NM Fuel Fabrication in Richland, WA Proposed operation near Clemson, SC 10 From Australian Mines From Euroasian Mines
to occur by rail. It was assumed that 0.34 tonnes of uranium ore would be shipped in 210-literliter containers for each shipment.64
From the conversion facility in Metropolis, IL, the remaining transport was assumed to occur by truck in Type 48Y packaging. Each package was assumed to weigh 2359 kg, and shipments were limited to one package per truck in accordance with Nuclear Regulatory Commission specifications for shipment of uranium hexafluoride.25 After arriving in Eunice, NM, the packaging for the uranium hexafluoride is re-used for storage and transportation of depleted uranium and so is not considered a waste stream of this transportation.25
Because most of the data used in this analysis is for the NuScale Power SMR design, the fuel vendor for this design was chosen as the next transportation point for the now-enriched uranium. NuScale has announced its partnership with AREVA for fabrication of the fuel for their SMR design,65 and so the fuel fabrication stage was assumed to occur in Richland, WA, the U.S. location for AREVA’s fuel fabrication operations. This shipment was assumed to occur via truck and in Type 30B packaging weighing 635kg each. The recommended number of packages per shipment is 3, as specified by the Nuclear Regulatory Commission, though a maximum of 5 can be shipped.25 In this case, the recommended was used.
According to NuScale Power, following fabrication, the module will then be shipped to the site of operation in 3 components for assembly.37 The total weight of the module is 700 tons,37 making each shipment approximately 233 tons each. This transportation, like most shipments in the fuel cycle, would also be done by truck. The distance traveled by
this shipment would, of course, depend on the chosen location for the SMR facility. Because of market infrastructure, the likeliest location for the first small modular reactor facility in the U.S. would be in the southeastern region. Already, a site permit is being sought by the Tennessee Valley Authority for a facility in TN.66 The hypothetical location for a small modular reactor facility was chosen to be Clemson, SC.
No transportation of used nuclear fuel is considered, as it is assumed that all waste will be stored on site. Further, no permanent storage solution has been reached by the U.S. that would dictate any further transportation of the fuel following discharge from the reactor and subsequent cooling. The specific mileage and weight data used for transportation throughout the life cycle is reported in Table B.2 of Appendix B
Impact Assessment
The ReCiPe 2008 database was used to assess the impact associated with the life cycle inventory constructed for this study.67 A ReCiPe 2016 database has been published. As a newer database, ReCiPe 2016 is less extensively vetted. Future work should include a comparison of the ReCiPe 2008 and 2016 databases for the system detailed in this study. The LCA impacts were calculated in terms of 1 MWh of electricity produced using a Hierarchical viewpoint. The Hierarchical viewpoint is the most commonly used perspective for LCA studies because it is neither optimistic nor pessimistic with respect to the assessment of the impacts. For reference, ReCiPe considers an “optimistic” viewpoint as one in which all possible measures for limiting environmental impacts are taken. Of the eighteen midpoint and three endpoint indicators, or impact categories, included in ReCiPe
2008, this study focused on six of the more commonly evaluated impact categories, including:
1. Water depletion (m3) 2. Fossil depletion (kg oil-eq) 3. Metal depletion (kg Fe-eq) 4. Climate change (kg CO2-eq) 5. Human toxicity (kg 1,4-DB eq) 6. Ionizing radiation (kBq 235U-eq)
The impacts of discrete processes and material flows are measured in terms of equivalent characterization factors, which describe the relative impact a chemical or toxin has on the environment in a specific impact category. Characterization factors are calculated based on the fate, exposure, and effects of a particular chemical or toxin.68 For example, 1 kg methane produces equivalent climate change impacts as 28 kg CO2.69 The methodology governing the calculation of each impact category is detailed in the ReCiPe 2008 manual.70
Water depletion refers to the amount of water used for the different processes considered throughout the lifecycle, whether or not the water is consumed. Alternatively, metal and fossil depletion consider the metals and fossil resources extracted and consumed for the purpose of processes in the lifecycle. For example, the uranium ore mined for use in the nuclear fuel cycle contributes to metal depletion, as do the metal components (e.g., iron and chromium in steel) used in construction of the facility. An example of fossil depletion is the production and combustion of fuel for transportation.
The climate change impact category considers the adverse effects to the climate resulting from the use of certain chemicals or resources. For example, the production of
change. The human toxicity impact category considers the adverse impacts to human health, which is caused by harmful chemicals or pollutants making their way into the human food chain. While the LCA midpoint does not directly quantify the fate of those toxins, the choice of the Hierarchical approach (as opposed to the Egalitarian or Individual approach) provides the baseline assumptions for the degree of countermeasures against toxin release into the environment and eventual impact on humans.
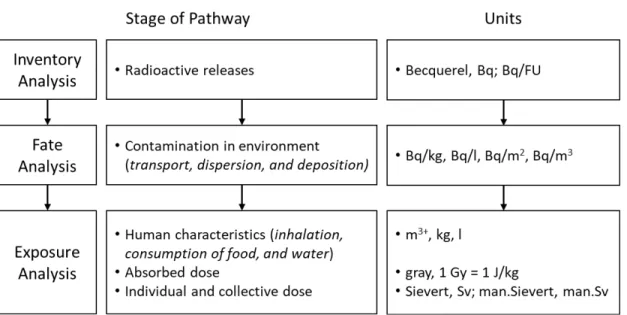
Similarly, the ionizing radiation impact category considers the potential for human exposure to and health impacts from ionizing radiation from routine releases of radionuclides throughout the fuel cycle. For consistency with the other impact categories assessed, the midpoint ionizing radiation impact (i.e., potential exposure) is assessed in this study. The potential for human exposure to ionizing radiation depends on the amount of ionizing radiation determined in the life cycle inventory (in terms of Bq per functional unit), the environmental fate of the radionuclide(s), as well as the potential human exposure pathway (Figure 3.2). Effectively, the ionizing radiation midpoint impact category is an assessment of the potential dose given the amount and type of radiation released throughout the lifecycle.70 Within the ReCiPe/OpenLCA framework,71 the data used for calculating radionuclide release, fate, and potential exposure is based on models published in 1985 by the International Atomic Energy Agency (IAEA)72 and exposure factors defined by Dreicer et al. (1995)73 and UNSCEAR (1982),74 which consider atmospheric releases, liquid releases into rivers, and liquid releases into the ocean. The ionizing radiation impact category is reported in equivalents of exposure from an atmospheric release of 235U. As such, the units are reported as Bq 235U-eq, rather than man.Sv. For example, the using a
Heirarchist perspective, the characterization factor for atmospheric exposure from 235U is 1.40 x 10⁻⁸ man.Sv/kBq or 1.00 235U-eq, whereas atmospheric exposure from 129I, which is
a greater risk factor for atmospheric exposure, is 6.20 x 10⁻⁶ man.Sv/kBq or 4.43 x 101 235U-eq.
Data Quality Analysis
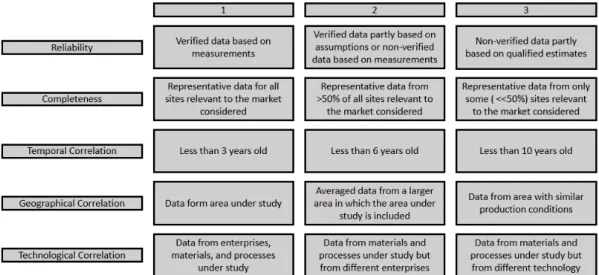
Data quality analysis is a means to semi-quantitatively assess the quality of data on which a lifecycle inventory is built. The pedigree of the data for each LCI flow was documented using the pedigree matrix housed within the EcoInvent database (Figure 3.3). A pedigree matrix consists of a series of indicators about which the data quality is ranked. For example, the EcoInvent pedigree matrix includes five indicators for data quality assessment: reliability, completeness, temporal correlation, geographical correlation, and
Figure 3.2. Overview of the analyses implemented in the impact assessment as performed using the ReCiPe database. The flowchart is modified from Dreicer et al. 199573 and Frischknecht et al. 2000.71
further technological correlation.75 The portion of the EcoInvent pedigree matrix in Figure 3.3 shows rankings one through three out of a total of five, where one is the best.
Sensitivity Analysis
Due to uncertainty in some of the parameters in various life cycle stages, several sensitivity analyses were performed. One such uncertainty is in the materials used for the construction stage of the life cycle, as all values available from current small modular reactor vendors are merely low-end estimates intended to sell the technology. In addition, a materials sensitivity can highlight why life cycle assessments seem to vary so broadly, even when considering the same technology. Further, the boundary conditions defined by the goal and scope of an assessment can significantly impact the outcome of the life cycle assessment. In order to determine whether an assumption about material or boundary conditions will have much impact on the results, a sensitivity analysis should be performed.
Figure 3.3. EcoInvent pedigree matrix with descriptions of the quality ranks 1-3. All data used in this work ranked 3 or below.61
An additional area of interest when considering the sensitivity of the life cycle is the source of the uranium. As described in the background on the nuclear fuel cycle, there are primarily 3 extraction techniques for uranium: open-pit, underground, and in situ leach mining. While open-pit and underground mining are expected to have similar impacts to resources and environment, the process of in situ leach mining could yield significantly different results. For the processing stages of uranium (conversion, enrichment, etc.), the location of the processing facility could greatly impact the results of the assessment. This is because many stages in the nuclear fuel cycle are relatively energy intensive and thus are subject to the effect of the energy portfolio of that region. The regional energy portfolio for each processing facility was incorporated for the base-case. To demonstrate the effects of energy source on the assessment, several cases were considered in which the electricity source for the entire life cycle was changed to the same source. For example, in one case, all stages of the life cycle were assumed to source their energy from coal electricity. This was repeated for nuclear and hydroelectric sources. Additionally, because the U.S. imports much of its uranium resources from other countries, and processing facilities for uranium fuel are located at vast distances from one another, it is relevant to consider the impact of transportation on the results of the assessment. This was accomplished by considering a case where transportation is included and one where it is removed entirely.
Lastly, because the data for decommissioning was sourced from a report on the decommissioning of a German facility, it is important to note the potential differences in strategy between the U.S. and Germany. In Germany, when the report was published, decommissioning entailed not only decontamination of the general area but also of the
concrete, steel, and various other materials for recycling.59 While there is no nation-wide regulation addressing the possible recycling of decommissioning materials in the U.S., there are few, if any, states that have adopted this strategy. Instead, contaminated concrete and steel are generally treated as low-level nuclear waste and stored as such. Thus, a sensitivity analysis on the decommissioning phase, where in one case the materials are mostly recycled, and in the other they are not. For the former assumption, the resources required to recycle the materials are considered as well as the reduction in low-level waste. For the latter, all materials resulting from the decommissioning stage are treated as low-level nuclear waste.
In summary, the sensitivity analyses considered for this assessment include: 1. Electricity source
2. Mine type 3. Transportation