Evaluation of headspace Solid Phase Micro-extraction method for analysis of phosphine
residues in wheat
Ren, Y.L.1,2,3*#, Padovan, B.4
1 Cooperative Research Centre for National Plant Biosecurity, Australia, Email: [email protected] 2 School of Biological Science and Biotechnology, Murdoch University, South Street, Murdoch, WA, 6150 Australia
3 Department of Agriculture and Food, Western Australia, 3 Baron Hay Court South Perth WA 6151, Australia 4 CSIRO Entomology, GPO Box 1700, Canberra ACT 2601, Australia
* Corresponding author # Presenting author
DOI: 10.5073/jka.2010.425.095
Abstract
This new method utilizes headspace-solid-phase micro extraction (HS-SPME) for pre-concentration of
PH
3. Phosphine was determined with gas chromatography/pulsed flame photometric detector (PFPD).
Spiked samples were used for calculation of phosphine residue in grain. Four types of fibres (100
μ
m-PDMS, 85µm-
CAR
/
PDMS
,
75µm
-
CAR
/
PDMS and
65
μ
m-PDMS/DVB) were tested.
The
bipolar
fibres (CAR/PDMS and PDMS/DVB) can extract PH
3, but the non-polar fibre (PDMS) did not. Larger
size fibres extracted PH
3more efficiently than the smaller size fibres (e.g., 85 µm > 75 µm > 65 µm).
The 85µm CAR/PDMS fibre was used to optimize the different parameters that affect the SPME
extraction efficiency of PH
3. In the validation study,
50 grams of wheat in a 250 mL glass flask and
capped with an open-top screw cap and PTFE/Silicon septa were spiked at 0.02
ng PH
3/g of wheat. The
flask
was then heated to 45°C in an oil bath for 45 min, after which time the
85 µm CAR/PDMS
fibre
was exposed for 20 min and then exposed in the heated injection port of a GC/PFPD and desorbed for 2
min. Under conditions of the
validation study, t
he
limit of detection (LOD) or level of quantification
(LOQ) was in the range of 0.005–0.01 ng PH
3/g of wheat.
Keywords: Fumigant, Phosphine, Residue, SPME, HS-SPME
1. Introduction
The world grain industry relies heavily on chemicals for grain treatment. Currently, phosphine (PH
3) is
the only fumigant available to treat bulk grains and oil seeds (more than 85% grains are treated/re-treated
with PH
3) in each of the linkages from on-farm storage to central storage (Collins et al., 2000; Collins et
al., 2002; Ren and Mahon, 2007). However, a restrictive Codex Maximum Residue Limit (MRL) of 0.1
mg/kg, and lower limits set by some purchasers, are challenging the use of PH
3for treatment of grain.
Phosphine residues can remain in the grain for several months. Multi-fumigation with PH
3can also cause
accumulation of residues in the grain exceeding the MRLs. It is also important to note that levels of PH
3residues in grain, producing low aerial concentrations of PH
3, can also facilitate resistance. Therefore, it
is necessary to understand PH
3residues in bulk grain to establish better procedures for multi-fumigation.
This will guide industry in the conduct of good PH
3fumigation practice to minimise PH
3residue in
fumigated grain. These include application methods and choice of the right periods of exposure and
airing.
Typical procedures for analysis of PH
3residues include: 1) removal from the commodity matrix by either
purge and trap techniques or by solvent extraction (Miyahara and Saito, 1994), and 2) and then analysis
by gas chromatography (GC) or gas chromatography-mass spectra (GC-MS). However, purge and trap
methods are not suitable for highly volatile fumigants such as PH
3as they are unable to trap all fumigant
(Ren and Desmarchelier, 1998). Solvent extraction has the problem of solvent interference and is
time-consuming. None of the above methods are suitable for analysis of PH
3residues in grains, particularly at
very low levels. Microwave irradiation is being increasingly used in the digestion of samples (Ren, 2001;
Desmarchelier et al., 1998), and, in recent work (Chemfate 2004), excellent recoveries and precision
have been obtained from microwave extractions of PH
3from wheat and hay (Ren and Mahon, 2007).
Solid-phase microextraction (SPME) in combination with head space (SH-SPME) analysis by gas
chromatography is a convenient alternative method for volatiles. Solid-phase micro extraction is a
simple, sensitive, and solvent-free technique that has become popular in a wide range of applications
(Penalver et al., 2001). It has been used to study pollutant gases and volatile degradation products
(Lattuai-Derieux, et al., 2004). For example residues of methyl isothiocyante (MITC) were analysed by
HS-SPME with the 85 µm Polyacrylate (PA) fibre (Ren et al., 2008a). Using the HS-SPME method,
MITC residues from wheat can be successfully analysed at levels below 0.1 ng/g, compared with purge
and trap methods where the limit of detection is 10 ng/g (Ren et al., 2008a,b). This paper describes a new
method for analysis of PH
3residues in wheat which utilises headspace-solid-phase micro extraction
(HS-SPME). It includes selection of
the SPME fibre and factors that
affect the extraction efficacy of PH
3.
2. Materials and methods
2.1. Reagents and apparatus
One litre Erlenmeyer flasks (Bibby Sterilin, Staffordshire, Cat. No. FE 1 L/3) were used for fumigation
of wheat and preparation of standards. The measured volume of each Erlenmeyer flask and inlet system
was calculated from the weight of water required to fill the container and was used for calculations.
Bottles of 250 mL (Alltech Cat. No. 9535) were used for the microwave “extraction”. Each bottle was
fitted with a Mininert valve equipped with septa (Alltech Cat. No. 95326). A 100
μ
L air tight syringe
with valve (SGE, Melbourne, Australia; Cat. No 005279) was used for GOW-MAC gas density balance
injection and transfer of PH
3from source to fumigation chambers and flasks.
The SPME fibres used were
coated with
85 µm Carboxen/Polydimethylsiloxane (
CAR
/
PDMS
) fibre
(Sigma-Aldrich Australia, Cat. 57334-U), 75 µm Carboxen/Polydimethylsiloxane (
CAR
/
PDMS
) fibre
(Sigma-Aldrich Australia, Cat. 57344-U), 65
μ
m Polydimethylsiloxane/Divinylbenzene (PDMS/DVB)
fibre (Sigma-Aldrich Australia, Cat. 57310-U) and 100
μ
m Polydimethylsiloxane (PDMS) fibre
(Sigma-Aldrich Australia, Cat. 57301), respectively.
All fibres were conditioned at 270°C for 1 h prior to use in
accordance with manufacturers’ recommendations.
Phosphine (85.0% PH
3and 15.0% air and CO
2) was laboratory prepared by the FAO method (FAO,
1975). The purity of PH
3was determined using a GOW-MAC gas density balance (GOW-MAC
Instrument Co., Madison, N.J.) after separation of the gases on a 1 m
×
5 mm i.d. Porapak Q 100/120
mesh (Alltech Associates, Cat. No. 2702) column at 105
°
C with a carrier flow (N
2) of 150 mL/min. The
reference gas used was tetrafluoroethane (> 99.9%), which was supplied by ACTROL Ltd, Australia.
Phosphine (PH
3) was determined on a Varian CP-3800 (Varian Instruments, Sunnyvale, CA), equipped
with a pulsed flame photometric detector (PFPD) with phosphorus filter. Separation was achieved on a
30 m
×
0.53 mm ID, AT-Q column (Alltech Associates, Cat. No. 0810025, Part No. 13939) at 125
°
C and
carrier flow (N
2) of 5.0 mL/min at 5.0 psi. Injector and detector temperatures were 200
°
C. Injection
volumes of gases were 40 µL. A minimum interval of 5 min was kept between injections, in order to
elute interfering chemicals.
2.2. Wheat sample and fumigation of wheat
Wheat used was Australian standard white wheat, 10.9% moisture content, w/w wet basis. The moisture
content of the wheat was measured by oven drying at 105
°
C for 2 hours (ISO 712 International Standard
1998). In order to ensure the moisture result is precise, 500 kg wheat sample was quartered equally using
a Boerner grain divider. One quarter sample (125 g) was quartered equally again and then one quarter
sample of about 30 g was collected and ground with a laboratory sealed metal grinder for measurement
of moisture content. Four replicates samples were dried at 105°C in mechanical convection oven ( DK 62
American Scientific Products Columbus, OH, USA) and the loss of weight was used to calculate the
moisture content of the sample.
2.3. Preparation of diluted PH
3gas and spiking standards
Diluted PH
3gases
were prepared by first removing the same volume of air as the known volume (0.5
mL) of concentrated PH
3to be injected into an Erlenmeyer flask (1 L) containing six glass beads (2-3
mm OD).
For validation study, the limit of detection (LOD) or level of quantification (LOQ) was
investigated using spiked standards. Spiked wheat samples
at and 0.02 and 0.5 ng PH
3/g of wheat
were
prepared by adding appropriate volumes of
PH
3into sealed flasks (250 mL) containing wheat (50 g) 3
min before oil bath heating. Triplicate samples were used and each sample was injected duplicates (
n=6
).
The dosages and required volumes for PH
3concentrations, calibrated to the current laboratory
temperature and pressure, were calculated from Eq. 1
Vf =
(
1
273
)
T
−
(
1
.
7
10
)
4N
M
P
V
C
×
×
×
×
×
Eq. 1Where: V is volume of fumigation container (L); P is pressure (mm Hg); T is temperature (°C);
C is the intended concentration of methyl bromide (mg/L); Vf is dosage volume of fumigant (mL); M is molecule weight of fumigant; N is purity of gas (%).
2.4. Selection of fibre and HS-SPME extraction time
Four different types of fibres (100
μ
m-PDMS, 85 µm
-
CAR
/
PDMS
,
75 µm-
CAR
/
PDMS and
65
μ
m-PDMS/DVB) were tested at 20 min extraction time. Diluted PH
3gas was
injected into a 250 mL flask
fitted with a sample port to obtain 0.3, 0.1, 0.05 and 0.01 ppm of PH
3, respectively.
Headspace samplings
were carried out on all four types of fibres.
The
needle
was carefully inserted into the headspace of the
flask and the fibre exposed into the headspace for 20 min.
At the end of the defined extraction time, the
fibre was withdrawn from the headspace into the needle. The fibre holder was removed from the
extraction flask and inserted into the injection port. The fibre was extended into
a GC-PFPD
inlet where
sample components were desorbed at 200°C
for 5 min
to clean it between extractions.
For evaluation of HS-SPME extraction time on the efficacy of PH
3extraction, the SPME equilibration
time was determined by exposing the fibres (85 µm-
CAR
/
PDMS
, 75 µm-
CAR
/
PDMS
and
65
μ
m-PDMS/DVB) to 0.3 ppm of PH
3for 1, 5, 10, 15, 20 and 30 min, respectively. Finally the fibre was
retracted and then exposed in the heated injection port (200°C) of a GC-PFPD and desorbed for 2 min
.
Results are the mean of duplicate samples and injections for each sample (
n=4
).
2.5. Evaluation of GC Injector temperature for desorption of PH
3from fibre (85µm CAR/PDMS)
Efficient thermal desorption of the analysis in a GC injection port is dependent on the type of fibres and
on the GC injector temperature.
The 85 µm CAR/PDMS fibre was used to optimize the i
njector
temperature. It was inserted into the headspace of the flask containing 0.1 ppm of PH
3and exposed for
20 min. The fibre was carefully injected into the GC at different injector temperatures (100,150, 200 and
250°C) and desorbed for 5 min. Results are the mean of duplicate samples and injections for each sample
(
n=4
).
2.6. Evaluation of wheat treatment and HS-SPME extraction temperature for extraction efficacy of PH
3A fumigated wheat sample of 50 g in a 250 mL flask fitted with a sample port was immersed in a heated
oil bath at 30°C for 30 min, after which time the fibre was inserted into the headspace of the flask and
exposed for 20 min. Equivalent flasks were heated a 35, 40, 45 and 50°C. The fibre was injected (200°C)
into a GC-PFPD and desorbed for 5 min. Spiked wheat samples were treated in exactly the same manner.
Levels of PH
3residue were determined against spiked standards. The peak areas were calibrated
periodically using a fortified standard, and the data presented are the mean of duplicate samples and
injections for each sample (
n=4
).
2.7. Statistical analysis
The GC readings of fumigant concentration were averaged respectively. The average variation of GC
readings and PH
3concentration and standard deviations (SD) between the duplicate treatments and
injections were analysed with Microsoft Excel.
3. Result and discussion
3.1. Effect of fibre types and HS-SPME extraction time on extraction efficacy of PH
3The amounts of PH
3absorbed by each of four different SPME fibres are shown in Figure 1 for each of
four PH
3concentrations. These four fibres showed different efficiency and selectivity in extracting PH
3in the headspace. The bipolar fibres (CAR/PDMS and PDMS/DVB) which dispersed solid adsorbents in
polymer extracted PH
3, but the nonpolar fibres (PDMS) extracted no PH
3. The larger size of polymer
fibre (e.g., 85 µm) extracted PH
3more efficiently than the smaller size of polymer fibre (e.g., 75 µm and
65 µm).
Figure1 Fibre types (100 µm PDMS, 85 µm CAR/PDMS, 75 µm CAR/PDMS and 65 µm PDMS/DVB) affect the extraction efficacy of PH3 after 20 minutes extraction.
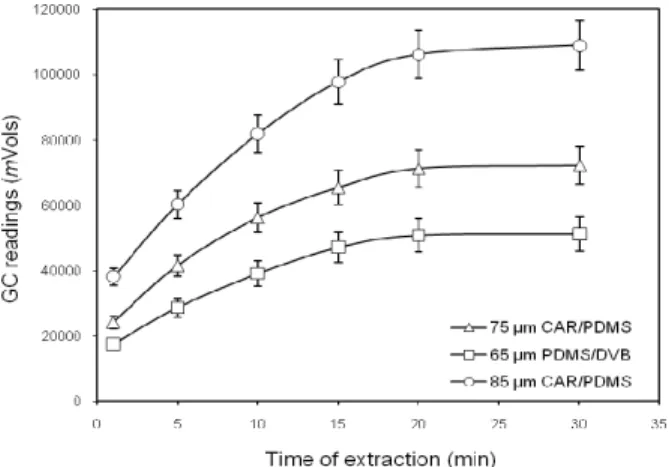
The effect of time of extraction of PH
3is shown in Figure 2. The responses of GC peak areas
progressively increased with increasing the extraction time, but no increase in the response occurred after
20 min. That is, the amount of PH
3absorbed by the tested fibres increased over a period of 20 min and
then attained equilibrium.
After
30 min extraction,
the amount of absorption was
85 µm CAR/PDMS > 75 µm CAR/PDMS > 65
µm PDMS/DVB. The 85 µm CAR/PDMS fibre was used in this study to optimize the different
parameters that affect the SPME extraction efficiency of PH
3.
Figure 2 Time of extraction with different type of fibres (85 µm CAR/PDMS, 75 µm CAR/PDMS and 65 µm PDMS/DVB) affects the extraction efficacy of PH3 (0.3 ppm) at 1, 5, 10, 15, 20 and 30 min.
3.2. Effect of GC Injector temperature for desorption of PH
3from fibre (85 µm CAR/PDMS)
The effects of GC injector or desorption temperature were evaluated by varying the temperature from
100 to 250ºC. The injector temperature profile obtained is shown in Figure 3. The amount of desorbed
PH
3increased with increasing the injector temperature and then reached a maximum at 200ºC. The GC
used had split/splitless capillary injectors. It was suitable for direct introduction of the fibre into the
injection port. In this study, the CG injector operated at 200ºC of optimal desorption temperature and did
not cause peak broadening and tailing (Fig. 4).
0 10000 20000 30000 40000 50000 50 100 150 200 250 300 GC injector temperature (ºC) G C r eadi ngs ( m Vo ls )
Figure 3 The GC injector temperature affects desorption of PH3 from fibre (85 µm CAR/PDMS) at 0.1 ppm of PH3 after 20 minutes extraction.
Figure 4 GC spectra with fibre (85 um CAR/PDMS) after 20 min extraction at levels of PH3 at 0.5 ng/g (A) and 0.02 ng/g (B).
3.3. Effect of wheat treatment and HS-SPME extraction temperature on extraction efficacy of PH
3The effects of temperature for treatment of wheat sample and extraction efficacy were evaluated by
varying the temperature from 30 to 50ºC. The temperature profile for PH
3released from fumigated wheat
into the headspace and absorption of PH
3on the fibre (85 µm
CAR
/
PDMS)
obtained is shown in
Figure 5.
0 50000 100000 150000 200000 250000 300000 350000 400000 25 30 35 40 45 50 55 Extraction temperature (ºC) G C r e ad in gs ( m Vo ls )desorption from the fibre, ultimately limiting its analytical sensitivity of PH
3. This is consistent with the
results of Vás
and Vékey (2004). Therefore, we used the low temperature (45ºC) and long term (30 min)
extraction for treatment of wheat samples. The limit of detection (LOD) or level of quantification (LOQ)
was estimated based on a signal to noise ratio shown in Figure 5 (B) in the range of 0.005–0.01 ng/g.
Although the determination of PH
3in grain is well established in the scientific literature, our results have
demonstrated that the combination of SPME with headspace sampling is very effective for determining
trace levels of PH
3.
Acknowledgements
The authors would like to acknowledge the support the Australian Government’s Cooperative Research
Centres Program and Jim Desmarchelier for helpful contributions.
References
Chemfate, 2004. Environmental Fate Database. Syracuse Research Corporation, Syracuse, NY. USA. accessed June 2004www.syrres.com/esc/chemfate.htm .
Collins, P.J., Daglish, G.J., Pavic, H., Lambkin, T.M., Kopittke, R. 2000. Combating strong resistance to phosphine in stored grain pests in Australia. In: Wright, E.J., Banks, H.J., Highley, E. (Eds), Stored Grain in Australia. Proceedings of the Australian Postharvest Technical Conference, 1-4 August 2000, Adelaide, Australia, pp. 109-112.
Collins, P.J., Emery, R.N., Wallbank, B.E. 2002. Two decades of monitoring and managing phosphine resistance in Australia. In: Credland, P.F.A., Armitage, D.M., Bell, C.H., Cogan, P.M., Highley, E. (Eds), Proceedings of the Eighth, International Working Conference on Stored-product Protection, 22-26 July 2002, York, UK, CAB International, Wallingford, UK, pp. 570-575.
Desmarchelier, J. M., Allen, S. E., Ren, Y. L., 1998. Modifications of a method for determining multifumigant residues. Journal of the Association of Official Analytical Chemists, International 81, 638-644. FAO, 1975. Recommended methods for the detection and measurement of resistance of agricultural pests to
pesticides. Tentative method for adults of some major pest species of stored cereals, with methyl bromide and phosphine. FAO Method NO. 16, 1975, Plant Protection Bulletin No. 23, 12-25.
Vás, G., Vékey, K., 2004. Solid-phase microextraction: a powerful sample preparation tool prior to mass spectrometric analysis. Journal of Mass Spectrometry, 2004, 39, 233–254.
Miyahara, M., Saito, Y., 1994. Determination of bromide ions in food by unsuppressed ion chromatography with ultraviolet detection after microwave digestion in a sealed PTHE vessel. Journal of Agricultural and Food Chemistry 42, 1126-1131.
Penalver, A., Pocurull, E., Aguilar, C., Borrull, F., Marce, R. M., 2000. Comparison of different fibres in the solid phase microextraction of phthalate esters from water samples. Journal of Chromatography A 922, 377-384. Ren, Y. L., 2001. Comparison of solvent extraction and microwave extraction for release of dimethyl sulfide from
cereals and canola. Journal of Agricultural and food Chemistry 49, 1737-1739.
Ren, Y.L., Desmarchelier, J.M., 1998. Release of Fumigant Residue from Grain by Microwave Irradiation. Journal of the Association of Official Analytical Chemists, International 81, 673-678.
Ren, Y.L., Mahon, D., 2007. Evaluation of microwave irradiation for analysis of carbonyl sulfide, carbon disulfide, cyanogen, ethyl formate, methyl bromide, sulfuryl fluoride, propylene oxide, and phosphine in hay. Journal of Agricultural and Food Chemistry 55, 32-37.
Ren, Y.L., van Emmerik, T., Mahon, D., Lee, B.H., Padovan, B., 2008a. Ethyl formate plus methyl isothiocyanate is a potential liquid fumigant for stored grains. In: Guo, D.L., Navarro, S., Jian, Y., Cheng, T., Zuxun, J., Yue, L., Yang, L., Haipeng, W. (Eds), Proceedings of the 8th International Conference on Controlled Atmospheres and Fumigation in Stored Products, 21-26 September 2008, Chengdu, China, Sichuan Publishing House of Science and Technology, Chengdu, China, pp. 82-87.
Ren, Y.L,, Lee, B.H., Mahon, D.A., Xin, N., Head, M., Reid, R., 2008b. Fumigation of wheat using liquid ethyl formate plus methyl isothiocyanate in 50 tonne farm bins. Journal of Economic Entomology 101, 623-630.