Dissertations
2019
Genetic dissection and prediction of leaf angle across the maize
Genetic dissection and prediction of leaf angle across the maize
canopy
canopy
Matthew James Dzievit
Iowa State University
Follow this and additional works at: https://lib.dr.iastate.edu/etd
Part of the Agricultural Science Commons, Agriculture Commons, Agronomy and Crop Sciences Commons, and the Genetics Commons
Recommended Citation Recommended Citation
Dzievit, Matthew James, "Genetic dissection and prediction of leaf angle across the maize canopy" (2019). Graduate Theses and Dissertations. 17179.
https://lib.dr.iastate.edu/etd/17179
This Dissertation is brought to you for free and open access by the Iowa State University Capstones, Theses and Dissertations at Iowa State University Digital Repository. It has been accepted for inclusion in Graduate Theses and Dissertations by an authorized administrator of Iowa State University Digital Repository. For more information, please contact [email protected].
by
Matthew James Dzievit
A dissertation submitted to the graduate faculty in partial fulfillment of the requirements for the degree of
DOCTOR OF PHILOSOPHY.
Major: Plant Breeding
Program of Study Committee: Jianming Yu, Major Professor
Philip Becraft Asheesh Singh
Bing Yang Andy VanLoocke
The student author, whose presentation of the scholarship herein was approved by the program of study committee, is solely responsible for the content of this dissertation. The Graduate College will ensure this dissertation is globally accessible and will not permit alterations after a
degree is conferred.
Iowa State University Ames, Iowa
2019
TABLE OF CONTENTS
Page
ACKNOWLEDGMENTS ... v
ABSTRACT ... vi
CHAPTER ONE: GENERAL INTRODUCTION ... 1
Increase in Maize Yield ...1
Maize Response to Planting Density Increases ...2
Light Competition ...4
Genetic Control of Leaf Angle Variation ...7
Genomic Prediction for Crop Improvement ...9
Dissertation Organization ...11
References ... 11
Figures ... 18
CHAPTER TWO: DISSECTION OF LEAF ANGLE VARIATION IN MAIZE THROUGH GENETIC MAPPING AND META-ANALYSIS ... 21
Abstract ... 21
Introduction ... 22
Materials and Methods ... 24
Genetic Materials ...24
Phenotyping for Leaf Angle ...25
Genotyping, Filtering, and Imputation ...25
Quantitative Trait Loci Mapping ...26
Meta–Quantitative Trait Loci Analysis ...27
Results ... 28
Phenotypic Analysis ...28
Construction of Genetic Map and Quantitative Trait Loci Detection ...29
Phenotype, Population, and Quantitative Trait Loci Summary ...30
Meta–Quantitative Trait Loci Analysis ...31
Meta-Analysis Candidate Genes ...32
Discussion ... 33
Conclusion ... 37
References ... 38
Figures ... 45
Tables ... 49
Supplemental Figures ... 52
Supplemental Tables ... 54
Data and Code Availability ... 69
CHAPTER THREE: GENETIC MAPPING FOR DYNAMIC CONTROL OF LEAF ANGLE ACROSS MULTIPLE CANOPY LEVELS IN MAIZE ... 71
Abstract ... 71
Introduction ... 72
Materials and Methods ... 73
Genetic Materials ...73
Phenotyping for Leaf Angle ...74
Experimental Design ...75
Genotyping, Filtering, and Imputation ...77
Genetic Mapping ...78
Results ... 79
Phenotype Data ...79
Modelling Leaf Angle Across the Canopy ...80
Genotype Data, Linkage Map Construction, and Genetic Mapping ...81
Discussion ... 83
Phenotypic Variation ...83
Quantitative Trait Loci ...85
Acknowledgments ... 89
References ... 90
Figures ... 96
Tables ... 100
Supplemental Figures ... 104
Data and Code Availability ... 111
CHAPTER FOUR: HARNESSING GENETIC POTENTIAL FROM THE U.S. MAIZE NATIONAL SEED BANK VIA GENOMIC PREDICTION WITH THE MAIZE ASSOCIATION POPULATION ... 112
Introduction ... 112
Materials and methods ... 115
Genetic Materials ...115
Genotypic Data, Imputation, and Imputation Accuracy ...116
Population Structure ...117
Phenotypes for Training and Empirical Validation Populations ...118
Genomic Prediction and Upper Bound for Prediction Reliability...119
Results ... 120
Genotypic Data, Population Structure, and Upper Bound for Reliability ...120
Phenotypic Data ...122
Cross-validation ...123
Empirical Validation and Upper Bound for Prediction Reliability ...124
Discussion ... 126
Cross-validation Prediction Accuracy ...126
Empirical Validation ...127
Upper Bound for Prediction Reliability ...128
Potential Selection for Yield ...129
Acknowledgments ... 130
References ... 130
Figures ... 134
Supplemental Figures ... 137
Supplemental Tables ... 146
Data and Code Availability ... 148
ACKNOWLEDGMENTS
I would like to thank my advisor Dr. Jianming Yu for showing me patience, guidance, and support during my graduate work. He has made me a better scientist and person.
I would also like to thank my committee members, Dr. Philip Becraft, Dr. Asheesh Singh, Dr. Bing Yang, and Dr. Andy VanLoocke for their time and guidance on my research projects.
I want to thank great mentors that I previously worked with who were instrumental in helping me get into graduate school, Dr. Adam Famoso, Dr. Matthew Campbell, and Dr. Tabare Abadie.
I also want to thank the past and current members of the Quantitative Genetics and Maize Breeding lab, Dr. Xin Li, Dr. Xiaoqing Yu, Dr. Xianran Li, Dr. Tingting Guo, Dr. Adam
Vanous, Jinyu Wang, James McNellie, Qi Mu, Laura Tibbs, Jialu Wei, Paul White, Greg Schoenbaum, and the undergraduate students in our lab, Rebekah Arnold, Kirsten Backes, Own Oeltjenbruns, Alam Ramirez-Reyes, and Andy Herr, who helped me with my research projects. Finally, I want to thank my wife, Donna who provided me with constant love, support, and reminders to stay on track, even though I kept telling told her this should only take a few years.
ABSTRACT
Maize’s (Zea mays L.) leaf angle has changed over the last 60 years because of intense
selection pressure for high yielding hybrids under increasing planting densities. Leaf angle plays a crucial role in distributing sunlight to different canopy leaves and its optimization across the canopy is essential for increasing productivity per unit of land. This dissertation seeks to explain and predict leaf angle variation across multiple canopy levels in maize through genetic mapping, meta-analysis, and genomic prediction.
Two genetic mapping populations were developed using inbred lines B73, PHW30, and Mo17 that represent important maize heterotic groups. The two populations were genotyped using genotyping-by-sequencing (GBS) and phenotyped for lower canopy leaf angle in selected lines from the F2 and F2:3 generations to explain this portion of the canopy’s genetic variation. A
total of 12 quantitative trait loci (QTL) were detected across both populations and generations, including one consistently detected on chromosome 1. The detected QTL were mapped into genomic bins along with QTL from 19 previous studies to gain a comprehensive understanding of the natural variations underlying leaf angle. A meta-analysis with genomic bins revealed 58 genomic hotspots that contained 33 candidate genes. Together, these results enrich our
understanding of the genetic control of lower canopy leaf angle in inbred lines representing the major heterotic groups in maize and provide a roadmap for future researchers to investigate the molecular basis for these natural variations.
Doubled haploids were developed from the selected F2 lines and used to explore leaf
angle variation observed in other portions of the canopy. These were genotyped with GBS and phenotyped for leaf angle across four canopy levels over multiple years for genetic mapping. The four leaf angle phenotypes were regressed on their canopy position to derive three additional
traits and understand how leaf angle fluctuates across the canopy. The relationship between the detected QTL’s effects and canopy position was explored to improve the understanding of how leaf angle is controlled across the canopy. Genetic mapping revealed 59 QTL across the seven traits, including two major effect QTL on chromosomes 1 and 5. Developmental reaction norms of QTL detected across the canopy revealed that genetic effects were either stable or dynamic in response to canopy position. Phenotyping and genetically mapping leaf angle for individual leaves across the canopy revealed new insights into the genetic control of leaf angle across the canopy, and the selection of leaf angle QTL with dynamic effects may be beneficial for developing lines adapted to high planting densities.
It is challenging to predict phenotypes utilizing the knowledge explained from genetic mapping populations to other mapping populations or diverse germplasm. Estimating allelic effects from diverse germplasm can overcome this challenge and be useful in developing prediction models. The predictability of leaf angle at two canopy levels and 34 other traits was investigated using the Maize Association Population, which is a collection of diverse germplasm from breeding programs around the world. This panel was assessed for its predictability for these traits through cross-validation and used to train a prediction model for generating genomic estimated breeding values for the U.S. maize national seed bank. Using two empirical
populations, predictions for nine traits were empirically validated across multiple environments. An upper bound for prediction reliability was calculated for each predicted line and compared with prediction accuracy to investigate their relationship. Prediction accuracy, assessed by cross-validation for the 36 traits, ranged from weak to strong and was highly dependent on a trait’s repeatability. For the two empirically validated leaf angle traits, prediction accuracy was similar to the values obtained during cross-validation. In lines with high prediction reliability values,
higher prediction accuracy was observed. These results suggest the genomic prediction models developed using the Maize Association Population will be a valuable tool to predict leaf angle and other traits for the diverse germplasm at the U.S. maize national seed bank.
The genetic mapping and meta-analysis results provided new insights into explaining the genetic control of leaf angle across multiple canopy levels including identifying candidate genes and revealing QTL effects that are stable or dynamic in response to canopy position. Genomic prediction provided a thorough assessment of the Maize Association Population’s potential for predicting two leaf angle traits along with 34 other traits for accessions in the U.S. maize national seed bank. Together, these findings will be helpful in our effort to optimize leaf angle across the maize canopy in order to increase productivity per unit of land.
CHAPTER ONE: GENERAL INTRODUCTION
The world population is predicted to reach 9.7 billion people by 2050, subsequently boosting agriculture demand by 50% (Liu, 2017). At the same time, a predicted increase in urbanization would put a greater demand on fresh fruits and vegetables and animal-based proteins (Liu, 2017). Maize (Zea mays L.) is an important source of feed grain for animals, and in 2017, ~38% of the maize produced in the U.S. was used as animal feed (USDA). Crop yields need to increase to feed the growing population; however, arable land is only predicted to increase by ~10% during this time, with most of that growth coming from developing countries with limited access to advanced germplasm and current agronomic technology (Alexandros and Bruinsma, 2012). Increasing our productivity per unit of land will be crucial to feed the growing world population.
Increase in Maize Yield
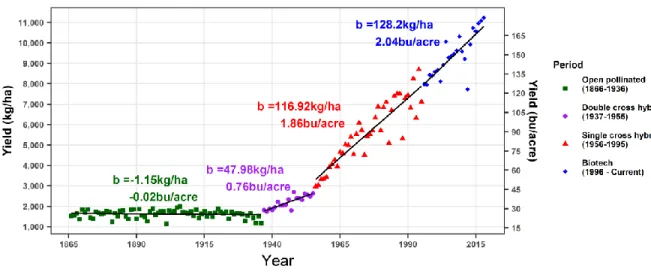
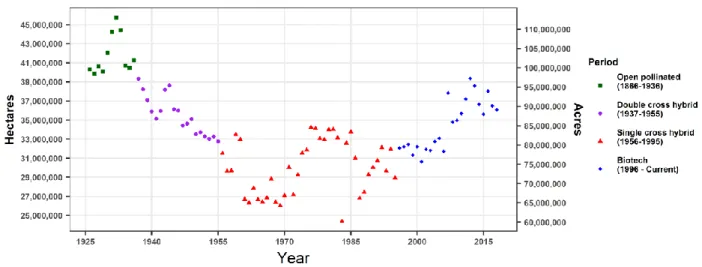
The dramatic sevenfold increase in maize yields over the last 153 years in the U.S. is an excellent example of how we can increase productivity on the same amount of land (USDA-NASS, Fig. 1). While maize yields have been steadily increasing over time, land devoted to maize production has fluctuated but stayed mostly consistent (USDA-NASS, Fig. 2). For example, yearly land devoted to maize production during two 10-year periods, 1937-1946 and 2009-2018, averaged ~37 million hectares (~91 million acres); however, during the earlier period, yearly maize yields averaged 1996.1 kg per hectare (31.8 bushels per acre) compared to the later period that averaged 9810.6 kg per hectare (156.3 bushels per acre, USDA-NASS, Fig. 1 and Fig. 2). This nearly five-fold increase in yearly maize yields between these two periods can
be attributed to numerous advancements in both the breeding and management practices of maize production (Duvick, 2005).
From 1866 to the mid-1930s, open pollinated varieties of maize dominated farmer’s fields. Selection was based on best agronomic practices (single ears for manual harvesting and broad horizontal leaves for weed control), local competition criteria at state fairs or maize shows (best single ear, best ten ears, longest, etc.), and on individual plant performance (Mock and Pearce, 1975; Kutka, 2011). Selection for yield was non-existent or unsuccessful as average maize yields across the U.S. remained stagnant during this time (USDA-NASS, Fig. 1).
The first significant yield increase in maize was derived from Shull’s seminal observations and work on heterosis and hybrid maize development (Shull, 1908, 1909), and Jones’ idea to develop double cross hybrids to overcome the severe inbreeding depression that plagued early inbred lines (Jones, 1918, 1922). Experimental breeding stations and commercial seed companies began developing the double cross hybrids that made it into farmer’s fields in the mid-1920s (Crow, 1998). Farmers saw the yield and uniformity advantage these hybrids offered and adopted this technology rapidly, subsequently increasing maize yields at a rate of 48.0 kg per hectare (0.8 bushels per acre) for the next 18 years (Fig. 1). Producing, testing, and maintaining double cross hybrids was a resource demanding process, and inbred lines were now more uniform, higher yielding than earlier hybrids, and overall adequate seed producers (Crow, 1998). With the benefits of double-cross hybrids diminishing, single cross hybrids populated farmer’s fields, and for the next 39 years yearly maize yields increased at a rate of 116.9 kg per hectare (1.9 bushels per acre, Fig. 1).
Maize Response to Planting Density Increases
The transition to both double and single cross hybrids and other genetic improvements have only accounted for ~50% of the maize yield gains observed (Duvick, 2005). Improved
agronomic practices like weed and pest control and increased usage of fertilizers and planting densities also contributed to yield gains during this period (Duvick, 2005). Ten states, Iowa, Illinois, Indiana, Nebraska, Ohio, Minnesota, Wisconsin, Kansas, Missouri, and South Dakota planted 77% of the maize in the United States during the 2018 growing season (USDA-NASS). For the last 56 years, average planting densities in these ten states have steadily increased from 33,000 plants per hectare (13,000 plants per acre) in 1963 to 72,000 plants per hectare (29,000 plants per acre) in 2018 (Fig. 3). Even with continuous genetic improvements over that time, yield per plant has remained relatively unchanged (Fig. 4).
Little change in yield per plant was also observed in a series of comparative analyses of U.S. commercial maize hybrids released since the 1930’s (Duvick, 1977, 1984, 1992, 2005; Duvick et al., 2004). From these results, it was determined that an increase in density tolerance was a major driver of yield increases since the mid-1960s, or in other words, hybrids are able to maintain the same yield per plant while under high planting density stresses. For example, hybrids released prior to 1960 had higher yields when planted at low densities than at high, and hybrids released after 1960 showed a positive response to higher planting densities (Duvick et al., 2004; Hammer et al., 2009). Similar results from comparative studies utilizing other maize materials have also been obtained (Wang et al., 2011; Ma et al., 2014; Di Matteo et al., 2016).
These types of comparative analyses in different sets of materials are also useful for identifying morphological traits that have changed in response to high selection pressure for yield under increasing planting densities (Duvick et al., 2004; Wang et al., 2011; Ma et al., 2014). Plant and ear height, leaf angle (LA), leaf area, tassel size, anthesis-silking interval, staygreen, and ears per 100 plants are a few examples of the traits evaluated in these studies. Over time, LA has become more upright (Duvick et al., 2004; Wang et al., 2011; Ma et al.,
2014), anthesis-silking interval and tassel size has decreased (Duvick et al., 2004), and the numbers of ears per 100 plants has increased (Duvick et al., 2004; Wang et al., 2011). Coupled with high planting densities, these types of morphological changes have significantly contributed to the observed increase in yield (e.g. Duncan et al., 1967b; Lambert and Johnson, 1978; Duvick et al., 2004)
Light Competition
In the 1930’s, population densities were approximately 21,000 plants per hectare (11,000 plants per acre , Troyer, 2006), resulting in individual maize plants mostly competing with themselves for resources, or intraplant competition, rather than competing with their surrounding neighbors, or intraspecific competition (Donald, 1963). Modern population densities have
increased both intraplant and interspecific competition throughout the growing season for three main resources: water, nutrients, and light. Improved access and usage of irrigation and fertilizer in the U.S. has reduced the effects of water and nutrient stress. In the complete absence of these stresses, the plant’s ability to intercept and convert photosynthetically active radiation (PAR) into dry matter becomes a limiting factor in yield production (Donald, 1951; Blackman and Black, 1959; Monteith and Moss, 1977; Kiniry et al., 1989; Sinclair and Muchow, 1999).
The plant’s intercepted PAR around silking can be used to predict final kernel number (Lizaso et al., 2003), which is a major determinant of maize grain yield (Tollenaar et al., 2000). For example, the tool CERES-Maize models the amount of leaf area per unit of ground area, or leaf area index (LAI), the exponential decrease in available light in a canopy given a particular leaf area, or extinction coefficient (k), and the amount of incoming PAR to predict final kernel number (Lizaso et al., 2003). The two components, k and LAI, are important indicators for determining the amount of PAR the canopy intercepts, and can be directly manipulated by
breeders to improve canopy photosynthesis rates through increasing leaf density and manipulating LA (Monsi and Saeki, 1953; Saeki, 1960).
Plant density increases since the 1930’s in the U.S. has doubled maize hybrid LAI from 2.4 to 4.8, and resulted in a 20% increase in light interception (Lee and Tollenaar, 2007).
Hybrids from the 1930’s had mostly horizontal LAs (Duvick et al., 2004) meaning that the upper portion of the canopy intercepted most of the sunlight. Maize photosynthesis rates (µmol CO2
m-2 s-1) increase as the amount of sunlight increases (µmol m-2 s-1); however, the rate of increase declines after about 50% of full sunlight (Hesketh and Musgrave, 1962; Waggoner et al., 1963; Fletcher et al., 2008). Furthermore, canopy photosynthesis increases as LAI increases up to a critical LAI level, or when 95% of the light is intercepted (Pearce et al., 1965). Modern maize canopies typically reach the critical LAI level (Tollenaar and Lee, 2006); however, depending on canopy architecture, only one or a few leaves in the upper canopy could be intercepting most of the incoming sunlight. As a result, canopy architecture plays a crucial role in the spatial light distribution within the canopy.
Increasing the amount of sunlight reaching the leaves surrounding the ear has numerous benefits for dense maize canopies. A large amount of leaf area is concentrated in the middle and lower parts of the canopy, therefore presenting more opportunities for photosynthesis (Ma et al., 2014). Comparative analyses of Chinese hybrids released since the 1950’s observed that
increased light interception near the ear is positively correlated with grain yield (Ma et al., 2014; Zhao et al., 2015), and even under low light conditions, lower leaves still contribute to grain yield (Schmidt and Colville, 1967). Increasing the amount of sunlight reaching the middle and lower canopy through leaf removal (Schmidt and Colville, 1967; Pendleton and Hammond, 1969) and mirrors (Pendleton et al., 1967) has been shown to increase photosynthesis and yield
in maize. Maize breeders have increased the amount of sunlight reaching the middle and lower levels of the canopy (Zhao et al., 2015) by reducing k (Ma et al., 2014) through direct
manipulation of LA across the canopy.
Modelling different planting densities while altering LA in different parts of the canopy revealed that upright LAs would only increase yield under high planting densities with LAI greater than 4.0 (Duncan et al., 1967a). The results have also suggested that a gradual decrease in LA from upright in the upper canopy to less upright in the lower would result in the ideal maize canopy as it improves and equalizes spatial light distribution throughout the canopy (Duncan et al., 1967a). This type of configuration would improve canopy photosynthesis and partition more assimilates to the ear (Duncan et al., 1967a; Duvick and Cassman, 1999; Lee and Tollenaar, 2007; Hammer et al., 2009; Zhu et al., 2010). As a result, plant and ear growth rates are more efficiently maintained (Moss and Stinson, 1961; Wardlaw, 1990; Hammer et al., 2009), which is crucial for increasing yield, as these two traits are major determinants of yield potential in maize (Jacobs and Pearson, 1991).
The idealized appearance, or ideotype, of a modern maize plant would minimize
competition with other plants in high-density narrow row production fields (Donald, 1968; Mock and Pearce, 1975). Increasing yield by optimizing canopy architecture via LA manipulation has been observed in other species as well. For example, the first green revolution rice variety, IR8, had short plant height but also upright leaves (Hubbart et al., 2007). Examples in other species include barley (Pearce et al., 1967), wheat and oats (Tanner et al., 1966), sugar beets (Watson, 1958), and sorghum (Truong et al., 2015; Xin et al., 2015). These types of canopy architectures favor higher planting densities and narrow row spacing that defines our modern crop production system and helps increase productivity per unit of land.
Genetic Control of Leaf Angle Variation
Many known biological mechanisms can alter LA in maize including loss of ligule and auricle (Becraft et al., 1990; Harper and Freeling, 1996), variations in the auricle size (Kong et al., 2017; Strable et al., 2017), and proteomic differences and changes in midrib cells (Wang et al., 2015; Strable et al., 2017). The ligule and auricle are two structures that separate the blade and the sheath in maize, and a loss of these structures can result in leaves with upright LAs (Becraft et al., 1990; Harper and Freeling, 1996). For example, mutations in two genes,
liguleless1 (lg1)and liguleless2 (lg2), result in this type of phenotype. The lg1 mutant was first
identified as a recessive single gene mutation (Emerson, 1912), and subsequent cloning revealed it encodes a squamosa-promoter binding protein (Moreno et al., 1997). Mutations in this gene cause all leaves to lack an auricle and basic ligules form only in the upper leaves (Becraft et al., 1990). On the other hand, newer leaves on plants with a mutation in lg2 develop more ligule and auricle, such that the upper most leaves develop normal auricles and ligules but remain upright (Harper and Freeling, 1996). This gene was also identified as a recessive single gene mutation (Brink, 1933) and subsequent cloning revealed it encodes a basic leucine zipper protein (Walsh et al., 1998). Research using double mutants revealed that these two genes are likely in the same pathway, where lg2 is upstream and restricts the make ligule and auricle signal to the appropriate location, while lg1 interprets and propagates the signal from lg2 (Harper and Freeling, 1996 and Fig. 5).
Prior research has introgressed these two genes independently into similar genetic
backgrounds to evaluate their effect on grain yield (Pendleton et al., 1968; Lambert and Johnson, 1978). Introgressing lg1 and evaluating the subsequent hybrids under high planting densities resulted in little to no yield increase when compared to the wild-type hybrid and suggests that LA can be too upright and not improve yield (Pendleton et al., 1968; Lambert and Johnson,
1978). In contrast, introgressing lg2 revealed yield increases of 41% (Pendleton et al., 1968) and 11% (Lambert and Johnson, 1978) when compared to the wild-type hybrid. Additionally, ear-barrenness was reduced by 50% (Pendleton et al., 1968) and 61% (Lambert and Johnson, 1978) in these hybrids, which is an important yield determinant in maize.
Through genetic mapping, fine mapping, and comparative genomics previous research has identified additional genes controlling LA in maize. The maize gene ZmTAC1 was identified through a comparative genomics approach that used a gene previously identified in rice, tiller
angle control (OsTAC1) , to identify a homologous maize gene underlying an identified
quantitative trait loci (QTL, Ku et al., 2011). Leaf angle was phenotyped in every leaf in the two parents and revealed ZmTAC1 affected LA in most of the leaves in the canopy, with the largest effect in the leaves in the upper canopy (Ku et al., 2011). Fine-mapping and positional cloning across F2:3 families identified ZmCLA4 (Zhang et al., 2014). Comparative genomics also revealed
this gene to be an orthologue of a previously cloned gene in rice known to affect LA (Li et al., 2007), LAZY1. Mutations in nana plant2 affects numerous plant architecture traits including plant height, branching, and LA, and was found to affect LA for leaves in the upper and lower canopy (Best et al., 2016). Numerous LA related genes have been identified and cloned in rice, and are discussed and presented in more detail in chapter 2.
Numerous studies have conducted genetic and genome-wide association mapping for LA in maize and are summarized and discussed in more detail in Chapter 2. Examples of genetic and genome-wide association mapping for LA in other crops include rice (Li et al., 1999; Hu et al., 2012), sorghum (Truong et al., 2015; Zhao et al., 2016), and wheat (e.g. Sun et al., 2017; Liu et al., 2018). From these studies, both large and small effect QTL have been identified by
The objectives of the first part of this dissertation (chapters 2 and 3) are to 1) investigate the genetic control of lower canopy LA variation in inbred lines representing important heterotic groups in maize; 2) conduct a meta-analysis with previous LA genetic mapping results to gain a comprehensive understanding of natural variations underlying LA in maize; 3) dissect and explain the genetic control of leaf angle variation across multiple canopy levels.
Genomic Prediction for Crop Improvement
Genetic mapping is a powerful method for identifying small and large effect loci controlling important traits of interest. Marker assisted selection (MAS) has been useful for selecting large effect loci for crop improvement (Bernardo, 2008; Sun et al., 2010); however, the quantitative nature of most economically important traits, such as grain yield, have proven difficult to improve through MAS alone due to the complex genetic control and numerous small-effect loci that contribute to these quantitative traits. Further investments in genetic improvement are necessary to continue the impressive increases in genetic gain maize has experienced over the last 60 years.
Identifying informative polymorphisms linked to a trait of interest has traditionally involved developing and testing genetic mapping populations or conducting genome-wide association analyses. Besides involving time and resources to generate this information, the effects of these linked loci can change depending on the genetic background. Next generation sequencing technologies have provided access to an abundant supply of genetic polymorphisms all across the genome, while high-throughput genotyping enables us to test for these informative polymorphisms across a wide array of germplasm. Genomic selection (GS) methodologies can utilize the high-throughput genotyping data to estimate marker effects for all markers and predict phenotypes (Meuwissen et al., 2001; Heffner et al., 2009; Crossa et al., 2017).
Development of statistical models for predicting complex traits using genetic markers has become an important research area in recent years. Two popular methods, genomic best linear unbiased prediction (G-BLUP) and ridge-regression BLUP (RR-BLUP), differ in their
application, but are mathematically equivalent (Habier et al., 2008). The G-BLUP method uses whole-genome markers to estimate genomic relationships that allow information from relatives to predict genomic estimated breeding values (GEBVs) from a mixed linear model. The RR-BLUP method also uses a mixed linear model and considers markers as a random effect with the variance of their effects equal to the genetic variance divided by the total number of markers. This shrinkage avoids over-fitting the model, as high-throughput genotyping usually provides more markers than individuals for prediction. In both cases, phenotypic data is only available for a training population, and this information is used along with genotypic data for the tested and untested material to predict GEBVs for the untested material.
The assumption of equal marker effects closely follows the tenets behind the infinitesimal model (Fisher, 1919); however, even at a low occurrence, genetic mapping and genome-wide association studies have revealed regions of the genome with large effects that influence
complex traits (Kearsey and Farquhar, 1998; Bernardo, 2002). To account for these large effects in GS, Bayesian models have been proposed to model markers with unique variances (BayesA), include some markers with no effects and unique variances (BayesB), and include markers with equal variances and some with no effect (BayesCπ). Other methods have been proposed, but simulation and empirical studies across crop species, including maize, have repeatedly shown that the less computationally demanding RR-BLUP method performs as well as the other complex methods (e.g. Bernardo and Yu, 2007; Heslot et al., 2012; Yu et al., 2016). Under a simpler model that assumes equal marker variances, high marker densities and extensive linkage
disequilibrium within bi-parental populations, for example, may distribute the effects of major QTL to multiple markers, therefore allowing the model to account for these large effect QTL (Lorenz et al., 2011).
The objectives of the second part of this dissertation (chapter 4) are to 1) assess the Maize Association Population’s potential as a training population for two leaf angle traits and 34 others; 2) use the Maize Association Population to train a prediction model and predict GEBVs for the 2,812 lines in the U.S. maize national seed bank; 3) empirically validate predictions for nine traits using two empirical validation populations; 4) investigate the upper bound for reliability for prediction accuracy in this material.
Dissertation Organization
This dissertation contains one published chapter (Chapter 2) and two manuscripts in preparation (Chapters 3 and 4). These three chapters are written in the format of journal articles. Each one contains their own abstract, introduction, materials and methods, results, discussion, and references, therefore the general introduction (Chapter 1) extended on topics not covered in those chapters. A final chapter (Chapter 5) summarizes the major conclusions from each chapter.
References
Alexandros, N., and J. Bruinsma. 2012. World agriculture: towards 2015/2030: an FAO perspective. ESA Work. Pap. 12(03). doi: 10.1016/S0264-8377(03)00047-4.
Becraft, P.W., D.K. Bongard-Pierce, A.W. Sylvester, R.S. Poethig, and M. Freeling. 1990. The liguleless-1 gene acts tissue specifically in maize leaf development. Dev. Biol. 141(1): 220– 232. doi: 10.1016/0012-1606(90)90117-2.
Bernardo, R. 2002. Breeding for quantitative traits in plants. Stemma Press, Woodbury, MN. Bernardo, R. 2008. Molecular Markers and Selection for Complex Traits in Plants: Learning
from the Last 20 Years. Crop Sci. 48(5): 1649. doi: 10.2135/cropsci2008.03.0131. Bernardo, R., and J. Yu. 2007. Prospects for genomewide selection for quantitative traits in
Best, N.B., T. Hartwig, J. Budka, S. Fujioka, G. (Guri) S. Johal, B. Schulz, and B.P. Dilkes. 2016. nana plant2 encodes a maize ortholog of the Arabidopsis brassinosteroid biosynthesis protein Dwarf1, identifying developmental interactions between brassinosteroids and gibberellins. Plant Physiol. 171(August): pp.00399.2016. doi: 10.1104/pp.16.00399. Blackman, G.E., and J.N. Black. 1959. Physiological and Ecological Studies in the Analysis of
Plant Environment. Ann. Bot. 23(1): 51–63. doi: 10.1093/oxfordjournals.aob.a083643. Brink, R.A. 1933. Heritable Characters in Maize XLVI-Liguleless-2*. J. Hered. 24(8): 325–326.
doi: 10.1093/oxfordjournals.jhered.a103818.
Crow, J.F. 1998. 90 years ago: the beginning of hybrid maize. Genetics 148(3): 923–8.
Crossa, J., P. Pérez-Rodríguez, J. Cuevas, O. Montesinos-López, D. Jarquín, G. de los Campos, J. Burgueño, J.M. Camacho-González, S. Pérez-Elizalde, Y. Beyene, S. Dreisigacker, R. Singh, X. Zhang, M. Gowda, M. Roorkiwal, J. Rutkoski, and R.K. Varshney. 2017.
Genomic Selection in Plant Breeding: Methods, Models, and Perspectives. Trends Plant Sci. xx: 1–15. doi: 10.1016/j.tplants.2017.08.011.
Donald, C.M. 1951. Competition among pasture plants. I. Intraspecific competition among annual pasture plants. Aust. J. Agric. Res. 2(4): 355–376. doi: 10.1071/AR9510355. Donald, C.M. 1963. Competition Among Crop and Pasture Plants. p. 1–118. In Advances in
Agronomy. Cambridge University Press, Cambridge.
Donald, C.M. 1968. The breeding of crop ideotypes. Euphytica 17(3): 385–403. doi: 10.1007/BF00056241.
Duncan, W.G., R.S. Loomis, W.A. Williams, and R. Hanau. 1967a. A model for simulating photosynthesis in plant communities. Hilgardia 38(4): 181–205. doi:
10.3733/hilg.v38n04p181.
Duncan, W.G., W.A. Williams, and R.S. Loomis. 1967b. Tassels and the Productivity of Maize. Crop Sci. 7(1): 37. doi: 10.2135/cropsci1967.0011183X000700010013x.
Duvick, D.N. 1977. Genetic rates of gain in hybrid maize yields during the past 40 years. Maydica 22: 187–196.
Duvick, D.N. 1984. Genetic Contributions to Yield Gains of U.S. Hybrid Maize, 1930 to 1980. p. 15–47. In Fehr, W.R. (ed.), Genetic Contributions to Yield Gains of Five Major Crop Plants.
Duvick, D.N. 1992. Genetic contributions to advances in yield of US maize. Maydica (37): 69– 79.
Duvick, D.N. 2005. Genetic progress in yield of United States maize (Zea mays L.). Maydica 50(3–4): 193–202.
Duvick, D.N., and K.G. Cassman. 1999. Post–Green Revolution Trends in Yield Potential of Temperate Maize in the North-Central United States. Crop Sci. 39(6): 1622. doi:
10.2135/cropsci1999.3961622x.
Duvick, D.N., J.S.C. Smith, and M. Cooper. 2004. Long-Term Selection in a Commercial Hybrid Maize Breeding Program. p. 109–151. In Janick, J. (ed.), Plant Breeding Reviews: Long-term Selection: Crops, Animals, and Bacteria. John Wiley & Sons, Inc., Oxford, UK.
Emerson, R.A. 1912. The inheritance of the ligule and auricle of corn leaves. Neb. Agr. Exp. Sta. An. Rep. 25(1): 81–85.
Fisher, R.A. 1919. XV.—The Correlation between Relatives on the Supposition of Mendelian Inheritance. Trans. R. Soc. Edinburgh 52(02): 399–433. doi: 10.1017/S0080456800012163. Fletcher, A.L., D.J. Moot, and P.J. Stone. 2008. Radiation use efficiency and leaf photosynthesis
of sweet corn in response to phosphorus in a cool temperate environment. Eur. J. Agron. 29(2–3): 88–93. doi: 10.1016/j.eja.2008.04.002.
Habier, D., R.L. Fernando, and J.C.M. Dekkers. 2008. The impact of genetic relationship information on genome-assisted breeding values. Genetics 177(4): 2389–2397. doi: 10.1534/genetics.107.081190.
Hammer, G.L., Z. Dong, G. McLean, A. Doherty, C. Messina, J. Schussler, C. Zinselmeier, S. Paszkiewicz, and M. Cooper. 2009. Can changes in canopy and/or root system architecture explain historical maize yield trends in the U.S. corn belt? Crop Sci. 49(1): 299–312. doi: 10.2135/cropsci2008.03.0152.
Harper, L., and M. Freeling. 1996. Interactions of liguleless1 and liguleless2 function during ligule induction in maize. Genetics 144(4): 1871–82.
Heffner, E.L., M.E. Sorrells, and J.-L. Jannink. 2009. Genomic Selection for Crop Improvement (RK Varshney, M Roorkiwal, and ME Sorrells, Eds.). Crop Sci. 49(1): 1. doi:
10.2135/cropsci2008.08.0512.
Hesketh, J.D., and R.B. Musgrave. 1962. Photosynthesis Under Field Conditions. IV. Light Studies with Individual Corn Leaves. Crop Sci. 2(4): 311. doi:
10.2135/cropsci1962.0011183X000200040011x.
Heslot, N., H.-P. Yang, M.E. Sorrells, and J.-L. Jannink. 2012. Genomic Selection in Plant Breeding: A Comparison of Models. Crop Sci. 52(1): 146. doi:
Hu, W., H. Zhang, J. Jiang, Y. Wang, D. Sun, X. Wang, K. Liang, and D. Hong. 2012. Genetic Analysis and QTL Mapping of Large Flag Leaf Angle Trait in Japonica Rice. Rice Sci. 19(4): 277–285. doi: 10.1016/S1672-6308(12)60052-3.
Hubbart, S., S. Peng, P. Horton, Y. Chen, and E.H. Murchie. 2007. Trends in leaf photosynthesis in historical rice varieties developed in the Philippines since 1966. J. Exp. Bot. 58(12): 3429–3438. doi: 10.1093/jxb/erm192.
Jacobs, B.C., and C.J. Pearson. 1991. Potential yield of maize, determined by rates of growth and development of ears. F. Crop. Res. 27(3): 281–298. doi: 10.1016/0378-4290(91)90067-6. Jones, D.F. 1918. The Effect of Inbreeding and Crossbreeding Upon Development. Proc. Natl.
Acad. Sci. U. S. A. 4(8): 246–250. doi: 10.1073/pnas.4.8.246.
Jones, D.F. 1922. The Productiveness of Single and Double First Generation Corn Hybrids. Agron. J. 14(6): 241. doi: 10.2134/agronj1922.00021962001400060006x.
Kearsey, M.J., and A.G.L. Farquhar. 1998. QTL analysis in plants; where are we now? Heredity (Edinb). 80(2): 137–142. doi: 10.1046/j.1365-2540.1998.00500.x.
Kiniry, J.R., C.A. Jones, J.C. O’toole, R. Blanchet, M. Cabelguenne, and D.A. Spanel. 1989. Radiation-use efficiency in biomass accumulation prior to grain-filling for five grain-crop species. F. Crop. Res. 20(1): 51–64. doi: 10.1016/0378-4290(89)90023-3.
Kong, F., T. Zhang, J. Liu, S. Heng, Q. Shi, H. Zhang, Z. Wang, L. Ge, P. Li, X. Lu, and G. Li. 2017. Regulation of Leaf Angle by Auricle Development in Maize. Mol. Plant 10(3): 516– 519. doi: 10.1016/j.molp.2017.02.001.
Ku, L., X. Wei, S. Zhang, J. Zhang, S. Guo, and Y. Chen. 2011. Cloning and Characterization of a Putative TAC1 Ortholog Associated with Leaf Angle in Maize (Zea mays L.). PLoS One 6(6): 1–7. doi: 10.1371/journal.pone.0020621.
Kutka, F. 2011. Open-pollinated vs. hybrid maize cultivars. Sustainability 3(9): 1531–1554. doi: 10.3390/su3091531.
Lambert, R.J., and R.R. Johnson. 1978. Leaf angle, tassel morphology, and the performance of maize hybrids. Crop Sci. 18: 499–502. doi:
10.2135/cropsci1978.0011183X001800030037x.
Lee, E.A., and M. Tollenaar. 2007. Physiological Basis of Successful Breeding Strategies for Maize Grain Yield. Crop Sci. 47(SUPPL. DEC.): 203–215. doi:
10.2135/cropsci2007.04.0010IPBS.
Li, Z., A.H. Paterson, S.R.M. Pinson, and J.W. Stansel. 1999. RFLP facilitated analysis of tiller and leaf angles in rice (Oryza sativa L.). Euphytica 109(2): 79–84. doi:
Li, P., Y. Wang, Q. Qian, Z. Fu, M. Wang, D. Zeng, B. Li, X. Wang, and J. Li. 2007. LAZY1 controls rice shoot gravitropism through regulating polar auxin transport. Cell Res. 17(5): 402–410. doi: 10.1038/cr.2007.38.
Liu, P. 2017. The future of food and agriculture: Trends and challenges.
Liu, K., H. Xu, G. Liu, P. Guan, X. Zhou, H. Peng, Y. Yao, Z. Ni, Q. Sun, and J. Du. 2018. QTL mapping of flag leaf-related traits in wheat (Triticum aestivum L.). Theor. Appl. Genet. 131(4): 839–849. doi: 10.1007/s00122-017-3040-z.
Lizaso, J.., W.. Batchelor, M.. Westgate, and L. Echarte. 2003. Enhancing the ability of CERES-Maize to compute light capture. Agric. Syst. 76(1): 293–311. doi:
10.1016/S0308-521X(02)00003-3.
Lorenz, A.J., S. Chao, F.G. Asoro, E.L. Heffner, T. Hayashi, H. Iwata, K.P. Smith, M.E. Sorrells, and J.L. Jannink. 2011. Genomic Selection in Plant Breeding. Knowledge and Prospects. 1st ed. Elsevier Inc.
Ma, D.L., R.Z. Xie, X.K. Niu, S.K. Li, H.L. Long, and Y.E. Liu. 2014. Changes in the morphological traits of maize genotypes in China between the 1950s and 2000s. Eur. J. Agron. 58: 1–10. doi: 10.1016/j.eja.2014.04.001.
Di Matteo, J.A., J.M. Ferreyra, A.A. Cerrudo, L. Echarte, and F.H. Andrade. 2016. Yield potential and yield stability of Argentine maize hybrids over 45 years of breeding. F. Crop. Res. 197: 107–116. doi: 10.1016/j.fcr.2016.07.023.
Meuwissen, T.H.E., B.J. Hayes, and M.E. Goddard. 2001. Prediction of Total Genetic Value Using Genome-Wide Dense Marker Maps. Genetics 157(4): 1819–1829. doi: 11290733. Mock, J.J., and R.B. Pearce. 1975. An ideotype of maize. Euphytica 24(3): 613–623. doi:
10.1007/BF00132898.
Monsi, M., and T. Saeki. 1953. On the factor light in plant communities and its importance for matter production. Japenese J. Bot. 14: 22–52. doi: 10.1093/aob/mci052.
Monteith, J.L., and C.J. Moss. 1977. Climate and the Efficiency of Crop Production in Britain. Philos. Trans. R. Soc. B Biol. Sci. 281(980): 277–294. doi: 10.1098/rstb.1977.0140. Moreno, M.A., L.C. Harper, R.W. Krueger, S.L. Dellaporta, and M. Freeling. 1997. liguleless1
encodes a nuclear-localized protein required for induction of ligules and auricles during maize leaf organogenesis. Genes Dev. 11(5): 616–628. doi: 10.1101/gad.11.5.616.
Moss, D.N., and H.T. Stinson. 1961. Differential Response of Corn Hybrids to Shade. Crop Sci. 1(6): 416. doi: 10.2135/cropsci1961.0011183X000100060009x.
Pearce, R.B., R.H. Brown, and R.E. Blaser. 1965. Relationships between Leaf Area Index, Light Interception and Net Photosynthesis in Orchardgrass1. Crop Sci. 5(6): 553. doi:
Pearce, R.B., R.H. Brown, and R.E. Blaser. 1967. Photosynthesis In Plant Communities As Influenced By Leaf Angle. Crop Sci. 7(4): 321–324. doi:
10.2135/cropsci1967.0011183X000700040012x.
Pendleton, J.W., D.B. Egli, and D.B. Peters. 1967. Response of Zea mays L. to a “Light Rich” Field Environment. Agron. J. 59(5): 395–397. doi:
10.2134/agronj1967.00021962005900050003x.
Pendleton, J.W., and J.J. Hammond. 1969. Relative Photosynthetic Potential for Grain Yield of Various Leaf Canopy Levels of Corn1. Agron. J. 61(6): 911. doi:
10.2134/agronj1969.00021962006100060025x.
Pendleton, J.W., G.E. Smith, S.R. Winter, and T.J. Johnston. 1968. Field investigations of leaf angle in corn (Zea mays L) to grain yield and apparent photosynthesis. Agron. J. 60(4): 422-424.
Saeki, T. 1960. Interrelationships between Leaf Amount, Light Distribution and Total Photosynthesis in a Plant Community. Shokubutsugaku Zasshi 73(860): 55–63. doi: 10.15281/jplantres1887.73.55.
Schmidt, W.H., and W.L. Colville. 1967. Yield and Yield Components of Zea mays L. as Influenced by Artificially Induced Shade1. Crop Sci. 7(2): 137. doi:
10.2135/cropsci1967.0011183X000700020013x.
Shull, G.H. 1908. The Composition of a Field of Maize. J. Hered. os-4(1): 296–301. doi: 10.1093/jhered/os-4.1.296.
Shull, G.H. 1909. A Pure-Line Method in Corn Breeding. J. Hered. os-5(1): 51–58. doi: 10.1093/jhered/os-5.1.51.
Sinclair, T.R., and R.C. Muchow. 1999. Radiation Use Efficiency. p. 215–265. In Sparks, D.L. (ed.), Advances in Agronomy.
Strable, J., J.G. Wallace, E. Unger-Wallace, S. Briggs, P. Bradbury, E.S. Buckler, and E. Vollbrecht. 2017. Maize YABBY Genes drooping leaf1 and drooping leaf2 Regulate Plant Architecture. Plant Cell 29(July): tpc.00477.2016. doi: 10.1105/tpc.16.00477.
Sun, Y., J. Wang, J.H. Crouch, and Y. Xu. 2010. Efficiency of selective genotyping for genetic analysis of complex traits and potential applications in crop improvement. Mol. Breed. 26(3): 493–511. doi: 10.1007/s11032-010-9390-8.
Sun, C., F. Zhang, X. Yan, X. Zhang, Z. Dong, D. Cui, and F. Chen. 2017. Genome-wide association study for 13 agronomic traits reveals distribution of superior alleles in bread wheat from the Yellow and Huai Valley of China. Plant Biotechnol. J. 15(8): 953–969. doi: 10.1111/pbi.12690.
Tanner, J.W., C.J. Gardener, N.C. Stoskopf, and K. Reinbergs. 1966. SOME OBSERVATIONS ON UPRIGHT-LEAF-TYPE SMALL GRAINS. Can. J. Plant Sci. 46(6): 690–690. doi: 10.4141/cjps66-115.
Tollenaar, M., L.M. Dwyer, D.W. Stewart, and B.L. Ma. 2000. Physiological Parameters
Associated with Differences in Kernel Set Among Maize Hybrids. p. 115–130. In Westgate, M.E., Boote, K. (eds.), Physiology and Modeling Kernel Set in Maize CSSA Special
Publication 29.
Tollenaar, M., and E.A. Lee. 2006. Dissection of physiological precesses underlying grain yield in maize by examining genetic improvement and heterosis. Maydica 51: 399–408.
Troyer, A.F. 2006. Adaptedness and heterosis in corn and mule hybrids. Crop Sci. 46(2): 528– 543. doi: 10.2135/cropsci2005.0065.
Truong, S.K., R.F. McCormick, W.L. Rooney, and J.E. Mullet. 2015. Harnessing genetic variation in leaf angle to increase productivity of sorghum bicolor. Genetics 201(3): 1229– 1238. doi: 10.1534/genetics.115.178608.
Waggoner, P.E., D.N. Moss, and J.D. Hesketh. 1963. Radiation in the Plant Environment and Photosynthesis. Agron. J. 55(1): 36. doi: 10.2134/agronj1963.00021962005500010014x. Walsh, J., C.A. Waters, and M. Freeling. 1998. The maize gene liguleless2 encodes a basic
leucine zipper protein involved in the establishment of the leaf blade-sheath boundary. Genes Dev. 12(2): 208–218. doi: 10.1101/gad.12.2.208.
Wang, N., D. Cao, F. Gong, L. Ku, Y. Chen, and W. Wang. 2015. Differences in properties and proteomes of the midribs contribute to the size of the leaf angle in two near-isogenic maize lines. J. Proteomics 128: 113–122. doi: 10.1016/j.jprot.2015.07.027.
Wang, T., X. Ma, Y. Li, D. Bai, C. Liu, Z. Liu, X. Tan, Y. Shi, Y. Song, M. Carlone, D. Bubeck, H. Bhardwaj, E. Jones, K. Wright, and S. Smith. 2011. Changes in yield and yield
components of single-cross maize hybrids released in China between 1964 and 2001. Crop Sci. 51(2): 512–525. doi: 10.2135/cropsci2010.06.0383.
Wardlaw, I.F. 1990. The control of carbon partitioning in plants. New Phytol. 116(3): 341–381. doi: 10.1111/j.1469-8137.1990.tb00524.x.
Watson, D.J. 1958. The Dependence of Net Assimilation Rate on Leaf-area Index. Ann. Bot. 22(1): 37–54. doi: 10.1093/oxfordjournals.aob.a083596.
Xin, Z., D. Gitz, G. Burow, C. Hayes, and J.J. Burke. 2015. Registration of Two Allelic Erect Leaf Mutants of Sorghum. J. Plant Regist. 9(2): 254. doi: 10.3198/jpr2014.09.0060crgs. Yu, X., X. Li, T. Guo, C. Zhu, Y. Wu, S.E. Mitchell, K.L. Roozeboom, D. Wang, M.L. Wang,
G.A. Pederson, T.T. Tesso, P.S. Schnable, R. Bernardo, and J. Yu. 2016. Genomic prediction contributing to a promising global strategy to turbocharge gene banks. Nat. Plants 2(10). doi: 10.1038/nplants.2016.150.
Zhang, J., L.X. Ku, Z.P. Han, S.L. Guo, H.J. Liu, Z.Z. Zhang, L.R. Cao, X.J. Cui, and Y.H. Chen. 2014. The ZmCLA4 gene in the qLA4-1 QTL controls leaf angle in maize (Zea mays L.). J. Exp. Bot. 65(17): 5063–5076. doi: 10.1093/jxb/eru271.
Zhao, J., M.B. Mantilla-Perez, J. Hu, and M.G. Salas Fernandez. 2016. Genome-Wide
Association Study for Nine Plant Architecture Traits in Sorghum. Plant Genome 9(2): 0. doi: 10.3835/plantgenome2015.06.0044.
Zhao, J., X. Yang, X. Lin, G.F. Sassenrath, S. Dai, S. Lv, X. Chen, F. Chen, and G. Mi. 2015. Radiation Interception and Use Efficiency Contributes to Higher Yields of Newer Maize Hybrids in Northeast China. Agron. J. (November): 1473–1480. doi:
10.2134/agronj14.0510.
Zhu, X.-G., S.P. Long, and D.R. Ort. 2010. Improving Photosynthetic Efficiency for Greater Yield. Annu. Rev. Plant Biol. 61(1): 235–261. doi: 10.1146/annurev-arplant-042809-112206.
Figures
Fig. 1. Maize yield in the U.S. over the last 153 years. Data from the USDA-NASS was used to investigate the increase in maize yield across four different periods: open pollinated (1866-1936), double cross hybrid (1937-1955), single cross hybrid (1956-1995), and biotech (1996-current). Agronomic and breeding improvements have continuously increased yield in the U.S. over this time.
Fig. 2. Maize planted in the U.S. over the last 93 years. Data from the USDA-NASS was used to investigate amount of land devoted to maize production four different periods: open pollinated (1866-1936), double cross hybrid (1937-1955), single cross hybrid (1956-1995), and biotech (1996-current). The amount of land over the last 93 years has fluctuated, but has remained consistent over this time.
Fig. 3. Planting density has been increasing across ten states. Data from the USDA-NASS was used to investigate planting density for ten states across the U.S. Corn Belt: Iowa, Illinois, Indiana, Nebraska, Ohio, Minnesota, Wisconsin, Kansas, Missouri, and South Dakota. A weighted average by the number of hectares planted was used to calculate the average planting density across all ten states. Planting density has been increasing at a steady rate for the last 56 years.
Fig. 4. Yield per plant has remained constant across ten states. Data from the USDA-NASS was used to calculate yield per plant for ten states across the U.S. corn belt: Iowa, Illinois, Indiana, Nebraska, Ohio, Minnesota, Wisconsin, Kansas, Missouri, and South Dakota. Yield per plant was determined by multiplying the total hectares planted by the yield per hectare and dividing by the plant density per hectare multiplied by the total hectares planted. A weighted average by the number of hectares planted was used to calculate the average yield per plant across all ten states. Yield per plant has remained constant for the last 56 years.
Fig. 5. Leaf development with mutants of liguleless1 and liguleless2. The ligule and auricle help control leaf angle variation in maize. This illustration depicts the previously proposed pathway that represents how the ligule and auricle formation can be disrupted by mutations in two genes: liguless1 (lg1) and liguless2 (lg2).
CHAPTER TWO: DISSECTION OF LEAF ANGLE VARIATION IN MAIZE THROUGH GENETIC MAPPING AND META-ANALYSIS
Matthew J. Dzievit, Xianran Li, and Jianming Yu
Modified from a manuscript that was published in the Plant Genome. Abstract, structure, and references are formatted according to the journal standards.
Abstract
Maize (Zea mays L.) hybrids have transitioned to upright leaf angles (LAs) over the last 50 yr as maize yields and planting densities increased concurrently. Genetic mapping and a meta-analysis were conducted in the present study to dissect genetic factors controlling LA variation. We developed mapping populations using inbred lines B73 (Iowa Stiff Stalk Synthetic), PHW30 (Iodent, ex-plant variety protection inbred), and Mo17 (Non-Stiff Stalk Synthetic) that have distinct LA architectures and represent three important heterotic groups in the United States. These populations were genotyped using genotyping-by-sequencing (GBS), and phenotyped for LA in the F2 and F2:3 generation. Inclusive composite interval mapping across the two
generations of the mapping populations revealed 12 quantitative trait loci (QTL), and a consistent QTL on chromosome 1 explained 10 to 17% of the phenotypic variance. To gain a comprehensive understanding of natural variations underlying LA variation, these detected QTL were compared with results from 19 previous studies. In total, 495 QTL were compiled and mapped into 143 genomic bins. A meta-analysis revealed that 58 genomic bins were associated with LA variation. Thirty-three candidate genes were identified in these genomic bins. Together, these results provide evidence of QTL controlling LA variation from inbred lines representing three important heterotic groups in the United States, and a useful resource for future research
into the molecular variants underlying specific regions of the genome associated with LA variation.
Introduction
For the past 50 yr, maize yields and planting densities in the United States have increased concurrently. A comparative analysis of U.S. commercial maize hybrids released since the 1960s revealed that by selecting high yielding hybrids under high planting densities, breeders indirectly selected hybrids with upright LAs (Duvick et al., 2004). Similar results from other maize
materials were obtained (Wang et al., 2011; Ma et al., 2014).
Simulation (Duncan et al., 1967; Hammer et al., 2009) and empirical evidence (Lee and Tollenaar, 2007; Zhao et al., 2015) suggests that upright LAs combined with higher planting densities improve light distribution within the canopy. For example, modern hybrids intercept 14% more light than older hybrids (Lee and Tollenaar, 2007), and the increased light intercepted from leaves near the ear is positively correlated with grain yield (Ma et al., 2014; Zhao et al., 2015). Furthermore, modeling has suggested that LAs should gradually transition from upright in the upper canopy to less upright in the lower as this configuration would distribute solar energy across multiple leaves while maximizing the total solar energy absorbed by the canopy (Duncan et al., 1967; Zhu et al., 2010). A recent study indicated that LA in the upper canopy was
negatively correlated with grain yield, while LA in the lower canopy was positively correlated (Zhang et al., 2017), confirming the earlier suggestion about canopy configuration on grain yield.
Given LA’s role in the adaptation of maize hybrids to high planting densities, it is beneficial to understand the genetic control of LA variation. Five maize genes that modify LA for multiple leaves in the canopy have been cloned: liguleless1 (lg1, Moreno et al., 1997), liguleless2 (lg2,
al., 2016). These genes exhibit different types of dominance; for example, lg1 (Becraft et al., 1990) and lg2 (Harper and Freeling, 1996) are recessive mutations that result in upright LAs, whereas CLA4 exhibits incomplete dominance (Zhang et al., 2014).
Prior research has identified many QTL controlling LA variation in maize by phenotyping different leaves in the canopy, particularly leaves below the flag leaf (final leaf) and surrounding the ear. However, little research has investigated LA in the lower canopy, specifically below the ear. Previous studies used a meta-analysis to integrate a subset of reported QTL to identify multiple meta-QTL for LA and other canopy architecture traits (Ku et al., 2012; Wang et al., 2016; Zhao et al., 2018). Several known genes physically mapped near these meta-QTL, yet a large-scale meta-analysis for only LA to facilitate separating the genetic control of LA from other canopy architecture traits has not been conducted.
The U.S. Plant Variety Protection (PVP) Act of 1970 allows private companies to protect the proprietary inbred lines they develop for a set period. As the protection expires for these inbred lines, they become publicly available to explore their genetic diversity. These ex-PVP lines have attracted a lot of attention, with prior research suggesting that today’s germplasm can be traced back to contributions from seven progenitor lines that include public inbred lines B73, Mo17, and PH207 (Mikel and Dudley, 2006; Nelson et al., 2008; Mikel, 2011). These inbred lines represent three important heterotic groups in maize: Iowa Stiff Stalk Synthetic (BSSS), Non-Stiff Stalk (NSS), and Iodent, respectively (Mikel and Dudley, 2006; Mikel, 2011). Investigating LA in lines representing these heterotic groups provides us an opportunity to identify significant regions of the genome that have contributed to modern hybrid’s transition to upright LAs.
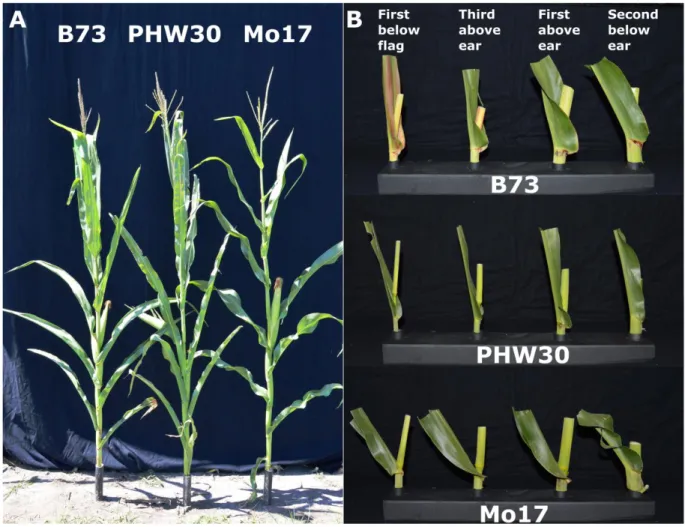
In this study, we report the discovery of 12 QTL linked to LA in the lower canopy by genetic linkage mapping. We first developed biparental populations using three different parents (Fig. 1).
Selected F2 lines were genotyped using GBS and both the selected F2 lines and F2:3 families were
phenotyped for LA. Inclusive composite interval mapping was conducted to map QTL for LA in both generations. To gain a comprehensive understanding of natural variations underlying LA, we integrated our findings with other reported QTL into genomic bins and conducted a meta-analysis to identify regions of the genome associated with LA variation across a wide range of germplasm.
Materials and Methods Genetic Materials
Genetic mapping populations were developed using three inbred lines with distinct LA architectures (Fig. 1) that represent three important maize heterotic groups. Inbred line B73 is a BSSS inbred released from Iowa State University in 1972 (Russell, 1972). It has broad leaves, upright LAs in the upper canopy, and slightly less upright LAs below the ear (Fig. 1). Inbred line PHW30 is an ex-PVP Iodent inbred (PVP number 9100102) developed by Pioneer Hi-Bred in the late 1980s. It has a distinct plant architecture with thin wavy leaves and upright LAs
throughout the canopy (Fig. 1), characteristics similar to modern inbred lines. Inbred line Mo17 is a NSS inbred line the University of Missouri released in 1964 (Zuber, 1973). It has broad leaves and relatively flat LAs throughout the canopy (Fig. 1).
In the summer of 2013, we made reciprocal crosses between PHW30 and each of the two other inbreds. The F1 plants were selfed in a 2014 winter nursery, and in the following summer,
500 F2 seeds from each population were planted at 72,000 plants per hectare (~29,000 plants per
acre) in ~5.5-m-long plots spaced ~76 cm apart. We combined reciprocal populations, as there were no biologically significant LA differences (Table 1) and herein refer to them as B73 and Mo17 populations.
We applied a modified bidirectional selective genotyping strategy (Lander and Botstein, 1989) by including F2 plants with phenotypic values around the population mean in addition to
two trait extreme groups. From the B73 population, we selected 44 F2 plants with the highest
phenotypic values, 45 F2 plants with the lowest, and 36 F2 plants equal to the population mean,
and from the Mo17 population, we selected 46, 45, and 34 plants, respectively. These three groups are referred to as the upright, flat, and average groups, respectively. In the summer of 2015, 25 F2:3 seeds from selected F2 plants were planted in a single replicate under the same
planting conditions. Three representative plants from the middle of the plot were phenotyped for LA, and the calculated mean was recorded as the plot’s phenotypic value. In total, 125 F2:3
families were planted for each population, but only 123 F2:3 families were phenotyped for the
B73 population and 120 F2:3 families for the Mo17 population.
Phenotyping for Leaf Angle
The second leaf below the ear leaf was phenotyped for LA on parents, hybrids, F2 lines, and
F2:3 families starting after all plants completed anthesis. Leaf angle was phenotyped for this leaf
because it contrasted the most among the three parents (Fig. 1). A digital image of each plant’s LA was captured with the Field Book Phenotyping app (version 2.3.0; Rife and Poland, 2014) on a Google Nexus 7 Android Tablet. The angle between horizontal and middle of the midrib was measured on each image with ImageJ’s angle tool (Schneider et al., 2012). The R open source statistical programming language and environment (R Core Development Team, 2017) and in-house R scripts were used to analyze the phenotypic data.
Genotyping, Filtering, and Imputation
To map QTL associated with LA variation, DNA was extracted from F2:3 families. We
original F2 plant genotype (Schon et al., 1994). In total, 125 F2:3 families from each population
were tissue sampled.
DNA was extracted with a Qiagen DNA extraction kit and then digested with ApeKI and barcoded for 288-plex GBS (Elshire et al., 2011). Single nucleotide polymorphisms (SNPs) were called from the sequencing reads with the Tassel5-GBS Production Pipeline using the
ZeaGBSv2.7 Production TOPM and reported as B73 RefGen_v2 physical positions (Glaubitz et al., 2014). FILLIN and maize donor haplotypes (V5) were used for SNP imputation (Swarts et al., 2014).
The SNPs were identified in the parents and then filtered and corrected for allelic dropouts in the progeny using in-house java scripts. The parental lines for each population were first
compared to identify SNPs. These SNPs were selected in the progeny, and SNPs with >15% missing data and segregation distortion (by testing the Mendelian segregation ratio with a p -value <0.001) were removed. A sliding window algorithm with a 15-SNP window and an 1-SNP step (Su et al., 2017) was applied to address heterozygous genotypes called as homozygous because of low read coverage associated with the GBS method (Elshire et al., 2011).
Quantitative Trait Loci Mapping
IciMapping software (version 4.0.6.0; Meng et al., 2015) was used to map QTL. PHW30 was labeled as parent A for both populations and coded appropriately. Markers in linkage
disequilibrium were binned using the following software options: missing rate percentage was set to 100, p-value distortion was set to 0 to omit this option, and markers in complete linkage disequilibrium were deleted randomly. The genetic maps were constructed with the binned markers and the Kosambi mapping function based on anchor (chromosome) and marker order (physical position) software options. Integrating the two genetic maps to construct a consensus
genetic map was implemented with the R package LPmerge (version 1.6; Endelman and Plomion, 2014). Inclusive composite interval mapping of additive and dominant QTL was conducted with the consensus map and using the following software options: a 1-cM step, a 0.001 PIN size, and a 3.0 logarithm of odds (LOD) significance threshold. Physical positions for the detected QTL were converted to B73 RefGen_v3 using the assembly converter tool on Ensembl (Herrero et al., 2017). In addition, a genome-wide single-marker scan with physical distance and uncorrected genotypic data was conducted with 19,970 SNPs from the B73 population and 11,991 SNPs from the Mo17 population to corroborate the inclusive composite interval mapping results.
Meta–Quantitative Trait Loci Analysis
To anchor findings from this study, reported information from 19 previous studies was compiled and summarized. The position of the leaves used for phenotyping LA was summarized, and they were partitioned into six canopy levels to look for patterns connecting detected QTL and position within the canopy. The markers flanking the QTL were converted to physical positions with the locus search and BLAST function on MaizeGDB (Andorf et al., 2010; Cannon et al., 2011) and the bin location according to MaizeGDB or the original study. The assembly converter tool on Ensembl (Herrero et al., 2017) was used to convert all physical positions to B73 RefGen_v3.
We adapted a meta-analysis method (Wuschke et al., 2007) that uses physical positions of reported QTL to identify regions of the genome associated with LA variation. Reported QTL were declared significant with a LOD score, p-value, or likelihood ratio. The LOD scores were multiplied by 2 × ln(10) to obtain the likelihood ratio as it is asymptotically distributed as a χ2 statistic. We obtained p-values for the χ2 statistics using one degree of freedom. For QTL defined
by a physical interval, the QTL was represented by the interval midpoint. Each chromosome was divided into 10-Mb genomic bins, and the reported QTL were mapped to a genomic bin within a chromosome. Physical map-based genomic bins were used to circumvent differences in marker systems and genetic map lengths reported from the different studies. By retaining QTL with the lowest p-value in genomic bins where multiple QTL were detected from the same study and canopy level, we obtained a set of nonredundant QTL. A Z-test weighted by sample size from the original study combined p-values within genomic bins (Zaykin, 2011) and was implemented with the combine.test function from R package survcomp (version 1.3; Schröeder et. al, 2011). An in-house R script administered the meta-analysis with a significance threshold for grouped p -values set at 7.11 × 10⁻¹¹ (LOD = 9.22) that accounts for multiple testing through a Bonferroni correction.
Finally, a literature search identified 75 candidate genes associated with LA from maize, rice
(Oryza sativa L.), and sorghum [Sorghum bicolor (L.) Moench] that were mapped into the
genomic bins (Supplemental Table S1). Candidate genes from rice and sorghum were only included if they had an ortholog in maize. We recorded physical positions for the maize genes as B73 RefGen_v3.
Results Phenotypic Analysis
Reciprocal crosses between inbred lines PHW30 and both B73 and Mo17 were developed. Compared with PHW30, inbreds B73 and Mo17 have less upright LAs, most notably for the second leaf below the ear leaf (Fig. 1, Table 1). The LA for both B73 hybrids was about equal to the midparent value, whereas LA for both Mo17 hybrids was greater than the midparent value (Table 1). We tested the maternal effect for LA in the B73 and Mo17 hybrids and observed a
small difference only between Mo17 hybrids (2.0°, P = 0.026). Since reciprocal differences were not biologically significant for both of the hybrids (Table 1), we combined reciprocal
populations.
After phenotyping the combined F2 populations, F2 plants were selected into three groups
corresponding to their LA: upright, average, and flat. The mean of the flat group from the Mo17 population was larger than the mean of the Mo17 parent, while the flat group from the B73 population was smaller than the mean of the B73 parent (Table 1). Both of the upright group’s means were larger than the mean of the PHW30 parent (Table 1). Phenotypic distributions across populations in the F2 and F2:3 generations were normally distributed (Supplemental Fig. S1),
varied widely (Table 1) and were slightly lower in both of the F2:3 generations (Supplemental
Fig. S1).
Construction of Genetic Map and Quantitative Trait Loci Detection
A modified selective genotyping method was used to select 125 F2 plants from each
population, and DNA was collected from 10 F2:3 plants to reconstruct the F2 genotype.
Genotyping-by-sequencing was used to generate the genotypic data for both populations. Using the filtered progeny genotypic data, two genetic maps were developed and combined into a consensus map. We identified 94,078 SNP sites segregating in the B73 population and 46,724 segregating in the Mo17 population. After filtering, imputation, and binning, 2710 bins developed the B73 population linkage map, and 2129 bins developed the Mo17 population linkage map. Genetic map lengths were 1726.5 cM for the B73 population and 1628.88 cM for the Mo17 population. Combining the two genetic maps resulted in a consensus map of 1808.9 cM.
Inclusive composite interval mapping with the consensus map was conducted separately for each population and generation. In total, 12 QTL were detected for LA (Fig. 2). Six QTL were detected across both generations of the B73 population (Fig. 2A,B), and all six were
nonoverlapping according to the QTL interval’s physical position (Table 2). We detected three QTL in each of the two generations (Fig. 2A,B). Six QTL were detected across both generations of the Mo17 population (Fig. 2C,D), and five were nonoverlapping according to the QTL
interval’s physical positions (Table 2). Five QTL were detected in the F2 generation, and one was
detected in the F2:3 generation (Fig. 2C,D). A single-marker scan with physical mapping of
unprocessed genotypic data provided supporting evidence for these results (Supplemental Fig. S2).
The QTL near ~275 Mb on chromosome 1 was consistently detected in both generations of the Mo17 population and in the F2 generation of the B73 population (Table 2). A peak in this
region was also detected in the F2:3 generation of the B73 population, but its LOD score (2.41)
was below the significance threshold (Fig. 2B). Additionally, the QTL on chromosome 3 that was detected in the F2:3 generation of the B73 population and the F2 generation of the Mo17
population maps to the same genetic position (~92 cM) but physically map ~7 Mb apart (Table 2). The detected QTL were located on chromosomes 1, 2, 3, 4, and 8 (Table 2).
Phenotype, Population, and Quantitative Trait Loci Summary
Different leaves were phenotyped in dissecting LA variation in previous genetic mapping studies (Fig. 3, Table 3). Phenotyped leaves varied from one leaf below the flag leaf to the second leaf below the ear, with most of the studies phenotyping the leaves near the main ear (Fig. 3, Table 3). Eight studies phenotyped multiple leaves but used the mean phenotypic value of all leaves measured as the final trait value (Table 3). Nine studies, including this one,
phenotyped a single leaf, while three studies phenotyped consecutive leaves and mapped them as separate traits (Table 3).
In addition to the phenotyped leaves, the parents and genetic mapping populations used by the different studies were summarized (Supplemental Table S2, S3). The populations were developed from genetic crosses using 133 inbred lines, 71 of which were unique (Supplemental Table S2). Inbred line B73 was used 32 times in a cross (~24% of all inbred lines used), while 50 parents were only used once (Supplemental Table S2). Additionally, the number of genetic mapping populations per study ranged from 1 to 25, and the size of those populations ranged from 94 to 397 (Table 3).
Overall, 495 QTL associated with LA were reported through linkage mapping within individual populations or joint linkage mapping across populations (Supplemental Table S3). Reported QTL per study ranged from 3 to 149 (Table 3), and the phenotypic variance explained by each QTL ranged from 0.41 and 85.05% (Supplemental Table S3). Furthermore, the
estimated additive effect for the reported QTL ranged from −8.51 to 6.67, and the estimated dominance effect ranged from −2.88 to 10.77 (Supplemental Table S3).
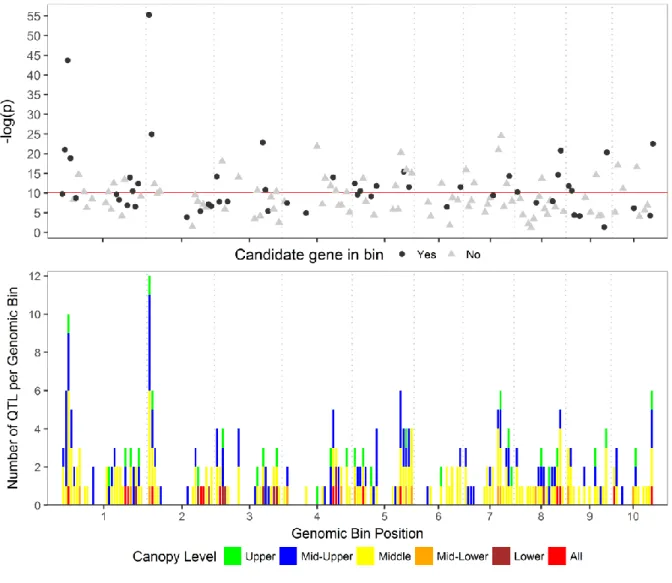
Meta–Quantitative Trait Loci Analysis
After dividing the genome into 210 genomic bins ~10 Mb in size, the 495 reported LA QTL were mapped into 143 genomic bins across all 10 chromosomes. Within a genomic bin, multiple QTL from the same study and canopy level were removed, leaving 325 nonredundant QTL (~66%). After calculating the grouped p-value for each genomic bin using a weighted Z-test, there was evidence of linkage (P −11) of LA to 58 genomic bins distributed across all 10 chromosomes (Fig. 4, Supplemental Table S4). These genomic bins contained 203