UDC: 368.914(437.3); 364(437.3)
Keywords: pension reform – social security – Czech Republic
A Microanalysis of Pension Reform:
To Switch or Not to Switch
in the Czech Republic?
Michal JEŽEK*1. Introduction
Demographic changes throughout the world have led to the phenome-non of population ageing. The proportion of old people in the population is rising steeply – this process is already well under way in OECD count-ries and by 2050 only Africa will still be “young” (World Bank, 1994). While this result of improvements in medical care as well as the stan-dard of living is impressive, it represents a substantial challenge for so-cial security systems. In particular, increasing life expectancy and decli-ning fertility lead to ever increasing dependency ratios1 in developed countries, which renders their public pension schemes financially un-sustainable.
Most public pension plans were set up or expanded on a massive scale in the post-war era of “baby-boom” and significantly lower life expectan-cies. These plans have been largely financed out of payroll taxes on a pay--as-you-go (PAYG) basis, i.e. today’s workers pay the pensions of to-day’s retirees and these workers expect to be supported in the same man-ner in the future. However, owing to the aforementioned demographic developments, current workers face the prospect of being supported by a relatively less numerous work force for a much longer period than it was at the time these plans were introduced.2 These plans are, there-fore, in need of reform because there is a looming possibility that they will encounter insurmountable difficulties in meeting their future liabi-lities.
An increasingly popular alternative to PAYG schemes are fully funded (FF) schemes in which individuals save for their own retirement through pension funds. Unlike PAYG plans which usually contain solidarity-based redistributive elements, these plans are actuarially fair and, ideally, every * Institute of Economic Studies, Charles University, Faculty of Social Sciences ([email protected]) I am grateful to Ondfiej Schneider of the Charles University, Faculty of Social Sciences for his helpful comments and suggestions. I also owe thanks to Ondfiej Kalenda of the Charles Uni-versity, Faculty of Mathematics and Physics and to two anonymous referees. Of course, the res-ponsibility for all errors is solely mine.
1Defined as the number of old-age pensioners in relation to the number of working persons. 2In the words of the French poet Paul Valery, the “future is not what it used to be”.
participant is entitled to no more and no less than his/her accumulated con-tributions plus interest.
While the average rate of return of a FF scheme equals the rate of inte-rest, the average rate of return of a PAYG scheme equals the growth rate of the underlying taxable wage base in the economy, which is equal to the rate of growth of the labor force plus the rate of growth of wages (Sa-muelson, 1958). Data from various countries indicate that if the investment period is sufficiently long, the rate of interest on a combination of bonds and equity generally exceeds the rate of wage growth by approximately 2 to 3 percentage points (World Bank, 1994). Hence, given a stationary or even declining labor force, FF schemes’ performance is superior to that of mature PAYG schemes today.
By and large, both schemes have their pros and cons.3Most importantly, they are subject to different kinds of risk. Funded schemes are exposed to investment risk.4 In contrast, public pension schemes are susceptible to political risk5 and labor income risk. Since those risks are unlikely to be perfectly correlated, their combination leads to a reduction in the ove-rall risk and this is an argument for introducing a pension scheme com-prising both PAYG and FF plans. While the PAYG plan possesses a uni-que potential to redistribute income towards persons in need,6the FF plan limits the government’s upper hand over the economy and rewards res-ponsible behavior.7Countries throughout the world have contemplated at least a partial shift towards funded schemes,8but the cost of such a tran-sition poses a barrier to any major reform. This is due to the fact that the government must continue to honor its obligations to pay pension be-nefits to current and some future pensioners long after part or all of the stream of PAYG contributions ceases, and the accumulated implicit debts of these pension plans are substantial.9Also, such a complex reform requires adequate supervision and regulation of the capital market, pen-sion funds and insurance companies in order to mitigate the risks asso-ciated with investment-based pension plans. If, however, the transition is
3See e.g. the debate in (Holzmann – Stiglitz, 2001).
4Disney et al. (1999) add that “an additional risk arises from annuitization [...] if there is sub-stantial uncertainty as to expected mortality improvement” (p. 22).
5“Not one public defined benefit scheme has held to the same benefit formula over lifetimes of a cohort of members.” (World Bank, 1994, p.112)
6As implied earlier, a high performance of the PAYG scheme could theoretically be su-stained through a continual growth in the population of contributors. In his often quoted Newsweek editorial, Paul Samuelson referred to this as “the greatest Ponzi game ever con-trived” (Samuelson, 1967, p. 88). Once a baby boom is followed by a baby bust, however, tra-ditional defined benefit PAYG schemes find themselves in trouble if their generous promises are to be kept. A well-designed notional defined contribution PAYG plan establishing a perfect link between contributions and benefits (i.e. generally neither intergenerational nor intrage-nerational redistribution) can cope with demographic shocks, but the political risk still re-mains.
7Unlike PAYG plans, FF plans do not hamper international labor mobility. See (Schneider, 1998). 8Most countries reforming their pension systems have opted for a combination of PAYG and FF schemes, albeit the extent of switching varies considerably from main reliance on the PAYG scheme (Hungary and Poland) to equal weight attached to both schemes (Switzerland) to al-most full privatization of social security (Chile and Kazakhstan).
financed at least partially through taxes and is connected with restrictive fiscal measures, national saving increases. Also, the reform may deliver a positive externality of great importance – capital market development. In sum, a well-defined reform may ultimately lead to higher economic growth.10
Pension schemes must be adjusted to the demographic developments sooner or later and the Czech Republic will be no exception. Indeed, it is beginning to feel the mounting demographic pressures which threaten the stability of its public finance and a profound reform of its social secu-rity system is becoming a necessity. Much has been written on this ubi-quitous topic and various reform scenarios have been suggested. Some eco-nomists oppose funded plans and believe that a parametric reform of the PAYG scheme suffices (Rusnok, 2001), some cautiously admit gradual introduction of a minor FF scheme while retaining reliance on the PAYG scheme (Laursen, 2000), some prefer a combination of both schemes (Bez-dûk, 2000) and some advocate a full switch towards a FF scheme (Schne-ider, 1998). I believe that the pros of funded schemes significantly out-weigh their cons and a partial shift towards a funded scheme should be made soon. The objective of this paper is, therefore, to supplement the exis-ting literature containing macroeconomic simulations of a pension scheme reform with the estimates of its elementary microeconomic implications for future retirees.
We shall attempt to demonstrate that if individuals are given the option to switch partially into a funded scheme, an overwhelming majority of them will do so voluntarily, thus not only increasing their own retirement income, but also alleviating the future burden which would hamper the PAYG scheme as currently structured. Most countries which have switched at least partially towards a FF scheme instituted mandatory switching for new labor force entrants and some have done so for current workers under a cer-tain age limit as well. However, due to redistributive streams towards low--income workers in PAYG schemes, such a requirement may affect the stan-dard of living of low-income individuals in retirement. Notably, workers with a low earning capacity are susceptible to periods of non-contribution to pension plans, which could result in a severe reduction in their future pension benefits should they be compelled to switch into an alternative pen-sion plan. Therefore, we shall investigate the impact of mandatory switch-ing on individuals with respect to their earnswitch-ing capacity in order to supply recommendations for policy makers.
The remainder of this paper is structured as follows. Section 2 models the income of the individual over his/her lifetime and presents a general description of the Czech public pension scheme as well as the alternative 9When most PAYG systems were established or expanded amidst the post-war euphoria, the ge-neration which had previously contributed either very little or not at all reaped a windfall in the form of pension benefits. Analogously, if this scheme is ever to be abandoned, the “last” ge-neration(s) must foot the bill. According to the accrued benefit obligation definition, if a PAYG system is discontinued (i.e. no future revenues), the implicit debt of the system is the present value of all benefit obligations accumulated until that moment minus accumulated pension re-serves.
funded scheme. Section 3 details the results of the simulations which sought to estimate the impact of the proposed reform on the incomes of future pen-sioners. Section 4 gives some recommendations and concluding remarks.
2. The Model
We construct a simple model in order to simulate the microeconomic dy-namics of the proposed pension-scheme reform. We model the microecono-mic foundations of the Czech PAYG scheme as well as the proposed FF scheme and focus on individual economic agents’ decisions to join an alter-native pension system.
2.1 The Individual
An individual enters the labor force at the biological age . To simplify our notation, let the term “age” denote the time that has elapsed since the in-dividual’s entry into the labor force, i.e. his/her biological age less . This terminology is adhered to from this point onwards throughout this section, but is dropped in the sections that follow. Thus, the individual’s current age is t, he/she expects to die at age Eand, therefore, retires at age R 0, E.11 While working, the individual receives a gross real wage w(t) and after re-tirement, he/she is entitled to real pension benefits b(t).
Notation:
g . . . national nominal wage growth rate
s(t) . . . individual nominal wage growth rate due to the effect of human-ca-pital accumulation as well as ageing;12s(t) is continuous on 0, R
. . . consumer price inflation rate Hence, dw(t) (1 + g)(1 + s(t)) ––––– =
––––––––––––– – 1.w(t), t(0,R) (1) dt 1 + Using (1 + g)(1 + s(t)) ––––––––––––– – 1 g+ s(t) – 1 +11Sensu stricto, the worker aged Ris just about to retire and does so only at the next moment (see Figure 1).
12This also includes wage growth with seniority due to the fact that the employee pays for on--the-job training by receiving a wage lower than his/her potential marginal product (i.e. with no training) at the beginning of his/her career. According to (Becker, 1993), if the training is employer-specific, its costs are shared by the employer and the employee. Then, there is not only a strong incentive for the employee not to quit (and not to shirk duties for fear of dis-missal) in order to be able to enjoy the fruits of his/her increased productivity later, but also a good incentive for the employer not to dismiss such a specifically-trained employee, thus re-ducing turnover costs. For empirical evidence of wage growth with seniority; see also (Topel, 1990).
for values of g, s(t) and near zero, we arrive at
dw(t)
––––– = (g+ s(t) – ) . w(t), t(0,R) (2)
dt
Solving this simple differential equation, we obtain:
w(t) = w(0) .e(g-)t+0ts(x)dx, D
w= 0, R13 (3)
Let w(t) be concave on t0, R, t0 0, R).14Then, it can be shown easily that s(t) is decreasing on t0, R.15
Analogously, assume that the growth rate of the individual’s pension be-nefits is equal to that of wages in the economy. Then:
b(t) = . w(R) . e(g–)(t–R),16 D
b= (R, E (4)
where denotes the gross replacement ratio, i.e. the ratio of the worker’s first benefits received upon retirement and the last pre-retirement gross wage.
2.2 Dynamics of Wages and Benefits in the Economy
Due to the increase in the productivity of work, the average nominal wage in the economy grows at the rate of g, as do the subsistence wage and mi-nimum pension benefit. Formally,
wage0(time) = wage0(timet) .e(g–)(time–timet) (5)
wageMEAN(time) = wageMEAN(timet) .e(g–)(time–timet) (6)
benefit0(time) = benefit0(timet) .e(g–)(time–timet) (7)
denote the subsistence real wage, average real wage and minimum real pen-sion benefit, respectively. Further notation:
time . . . calendar time
timet . . . calendar time at which the individual is aged t
13w’
+(0) = (g+ s(t) – ) . w(0) and w’–(R) = (g+ s(t) – ) . w(R)
14This is to approximate empirical age-earnings profiles as shown by (Becker, 1993) or (Bos-worth et al., 1996). The latter support the view that earnings rise with age until the mid-for-ties and then decline until retirement. However, Becker argues that this belief may be the re-sult of an inappropriate use of cross-sectional data rather than time-series data (or from the failure to adjust the former by the increases in wages due to economic growth), and de-monstrates that earnings rise until retirement and “there is no systematic tendency for time-series profiles to decline even though cross-section ones do” (p. 233).
15For our particular choice of the functional form of s(t), see theAppendix. 16lim
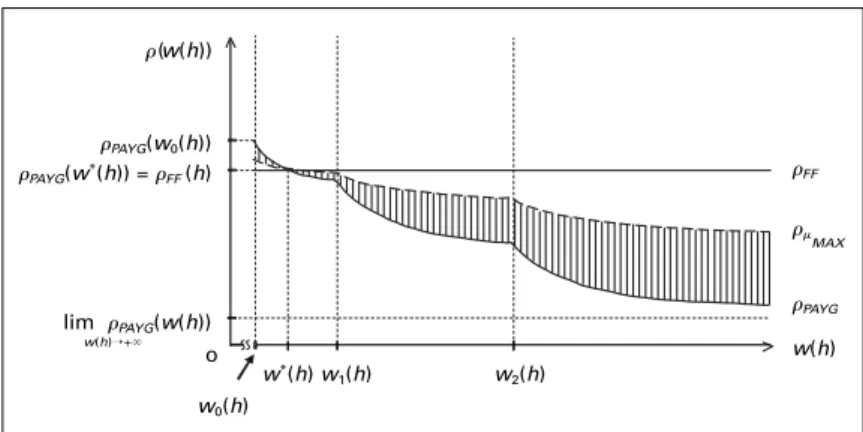
Figure 1 shows the system dynamics and the trajectory of the indivi-dual’s gross income within the system.
2.3 The Czech Pay-As-You-Go Scheme
The individual’s gross wage is taxed throughout his/her working life and this tax is called a mandatory social security contribution, part of which is paid by the employer and part by the employee. Denote the old-age pension contribu-tion rate as and assume that the individual retires at age R P, E, where
Pis the pensionable age defined by law.17Then:
lim bPAYG(t) = PAYG. w(R) = bb(timeR) + 0.015 . R. Bc t→R+
+ 0.06 . (R– P) . Bc18 (8)
where PAYGis the individual’s gross19replacement ratio offered by the PAYG
system and bb(timeR) is the real flat component of PAYG benefits to which
every participant retiring at timeRis entitled regardless of his/her earnings
history.
Bp for Bp(0, p1(timeR)
0.7 . p1(timeR) + 0.3 . Bp for Bp(p1(timeR), p2(timeR)
0.7 . p1(timeR) + 0.2 . p2(timeR) + 0.1 . Bpfor Bp(p2(timeR), + ) (9)
is the calculation base, where
1 R wage
MEAN(timeR)
Bp= –– .
w(t) . ––––––––––––––––––––––– dt (10) R– wageMEAN(timeR– R + t)
FIGURE 1 System Dynamics and the Individual Gross-income Trajectory T
wage0(time) wageMEAN(time) benefit0(time)
w(R)
.w(R) w(0)
o time0 timeR timeE
time benefit0 wage0 wageMEAN
T
17Strictly speaking, the law defines the pensionable biological age + P. We ignore survivors and disability pensions, and focus exclusively on old-age pensions.
18As defined by law for time
P2001.5, + ), where benefit0(timeR) is guaranteed to every
par-ticipant. Assume that bPAYG(t) increases according to (4).
denotes the personal base of assessment of the individual, denotes the pre--retirement period over which wages are included in the calculation of the personal base of assessment,20and parameters 0 < p
1(timeR) < p2(timeR)
are the first and the second real reduction limits at timeR, respectively.
We obtain from (8) that
bb(timeR) 0.075 . R– 0.06 . P
PAYG= –––––––– + ––––––––––––––––– . Bc (11) w(R) w(R)
and it follows from (3), (6) and (10) that
w(R) R
Bp= ––––– .
e tRs(x)dxdt (12)
R–
Assume that an individual aged his able to estimate the development of his/her wages over the remaining working life. He/she expects no adjust-ments within the current PAYG scheme except for an increase in the pen-sionable age and the following development of PAYG parameters over time:
bb(time) = bb(timeh) . e(g–)(time–timeh) (13)
pj(time) = pj(timeh) . e(g–)(time–timeh) j= 1,2 (14)
Then, it follows from (3), (9), (11), (12), (13) and (14) that his/her estimate of the PAYG replacement ratio is given by the following formula:
bb(timeh) 7.5R–6P R –––––––– .eRhs(x)dx+ –––––––– . e t Rs(x)dxdt w(h) .102 R– for w(h) w0(h), w1(h)21 bb(timeh) + (52.5R–42P) . p1(timeh) . 10–3 –––––––––––––––––––––––––––––––––– .ehRs(x)dx + w(h) 22.5R–18P R + ––––––––– . eRt s(x)dxdt (15) .103 R– for w(h) (w1(h), w2(h)
bb(timeh) + (7.5R–6P) . (7p1(timeh) + 2p2(timeh)). 10–3
–––––––––––––––––––––––––––––––––––––––––––––– . w(h) 7.5R–6P R .eRhs(x)dx+ –––––––– . e t Rs(x)dxdt .103 R– for w(h) (w2(h)+) PAYG=
where pj(timeh) . wj(h) = –––––––––––– j= 1,2 (16) R R– e t hs(x)dxdt
It is obvious that PAYG(w(h)) is twice continuously differentiable with dPAYG(w(h)) d2PAYG(w(h))
––––––––––– < 0 and –––––––––––– > 0 (17)
dw(h) d(w(h))2
on each of the open intervals (w0(h), w1(h)), (w1(h), w2(h)) and (w2(h), + ). Therefore, it is decreasing and strictly convex on those intervals. It can be shown easily that
PAYG(wj(h)) = lim PAYG(w(h)) w(h)→wj(h) +
j = 1,2 (18)
Thus, we know that PAYG(w(h)) is continuous, decreasing and strictly
qua-siconvex on (w0(h), +). However,
dPAYG(w(h)) dPAYG(w(h))
lim ––––––––––– < lim ––––––––––– < 0
w(h)→wj(h) + dw(h) w(h)→wj(h) – dw(h)
j= 1,2 (19)
Hence, PAYG(w(h)) is only piecewise smooth on (w0(h), +) with kinks at
wj(h), j= 1, 2, i.e. the points of discontinuity of
dPAYG(w(h))
–––––––––––.
dw(h)
Figure 2shows the replacement ratio the individual is offered by the PAYG scheme depending upon his/her last pre-retirement wage, i.e. h= R. This is regardless of gender since the PAYG formula does not discern between genders and as the wage level is varied, all other things are held equal, in-cluding wage growth rates.
2.4 A Fully Funded Scheme
The individual saves for retirement in a pension fund throughout his/her working life. Unable to foretell the exact moment of his/her death, a risk--averse individual can be expected to seek insurance against longevity.22
20 = min time
R– 1986, 30, timeR 1996, + ) as defined by law.
21As noted earlier, a minimum benefit is guaranteed by law to every participant in the PAYG scheme. Thus, let the minimum wage the individual has to receive at hin order for the formula to apply be denoted by w0(h).
22The personal expected length of life differs among individuals based upon their health sta-tus, lifestyle, family-health history, etc. and the information about the remaining length of life rises as he/she ages. Naturally, the uncertainty of the time of death still remains.
Therefore, upon reaching retirement age, the individual converts his/her accumulation into an annuity, which is an insurance product paying speci-fied amounts to its policyholder for as long as he/she is alive.
The contribution rate in the FF scheme equals that of the PAYG scheme (denoted by ) and contributions are mandatory for every participant. Let
idenote the nominal yield rate of personal pension accounts – we assume the value of ito be near zero just like g, s(t) and . From this point onwards, let Edenote the life expectancy of the individual’s birth cohort conditional on reaching age R. Suppose the individual has the choice to opt out of the PAYG scheme, divert the contributions into the FF scheme and annui-tize his/her personal account accumulation upon retirement. The individual purchases an escalating annuity with escalation rate g, i.e. FF benefits rise at the same rate as PAYG benefits.23The present value of annuity payouts of a person who dies at age Eis lower than the price of the annuity due to the cost of administration, marketing and also the phenomenon of adverse selection in the annuities market.24Let a certain share of the total accu-mulation covering this cost be denoted by c.
Thus, the benefit bFF(t) increases according to (4) and the real value of
the individual’s accumulation at the time of retirement less the annuitiza-tion cost equals the present value of FF benefits, i.e.
(1 – c) .
Rh. w(t) . e
(i–).(R–t)dt =
ERbFF(t) . e
(–i).(t–R)dt (20) Then, it can be obtained from (3), (4) and (20) that
FIGURE 2 PAYG Replacement Ratio Based on w(R)
23Alternatively, the individual may buy a nominal annuity, which pays a constant nominal pay-out each period, or a real “inflation-indexed” annuity whose nominal paypay-out is adjusted each period by the percentage change in the price level, etc. Since, however, none of the conclusions reached in this text would be affected by the choice of insurance product, an escalating annu-ity is used for convenience.
24The problem of adverse selection in the private annuities market means the empirical evi-dence that the annuitants’ life expectancy is higher than in the population at large and insu-rance companies adjust the prices of annuities upwards accordingly. For more, see (Finkelstein – Poterba, 2002). PAYG(w(R)) PAYG(w0(R)) lim PAYG(w(R)) w(R)→+ o w0(R) w1(R) w2(R) w(R) PAYG
R he(g–i).(t–R) + t Rs(x)dxdt FF= (1 – c) . . –––––––––––––––––– (21) E Re(g–i).(t–R)dt
is the FF replacement ratio. Note that FF(w(h)) = const.owing to no
redi-stribution within the system. This is congruent with our intuition that if the individual’s lifetime wage (and contributions) ceteris paribusdoubled, his/her savings in the personal pension account would double as well, which would eventually translate into doubling of his/her pension benefits.
2.5 Individual Choice of Pension Arrangement
The individual has the choice to switch an arbitrary portion of PAYG con-tributions to a pension fund at the expense of receiving proportionately re-duced PAYG benefits in the future without any compensation for the past contributions, i.e. a proportionate part of the accumulated rights under the PAYG scheme is completely eliminated. Denote the combination of sche-mes in the individual pension arrangement as 0, 1, i.e.
– – . is the rate of contributions to the FF scheme,
– – (1 – ) is the rate of contributions to the PAYG scheme.
Using (15) and (21), we define the individual’s resulting replacement ratio as
= . FF+ (1 – ) . PAYG (22)
The individual’s wage is exogenous and his/her optimization problem is replacement ratio maximization. Therefore, on the condition that the risks associated with both schemes are identical,25the individual switches if and only if
> PAYG (23)
Alternatively, inserting (22) into (23) and rearranging yields
FF> PAYG (24)
Suppose there is an upper limit on the extent of switching denoted as
MAX0, 1. Then (22) and (24) imply
d
–– = FF – PAYG > 0 (25)
d
and is maximized at = MAXon 0, MAX. Therefore, given the opportu-nity to divert an arbitrary percentage of PAYG contributions into a FF scheme in exchange for the same percentage reduction in traditional pub-lic pension benefits, if the individual switches, he/she does so to the maxi-mum possible extent.26
25This is a great simplification indeed – the risks associated with both pension plans have al-ready been discussed.
This conclusion is obvious in Figure 3. FFis the same for all workers aged h regardless of their wages whereas PAYGdeclines with income due to
re-distribution within the PAYG scheme. After a switch into a mixed scheme, the resulting replacement ratio of those whose PAYGexceeds FF falls and
the greater the extent of switching, the greater the drop. For those whose
PAYGis lower than FF, the situation is reversed and the greater the extent
of switching, the greater the resulting replacement ratio. Given an upper limit on the extent of switching,
MAXdenotes the replacement ratio attain-able by switching to the maximum possible extent and w*(h) denotes the switching wage in the cohort of workers aged h.If the rate of return i ceteris paribusincreases, the graph of FFshifts
pa-rallelly upwards, thus decreasing the switching wage. If women’s retire-ment period E– Ris longer than that of men due to women’s higher life ex-pectancy, then the change of sex from male to female ceteris paribusshifts the graph of FFparallelly downwards, thus increasing the switching wage.
If age his ceteris paribusincreased, then the graph of FFshifts parallelly
downwards. However, albeit the range of attainable values of PAYG
re-mains unaffected, the graph of PAYGgenerally changes too as hvaries. In
this case, the resulting change in the switching wage is not clear without the specification of wage growth rates.27
3. Simulations 3.1 Assumptions
We consider 2005 to be the year of a pension-scheme reform.28In our cal-culations, we use this values of parameters – see Table 1:29
FIGURE 3 Mixed-scheme Replacement Ratio for a Given h and MAX(0, 1)
26It is worth repeating that the difference in the nature of risk in both schemes is ignored. 27In this general descriptive model, concrete wage growth rates are not specified. This is only done in Section 3 where computer simulations are conducted (for instance, see the dependence of the switching wage on age in Table 8and Table 9).
lim PAYG(w(h)) w(h)→+ o PAYG(w0(h)) PAYG(w*(h)) = FF (h) (w(h)) FF MAX PAYG w(h) w0(h) w*(h) w 1(h) w2(h)
Thus, the national growth of real wages is 3 % p.a. in the whole projected period (which spans about 60 years in the case of new entrants), the old--age pension contributions to the PAYG scheme are 20 % of gross wages30 and the cost of annuitization is 10 % of the accumulation.31
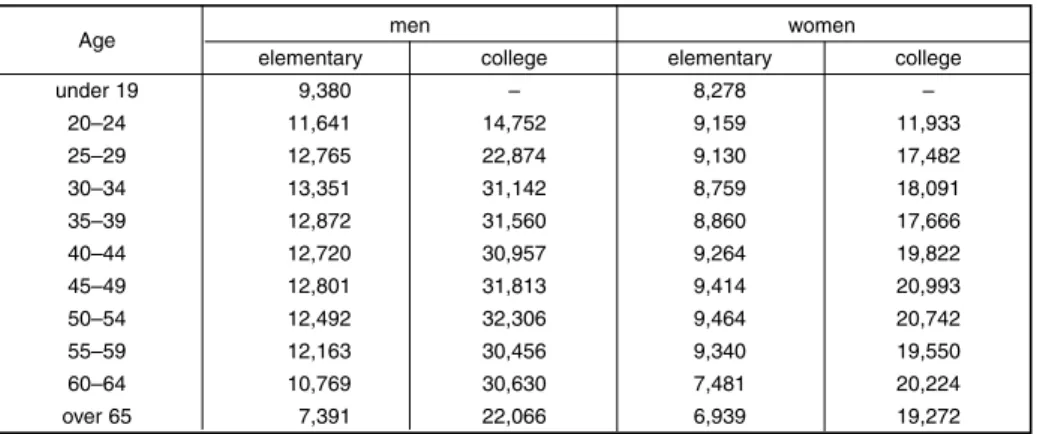
The individual enters the labor force at 23 if male and at 27 if female, and retires at the pensionable age of 65.32The life expectancy conditional on reaching age 65 is 78.72 for men and 82.09 for women using the 2000 mortality rates (âSÚ, 2002). These can be expected to increase. However, the extent of this increase is fairly difficult to estimate with any degree of precision as it means estimating the average age of dying in several deca-des from now. Therefore, alternative scenarios are considered. It is not easy to estimate s(t) either.33This function serves as an approximation of the rate of the individual’s wage growth over time cleared of the general wage growth in the economy and we set s(t) so that this rate decreases over the indivi-dual’s career – see Table 2.
TABLE 1 Values of Parameters Used in the Simulations
TABLE 2 Differences between Individual and National Wage Growth Rates
28This is due to the fact that the preparation of such a complex reform requires some time. As a consequence, 2005 is a base year for the calculation of all real values. Moreover, all those who choose to switch are likely to retire after the Czech Republic’s entry into the Economic and Mo-netary Union, i.e. they will receive pension benefits in euros rather than Czech crowns. How-ever, the results of our simulations are unaffected by the choice of currency units.
29Strictly speaking, a gradual increase in the period from 2005 to 2016 is considered. 30The total contribution rate is currently 26 % (19.5 % is paid by the employer) and the scheme already runs deficits. We assume this rate to be increased to 30 % by 2005 in an attempt for a fiscally sustainable PAYG scheme. Since, however, almost 30 % of total PAYG expenditures cover non-old-age (disability and survivors) pensions, we assume that 10 percentage points of the total contribution rate go towards non-old-age pensions (with the ‘surplus’ being reallocat-ed towards old-age pensions) and only 20 percentage points are earmarkreallocat-ed for old-age pensi-ons. Bezdûk (2000) demonstrates that if there is to be full wage indexation of pension benefits, the current PAYG scheme may be fiscally sustainable with a contribution rate of 30 %, the sta-tutory retirement age of 65 irrespective of gender, a reduction in early retirements by 50 %, a reduction in disability and survivors pensions by 10 % and the gross replacement ratio for the economy (i.e. the ratio of the average pension benefit and the average gross national wage) reduced from the current 44 % to 38 %. As the initial reduction in this replacement ratio is not assumed in the simulations, the expected performance of the PAYG system is still overesti-mated.
31Mitchell and McCarthy (2002) compare the present values of expected annuity payouts with the prices of annuities in a range of developed countries, using the population mortality tables. They conclude that “a typical member of the population could anticipate receiving at least 90 per-cent of his premium from the single life annuity. The results also imply that adverse selection as well as loadings and administrative charges must be below ten percent of the purchase price.” (p. 14)
g c bb(2005) p1(2005) p2(2005)
0.05 0.02 0.2 0.1 30 1,500 8,500 20,000
Age 23 27 30 35 40 45 47.5 50 55 60 65 s(t) in % 4.5 3.3 2.6 1.6 0.9 0.3 0 –0.2 –0.7 –1.0 –1.3
For the sake of simplicity, we apply these rates uniformly to all workers in our simulations regardless of gender and level of earnings.
It is worth reiterating that we assume no reform to the current PAYG scheme and a complete elimination of a proportionate part of the acquired rights under this scheme for those who switch. One of the main objectives of this paper is to compare the replacement ratios attainable in the FF scheme with those attained in the PAYG scheme as currently structured, thus illustrating the relatively poor performance of the latter scheme. I be-lieve that after reform, the PAYG scheme should remain a redistributive defined benefit scheme, although the current weak link between contri-butions and benefits should be strengthened while a minimum pension in-come would continue to be ensured. In such a case, the switching outco-mes would differ from those presented in the following text and generally more lower-income workers would tend to switch. However, introducing some arbitrarily redefined PAYG formulae would probably add to confu-sion rather than make a stronger case for reform and, therefore, current formulae are used as described in Section 2. Thus, we can proceed further and investigate the microeconomic pros and cons of the alternative pen-sion schemes.34
3.2 What Are the Alternatives?
One possible way of measuring the performance of pension schemes is comparing the amount of contributions an individual makes during his/her working life with the amount of benefits the very same individual can ex-pect to receive after he/she has retired. Assume a five-year increase in cur-rent life expectancies, a real discount rate of 5 % p.a.,35and a 20% rate of contribution towards old-age pensions as used throughout our simula-tions.
By definition, the present value of contributions to the FF scheme equals the present value of benefits received after retirement. However, unlike pub-lic PAYG schemes, this scheme by itself may not provide insurance against longevity if, for instance, lump-sum withdrawals are an option. Therefore,
32Of course, some persons enter the work force at an earlier age, some later. The reasons for not setting the age of new entrants at 20 (implying 45 years to be spent in the labor force) are manifold – higher level education, maternity (or paternity) leave, unemployment, travel before starting a job, etc. As a compromise, there are 42 years of work ahead of new male en-trants (R= P= 42) and 38 years of work ahead of new female entrants (R= P= 38). Since, however, non-contribution periods such as unemployment, higher level education or child rearing are added to the contribution years in the PAYG scheme, we use 45 years of partici-pation in the PAYG benefit formulae. Strictly speaking, the above values implying the pension-able age of 65 are used only for workers aged 50 or less in 2005. Currently, the pensionpension-able age is being raised gradually from 60 for men and 53–57 for women (depending on the num-ber of children reared) in 1995 to 62 and 57–61 in 2007. We assume a further phased increa-se until it reaches 65 for both men and women in 2020, and we uincrea-se the statutory retirement age for a woman with 2 children in the simulations.
33For a discussion of this and our concrete choice of s(t), see theAppendix. 34The mathematical software package Maple was used for the simulations.
if the performance of these schemes is to be compared, the cost of this in-surance in the FF scheme has to be considered. As noted earlier, the pre-sent value of expected annuity payouts in the population at large may be up to ten percent lower than the price of the annuity. Therefore, the ave-rage FF scheme participant can expect to receive at least 90 % of his/her contributions with accrued interest back in the form of annuity payouts. This, however, is not the case of the PAYG scheme and if we compare the pre-sent values of individuals’ benefits in the alternative pension plans, we find that they differ substantially. These differences can be seen in Table 3and
Table 4.36,37
Thus, it is clear after comparing these present values that while partici-pants in the FF scheme can expect to receive approximately 10 % less than they will have contributed, the expectations of most PAYG-scheme partici-pants cannot be so high. A man entering the work force with the national average wage (CZK 20,000 in 2005) can expect to receive 2.3 times less in pension benefits than he will have contributed during his working life and a woman with that wage can expect 1.6 times less. If a man earns a wage two and a half times higher than the national average wage (CZK 50,000 in 2005), he can expect to receive 4.4 times less than his past contributions and a woman earning that wage can expect to receive 3.2 times less. Note that while the latter workers contribute over seven times more than sub-sistence-wage earners, they receive less than twice higher benefits. This is due to justified redistribution towards individuals who are not able to
con-TABLE 3 Present Values of Contributions and Benefits in 2005 (CZK) – Men
TABLE 4 Present Values of Contributions and Benefits in 2005 (CZK) – Women
36PVCdenotes the present value of contributions, PVB
FF= 0.9PVC denotes the present value
of FF benefits, and PVBPAYGdenotes the present value of PAYG benefits. While PVBFFmay well
be higher than 0.9PVC, PVBPAYGis likely to be slightly lower than presented due to our overly
optimistic assumptions about the financial sustainability of the PAYG scheme. 37wage
0= CZK 7,000 and wageMEAN= CZK 20,000 are assumed to be the monthly subsistence
wage and national average wage in 2005, respectively. In 2000, approximately 65 % of workers earned less than the national average wage (âSÚ, 2001b).
Monthly wage upon entry into labor force in 2005:
CZK 7,000 CZK 10,000 CZK 20,000 CZK 50,000 PVC 667,000 953,000 1,907,000 4,767,000 PVBFF 601,000 858,000 1,716,000 4,290,000
PVBPAYG 626,000 701,000 839,000 1,088,000
Monthly wage upon entry into labor force in 2005:
CZK 7,000 CZK 10,000 CZK 20,000 CZK 50,000 PVC 554,000 791,000 1,582,000 3,956,000 PVBFF 498,000 712,000 1,424,000 3,561,000
tribute sufficiently for their own retirement. Surprising as it may seem, how-ever, a man earning the subsistence wage (CZK 7,000 in 2005) upon entry into the labor force can expect to receive almost 10 % less than his past con-tributions and a woman with that wage can expect to receive (only) about 30 % more. The calculations reveal that only women earning 60 % of the na-tional average wage (i.e. about CZK 12,000 in 2005) or less when entering the work force are net recipients in the PAYG scheme and in the popula-tion of men, this scheme is actuarially fair only to subsistence-wage ear-ners. Given the mounting demographic pressures, it is unthinkable that this situation should improve.38
This indicates that the PAYG scheme is challenged by the FF scheme even at the microeconomic level and it seems that a partial transition to the FF system would make most labor force entrants and young workers better off. However, it might be argued that the actual yield rate of personal accounts may be lower than the assumed 5 % p.a. in real terms or that a contribu-tion period of 42 years if male and 38 years if female is not feasible for some workers. These objections have to be taken into account and an analysis including comparisons of various scenarios is needed.
3.3 Alternative Scenarios 3.3.1 Scenario 1
The yield rate of personal accounts is 6 % p.a. in real terms. The life ex-pectancy conditional on reaching age 65 is 82 and 85 years for men and wo-men, respectively, i.e. only a three-year increase in the current values is as-sumed. With such expectations, workers estimate their retirement income in alternative schemes. Utilizing replacement ratios, Table 5shows the al-ternatives of individuals based on age, gender and earnings level.39,40
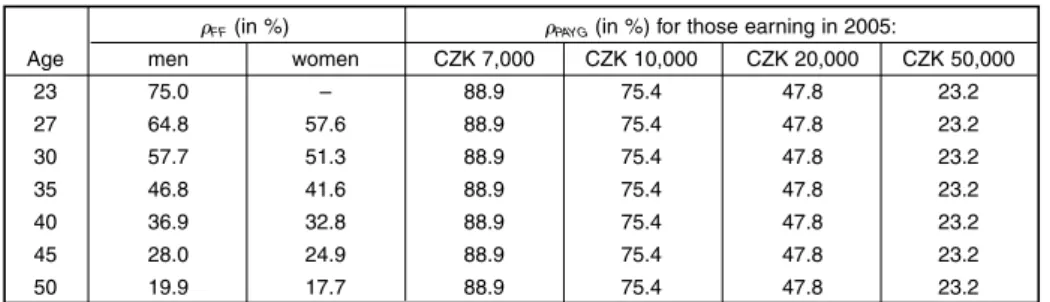
Under these assumptions, the PAYG scheme as currently structured
TABLE 5 Comparison of Alternative Replacement Ratios
FF(in %) PAYG(in %) for those earning in 2005:
Age men women CZK 7,000 CZK 10,000 CZK 20,000 CZK 50,000 23 114.7 – 79.6 62.3 37.3 19.4 27 100.6 89.0 89.2 69.1 42.4 21.4 30 89.7 79.5 93.7 73.5 45.6 22.7 35 72.1 63.8 88.9 79.2 49.8 24.4 40 55.6 49.2 88.9 82.8 52.5 25.5 45 40.7 36.1 88.9 84.6 53.4 26.0 50 27.8 24.6 88.9 84.6 53.4 26.0
38Unless redistribution towards certain groups of workers is strengthened even further. 39
FFdenotes the replacement ratio in the FF scheme in the event of a full switch at a given
age. PAYGdenotes the replacement ratio based on the income level at a given age offered by
seems to be actuarially fair only to female subsistence-wage earners. Thus, should switching be mandatory, no labor force entrant would experience a drop in his/her expected retirement income and all men up to the age of 29 would benefit from switching regardless of their earnings.41 By entering a 50–50 mixed scheme42instead of entering the PAYG scheme solely, new male labor force entrants earning the subsistence wage would achieve a 22% increase in their pension benefits relative to the benefits they can expect now. The pension benefits of middle- and upper-income groups would rise dramatically. By entering a 50–50 mixed scheme, a male labor force entrant earning the average wage would achieve twice higher pension be-nefits and a woman in the same situation would increase her bebe-nefits by 55 %. By switching into this scheme, a 30-year-old man earning the ave-rage wage would achieve a 48% increase in pension income and a woman of the same age and wage would increase her pension income by 37 %. If the performance of pension funds were as strong as it is in this scenario with a modest increase in life expectancies only, the transition towards an alternative scheme would be smooth and it seems that an overwhel-ming majority of young persons would enjoy increased financial security later in old age.
3.3.2 Scenario 2
The yield rate of personal accounts is 4 % p.a. in real terms. The life ex-pectancy conditional on reaching age 65 is 86 and 89 years for men and wo-men, respectively, i.e. an approximately seven-year increase in current life expectancies is assumed.43In comparison with the previous scenario, the re-placement ratios attainable in the FF scheme fall and because the repla-cement ratios in the PAYG scheme do not change, the lowest income levels for individual age cohorts necessary to achieve higher pension benefits in a mixed scheme rise. Replacement ratios for this scenario are summarized in Table 6.
40If, for the sake of consistency, we stuck to our universal values of s(t) even in the case of work-ers aged more than 33 earning the subsistence wage, we would allow their wages to fall slightly below the subsistence level later in their working lives. To avoid this, we let the wages of these workers follow the development of the subsistence wage until retirement. Consequently, the ac-tual FF replacement ratios of these workers are lower than presented in the table by approxi-mately 5 percentage points. Thus, the highest gross replacement ratio “attainable” in the PAYG scheme by workers whose wages grow at the same rate as the national average wage is ap-proximately 90 %, i.e. the net replacement ratio (the ratio of the first benefit received after re-tirement and the last pre-rere-tirement net wage) can exceed 100 %. Clearly, as shown in the table, workers with wages growing faster early in their career and more slowly later, thus approach-ing the subsistence wage, can “attain” even higher replacement ratios, but that information is of little relevance when measuring the performance of a pension scheme.
41These results were obtained by comparing replacement ratios
FFand PAYGfor individual age
cohorts. Table 5summarizes replacement ratios for selected cohorts and PAYG ratios are shown only for selected wage levels.
42A scheme in which 50 percent of the total old-age pension contributions flow to the PAYG plan and 50 percent flow to the FF plan. According to (22), the replacement ratio in this scheme is the arithmetic mean of PAYGand FFfor a given age and income level.
43While such longevity might be good for individuals, it would be less so for the ailing PAYG scheme.
Under these assumptions, female average-wage earners entering the la-bor force would still be rather indifferent between the two alternative sche-mes, but male average-wage earners aged up to 28 would be better off switch-ing. For instance, a male labor force entrant earning the average wage would increase his pension benefits by 18 % if he entered a 50-50 mixed scheme. Most importantly, however, the FF scheme is not attractive for the lowest--earning persons and should entry into a mixed scheme be compulsory for some age cohorts of workers, the socially weakest would be hurt. By ente-ring a 50–50 mixed scheme, a male worker earning the subsistence wage upon entry into labor force would experience a relative drop in pension in-come of 18 % and this drop would be 27 % for a woman in the same situa-tion. A 30-year-old man earning the subsistence wage switching into this scheme would see his pension income fall by 27 % and this drop would be 30 % for a woman of the same age with the same wage. Moreover, longer periods of non-contribution could significantly exacerbate the situation of these persons. Thus, if pension funds underperformed, the lowest earning individuals would be the first to feel the consequences and this is an argu-ment for not forcing these individuals to switch and retaining a limited PAYG scheme in which redistribution based on solidarity secures a decent retirement income for the poorest.
3.3.3 Scenario 3 – A Conservative Forecast
In order to evaluate the impact of the proposed reform on the retirement income of current or future workers and estimate the responses of current workers to the opportunity to switch into an alternative scheme, it is im-portant to use conservative assumptions about the yield of personal accounts and life expectancies of future retirees.
The US President’s Commission to Strengthen Social Security (2001) as-sumes that individuals in the United States opting for personal accounts hold a portfolio which consists of 50 percent equities, 30 percent corporate bonds, and 20 percent government bonds. They utilize the rates of return on those assets as recommended by the Office of the Actuary of the Social Security Administration: “Equities are assumed to provide an ultimate ex-pected real rate of return of 6.5 percent. Corporate and Treasury bonds are assumed to provide a real rate of return of 3.5 percent and 3.0 percent
re-TABLE 6 Comparison of Alternative Replacement Ratios
FF(in %) PAYG(in %) for those earning in 2005:
Age men women CZK 7,000 CZK 10,000 CZK 20,000 CZK 50,000 23 51.0 – 79.6 62.3 37.3 19.4 27 46.5 41.3 89.2 69.1 42.4 21.4 30 42.9 38.1 93.7 73.5 45.6 22.7 35 36.4 32.3 88.9 79.2 49.8 24.4 40 29.7 26.4 88.9 82.8 52.5 25.5 45 23.0 20.5 88.9 84.6 53.4 26.0 50 16.6 14.8 88.9 84.6 53.4 26.0
spectively. Administrative costs are assumed to be [...] 0.3 percent of the account balance. [...] The overall expected real return for this [...] port-folio, net of expenses, is therefore a conservative 4.6 percent. This portfolio return is much lower than that used in many academic studies of personal accounts.” (p. 97) They add that actual administrative costs could be lower than assumed. Similarly, Acun~a and Iglesias (2001, p. 25) state that “[...] in Chile’s case, 5 % (real) return is a lower limit for forecasting the yield of the pension funds in the long term”. The rates of return of pension funds as well as the administrative costs differ in various countries and are in-fluenced by the stringency of the government regulation of pension funds and the overall institutional arrangement of the FF scheme. However, with an expected real rate of return of government bonds of 3 % p.a., pension funds in the Czech Republic should be able to attain a real rate of return exceeding 5 % annually through portfolio diversification without a sub-stantial risk increase. Therefore, we assume that the rate of return of per-sonal pension accounts, after deduction of administrative costs, is 5 % p.a. in real terms.44
The increase in life expectancies is difficult to predict. We assume a five--year increase in current values, i.e. the life expectancy conditional on reach-ing age 65 is 84 and 87 years for men and women, respectively. It is pos-sible that the actual increase turns out to be greater, but that would bring additional strains on the PAYG scheme and full wage indexation of bene-fits would be even less likely in the long run.45Therefore, I believe that by using these values we do not overestimate the expected benefits in the FF scheme relative to those in the PAYG scheme.
Under these assumptions, the resulting replacement ratios are as shown in Table 7.
There seem to be few, if any, male labor force entrants who would prefer the old scheme to a new mixed one, and by entering a 50-50 mixed scheme, a large number of young male workers with a relatively low earning
capa-TABLE 7 Comparison of Alternative Replacement Ratios
FF(in %) PAYG(in %) for those earning in 2005:
Age men women CZK 7,000 CZK 10,000 CZK 20,000 CZK 50,000 23 76.4 – 79.6 62.3 37.3 19.4 27 68.3 60.7 89.2 69.1 42.4 21.4 30 62.0 55.1 93.7 73.5 45.6 22.7 35 51.3 45.5 88.9 79.2 49.8 24.4 40 40.7 36.2 88.9 82.8 52.5 25.5 45 30.7 27.3 88.9 84.6 53.4 26.0 50 21.6 19.2 88.9 84.6 53.4 26.0
44Results obtained with alternative returns are presented in theAppendix.
45A sharp unexpected rise in life expectancies would, ceteris paribus, undoubtedly put paid to the government’s efforts to maintain pension benefits wage-indexed and, therefore, further aus-terity measures in the form of parameter adjustments would be needed (for instance the pen-sionable age could be increased to 67).
city could achieve a non-negligible increase in the standard of their living in old age. For instance, in the case of new male labor force entrants ear-ning a wage equal to one half of the national average wage (CZK 10,000 in 2005), the increase would be 11 %. For middle-income groups, switching into a 50–50 mixed scheme could result in a substantial increase in future pension benefits. For illustration, it would be 52 % and 22 % for male and female labor force entrants earning the average wage, respectively. How-ever, if the current high level of redistribution were to be maintained in the PAYG scheme, the lowest-earning young women would be better off re-maining in this scheme rather than switching into a mixed one. For in-stance, female workers earning the subsistence wage upon entry into the work force would experience a 16% drop in pension income after ente-ring a 50–50 mixed scheme. Nevertheless, it is obvious that a large num-ber of female labor force entrants would benefit from entering a mixed scheme.46 Estimates of the lowest wage levels at which switching would make individuals better off are presented in Table 8and Table 9.47
TABLE 8 Switching Wages (CZK per month) – Men
TABLE 9 Switching Wages (CZK per month) – Women
Age w* Age w* Age w* Age w* 23 7,500 32 15,200 41 29,200 50 65,600 24 8,100 33 16,500 42 31,400 51 80,800 25 8,700 34 18,000 43 33,900 52 98,600 26 9,500 35 19,400 44 36,700 53 125,100 27 10,200 36 20,700 45 39,900 54 183,800 28 11,000 37 22,100 46 43,500 55 291,200 29 11,900 38 23,700 47 47,700 56 673,900 30 12,900 39 25,300 48 52,600 57+ n/a 31 14,000 40 27,200 49 58,500
Age w* Age w* Age w* Age w* 27 12,200 35 22,300 43 39,500 51 117,800 28 13,300 36 23,800 44 42,900 52 160,700 29 14,400 37 25,500 45 46,700 53 303,800 30 15,600 38 27,300 46 51,200 54 1.883,200 31 17,000 39 29,300 47 56,400 55+ n/a 32 18,300 40 31,400 48 62,500 33 19,600 41 33,800 49 69,900 34 20,900 42 36,500 50 79,100
46Because the average gross wage of women is lower than that of men (the difference was 26.7 % in 2000 – (âSÚ, 2001a)), PAYG benefits of women are, on average, lower than those of men despite the fact that the PAYG formulae do not discern between genders. How-ever, due to the fact that the life expectancy in the population of women is higher than in the population of men (and also because women’s contribution periods are generally shorter due to child rearing, which the PAYG scheme treats like a contribution period), the introduc-tion of a FF scheme would widen the gap between the average pension benefits of men and women.
Since workers earning the lowest wages tend to be unskilled and likely to start working earlier than we assume, a 42-year contribution period for such men and 38-year contribution period for such women may not be in-feasible even if we allow for short non-contribution spells. However, very long periods of unemployment that some of these workers may experience could curtail the period over which they are able to contribute and caution should be exercised in the interpretation of the results presented.48
Let us finally consider hypothetical mandatory switching into a 50-50 mixed scheme for all persons up to the age of 30 years and estimate its impact on the lowest-earning workers – for simplicity those earning the subsistence wage. In addition, suppose that there is no experience-re-lated wage increase at the beginning of the career of these workers and they earn the subsistence wage until retirement.49 Then the retirement income of male labor force entrants would fall by 8 % and female entrants would experience a drop of 18 %. For 30-year-old workers, mandatory switch-ing would mean a slightly more pronounced forced decrease in expected pension benefits – it would be 18 % in the case of men and 21 % in the case of women. Again, although these differences may not seem very large con-sidering the fact that the real value of those “decreased” benefits would, in the distant future, be much higher than that of benefits received by pensioners today, the relative fall in the standard of living of these per-sons after retirement could be deepened by substantial non-contribution periods.
4. Policy Implications and Conclusion
It is worth bearing in mind that the results presented apply to workers with a particular wage development over their careers. We assumed a smooth uninterrupted stream of contributions from the time of switching until re-tirement and allowed for no “jumps” in the individual age-earnings profi-les caused by changes of jobs or “gaps” in these profiprofi-les due to unemploy-ment, child rearing or health problems. In fact, wage trajectories are subject to risk just like capital returns, demographic development or political ma-nagement of public pension schemes. It is also important to realize that the rate of return on capital is a crucial factor determining retirement in-come in the FF scheme50and expectations about returns may vary across 47“n/a” means not applicable at this age level because
FF< inf PAYG(w(h)) = lim PAYG(w(h)) w(h)w0(h), +) w(h)→+
To see this, the reader may find Figure 3illustrative.
48Consider an individual aged hwho, for various reasons, is unable to contribute to his/her per-sonal account for nyears between the time of switching and retirement. Then, the switch-ing wage in the cohort of workers aged h+ ncan serve as a rough approximation of the indivi-dual’s actual switching wage.
49Formally: s(t) 0, t 0, R. The data in Table 10in theAppendixindicate that this results in a better approximation of the wage development of e.g. unskilled female workers. For detai-led estimates of replacement ratios under this assumption, see Table 13in theAppendix. 50See Table 11and Table 12in theAppendix.
individuals, thus affecting their switching decision. Therefore, we explored three scenarios in which we covered a reasonable range of likely returns as well as life expectancies. The simulations suggested that an overwhelming majority of new labor force entrants would increase their standard of living in old age by entering an alternative pension plan, and they can be expec-ted to do so once they are given the opportunity. Furthermore, a large num-ber of current workers would be better off switching without any compen-sation for their past contributions to the public pension scheme, thus decreasing its implicit debt.
We considered scenarios in which workers were given the opportunity to divert a percentage of PAYG contributions into the FF scheme in exchange for the same percentage reduction in PAYG benefits. In addition, incenti-ves in the form of “tax relief” for these workers or allowing reverse switch-ing within a certain “guarantee” period might be considered – this is open to further discussion. I believe that after reform, the PAYG scheme should remain a defined benefit scheme, although a reduction in the current rela-tively high level of redistribution may be considered so that subsistence be-nefits continue to be guaranteed, but otherwise bebe-nefits are more earnings--related, thus in all likelihood reducing labor market distortions. Never-theless, to avoid any arbitrary adjustments to the current benefit formu-lae, these formulae were conserved and the simulations illustrated that des-pite its strong redistribution towards low-income workers, the relative per-formance of the PAYG plan is so poor that a large number of young persons with low earnings would be better off in a funded scheme.
A critical question for reformers is the extent of switching. The World Bank (1994, p. 23) states: “The right mix of [schemes] is not the same at all times and places. It depends on a country’s objectives, history, and current circumstances, particularly its emphasis on redistribution versus saving, its financial markets, and its taxing and regulatory capability. The kind of reform needed and the pace [...] will also vary [...].” Both schemes are sub-ject to different kinds of risk – the FF scheme is associated with investment risks whereas participants in the PAYG scheme are exposed to political risks. Disney et al. (1999, p. 22) point out that “it should not be assumed that [political] risk is a priori lower than the investment risk associated with funded plans”. Browning (1975) shows that it is rational for a politi-cian in a democracy to overpromise pensions since the cost is to be borne by future generations when the respected politician is already out of office. The two schemes should be viewed as two portfolios with very imperfectly correlated returns. In order to diversify the risks, a combination of both schemes seems optimal for individuals although people with different de-grees of risk aversion may favor different combinations. Because the tran-sition to a mixed scheme is, however, associated with substantial costs, the extent to which individuals are allowed to opt out of the PAYG scheme is likely to depend on the political climate.51For this reason, the results of
51The greater the switch, the higher the transition costs. For instance, Hungary has so far allowed workers to divert 1/5 of mandatory contributions to a FF scheme and Po-lish workers may switch over 1/3 of old-age pension contributions to private pension funds.
the simulations were presented in a form enabling a simple computation of replacement ratios for any mix of schemes. These results suggest that even a relatively low extent of switching could mean substantially higher pen-sion benefits for a large number of future retirees.
The ultimate impact of the reform fundamentally depends on how the transition to a mixed scheme is financed. For instance, national savings will not be increased if the transition is financed 100 percent by debt with no other changes. An increase in savings requires a cut in consumption – either public or private. If the government raises taxes or cuts other ex-penditures in order to finance the transition out of current general tax re-venues, the possibility of increased national savings and enhanced econo-mic growth emerges. Therefore, the reform should be at least partially tax-financed. The financing strategy critically determines the generational distribution of the costs and benefits of reform. In the case of a debt-finan-ced transition, some cohorts might win as pensioners but heavily lose as taxpayers in order to serve the implicit-turned-explicit debt in the future. In the case of a tax-financed transition, if taxes are raised, the current ge-neration bears the brunt of reform because it has to pay taxes to cover the transitional public pension deficits while also saving for their own re-tirement. Similarly, a reduction in other government expenditures hurts groups that would otherwise benefit from the programs that are restricted (the current generation if current spending is reduced, future generations if government investment is reduced). In order to spread the costs of tran-sition over current and future cohorts in a possibly fair and socially accept-able manner, a mixed financing strategy would probably have to be adop-ted, i.e. a combination of tax and debt.52The benefits would then be realized at a corresponding speed. The choice of the right financing strategy is, how-ever, a complex issue which goes beyond the scope of this paper. The pos-sible welfare consequences for different generations (including the question whether a Pareto-improving transition could be achieved) are outlined in (Kotlikoff, 1995). The World Bank (1994, p. 272) states: “The biggest win-ners are likely to be the generations following the transition, who will reap the economic gains of increased efficiency and growth.”
Another question is whether participation in the new mixed system should be voluntary or mandatory, and in the latter case, for whom it should be so. It has been shown that the lowest-earning workers would be the first to be hurt if pension funds underperformed and given the fact that low-earning individuals are the most likely to have their career histories interrupted by longer non-contribution periods, I believe that workers should be given the opportunity to remain in the PAYG scheme and this should be so even for new labor force entrants.53However, all workers up to a certain age li-mit should freely choose which alternative they prefer. This lili-mit could well be 50 years of age as our estimates show that high-earning individuals would still be better off switching even in their late 40s.54One of the dis-tinct advantages of a voluntary switching approach is the fact that workers voluntarily renounce part of their accumulated rights under the old scheme 52Some countries also used privatization revenues to significantly reduce the implicit debt, but the Czech Republic missed this opportunity in the 1990’s.
and its implicit debt is reduced. If an individual decides to switch, he/she
voluntarilyruns the risk of not being able to save sufficiently for retirement and cannot claim any additional benefits from the government if it so occurs.55The government would only provide guarantees in case of bank-ruptcy of pension funds or insurance companies.56Even though no single worker would be compelled to enter an alternative pension scheme, a well--designed awareness-raising campaign run by the government should en-sure that within a generation or two, only a small number of the lowest--earning individuals would participate in the PAYG scheme fully, the rest of the work force having freely opted for a mixed scheme.
So far, we have assumed that workers annuitize all their accumulation. There are, however, more possibilities. Retirees might, for instance, opt for scheduled withdrawals of their savings over the whole retirement period or, in the most extreme case, they might withdraw all their accumulation as a lump sum upon retirement. Obviously, this would not only eliminate annuitization costs, but also maintain the longevity risk. Experience sug-gests that most workers seek to insure themselves against this risk – for instance in Chile, workers may choose between scheduled withdrawals and life annuities, but the percentage of workers opting for the latter is increa-sing constantly.57It is generally recognized that one of the main purposes of mandatory pension plans is the protection of individuals against ending
53It can be argued that new entrants should be forced to a mixed scheme because experience shows that young people tend to switch massively and such a mandatory entry would incur a minimum welfare loss (the population affected would be minimal) while enhancing admi-nistrative simplicity. Also, the real value of PAYG benefits “promised” to current labor force entrants significantly exceeds the real value of benefits received by pensioners today, and the current high level of redistribution which aims to protect some persons from a very low standard of living in old age may not be needed in the future. In such a case, the PAYG re-placement ratios of individuals with a low earning capacity would fall and the FF scheme would be relatively more attractive for these persons. Even in that case, however, the relative drop in the pension incomes of the lowest-earning workers due to long non-contribution periods might be substantial in comparison with the pension incomes which these persons would re-ceive in the still (albeit less) redistributing PAYG scheme. In the UK, low-income workers were one of the arguments for not requiring mandatory switching and retaining an unfunded scheme (the so-called SERPS) at the time of the introduction of a funded scheme (Disney et al., 1999). Also, in September 2000, 28 % of Chilean workers were self-employed. According to (Acun~a – Ig-lesias, 2001), over 95 % of them did not contribute to the mandatory FF system at that time, “many of [them] hav[ing] low wages” (p. 21). Due to government guarantees of minimum pen-sion benefits, this poses a future fiscal burden which is by no means negligible. Rusnok (2001) uses implicit government guarantees as a major argument against the introduction of a fun-ded scheme.
54In the case of Poland, switching was mandatory for all workers under the age of 30 and vo-luntary for those between 30 and 50. In Hungary, switching was compulsory for new labor force entrants and an implicit age limit for voluntary switching was 35–40 years as entry into the new scheme was unlikely to be attractive for older workers (Laursen, 2000).
55In the case of a large extent of switching, it would be socially and politically unacceptable not to declare guarantees of the subsistence benefits. However, the problem of moral hazard would have to be addressed in the process of setting the eligibility criteria.
56For instance in Chile, apart from the guarantee of the minimum pension benefits for those who meet certain basic eligibility criteria, the government guarantees 100 % of the life annu-ity payments up to the amount of the minimum pension benefit and 75 % of the amount above that level.