96
Research Analytics: Facilitating the Use of Metrics to
Improve the Research Profile of Academic Programs
Rodolfo H. Torres
, Associate Vice Chancellor, Research and Graduate Studies,
University of Kansas
he need for metrics that quantify the scholarly productivity of PhD programs at universities has been a topic extensively debated for quite some time. In fact, in 2001 the Merrill retreat focused on Evaluating Research Productivity. The keynote speaker at that time, Dr. Joan Lorden, stated(1): “In choosing measures for the future,
we need to bear in mind our goals. Why are we engaged in a measurement process? Are we asking how to move up in the ranks? Or, do we want to know how we have served the state or advanced our mission?”
The future is now, but these ques-tions continue to be valid as we are only starting to understand new technological tools to attempt to measure research productivity. The increase in external re-quirements of accountability faced by ac-ademic institutions and the need to con-vey to diverse non-expert audiences the contributions that the research enterprise provides to society, make it important that we find simple ways to put in evi-dence what we do. We now have easy ac-cess to large sets of data and numerous analysis tools that can be put to good in-ternal use too, as universities embark in strategic planning and the improvement of the research profile of their programs. We will briefly describe how we are start-ing to use such data and tools at the Uni-versity of Kansas (KU) from the perspec-tive of the Office of Research and Gradu-ate Studies (RGS) and the Office of Insti-tutional Research and Planning (OIRP). In particular, we will present how we have been exploring Academic Analytics (AA), and our plans for its use based on
our analysis and feedback received. This project has been a joint effort with Steven Warren, Vice Chancellor, RGS, and Deb Teeter and Sandra Hannon, Director and Associate Director, OIRP. Previous anal-ysis of Academic Analytics and research programs at KU involved also Joshua Rosenbloom, former Associate Vice Chancellor, RGS.
What has changed in research productivity evaluation since the 2001 conference?
One of the main focuses of the 2001 Merrill conference was on the 1995 Na-tional Research Council (NRC) study, Re-search-Doctorate Programs in the United States: Continuity and Change. This study was the major systematic data collection regarding graduate programs, broader than its 1982 predecessor. The 1995 NRC study collected important quantitative information about PhD programs, but the rankings were based on surveys. To some extent one can consider that these rank-ings were based on the reputation of the
T
97
programs among peers. One of the criti-cisms of the rankings was how much the research reputation of the programs af-fected the reviewers’ opinion of their ed-ucational quality. Other weaknesses of the 1995 NRC study, as presented in the executive summary of the analysis con-ducted by The Committee to Examine the Methodology to Assess Research-Doctor-ate Programs(2), were related to thetaxon-omy used to classify programs, the obso-lescence of the data, and the poor dissem-ination of the results and the difficulty to access the data. Nevertheless, the rank-ings of the 1995 NRC study were widely used in many contexts including statisti-cal reports of professional organization. For example, until 2012 the American Mathematical Society used the 1995 NRC rankings to divide all US PhD programs in mathematics into groups on which it compiled annual statistics regarding fac-ulty salary, PhD production, and other quantitative parameters(3). In some
disci-plines, substantial correlation was also observed between the NRC rankings and rankings done by other publications such
US News. This correlation is perhaps not surprising since both sets of rankings have been substantially derived from surveys sent to experts in the different fields.
The NRC attempted to address some of the criticisms of the 1995 review in its next study, which was not published un-til 2010. The 2010 NRC study drastically changed the methodology used. The rankings were based on two different sta-tistically derived analysis of quantitative measures combined in a weighted fash-ion. Rather than absolute ranks, an inter-val of confidence was provided for each program. The immediate issues this time, as it was promptly debated in the media, still included the obsolescence and com-pleteness of the data and the convoluted (at least in appearance) methodology em-ployed. We are not aware of any system-atic study done to compare the changes in rankings of departments with respect to the 1995 study, but it would be inter-esting to see if other rankings based mostly on reputation still correlate well or not with the new NRC ones. The future
98
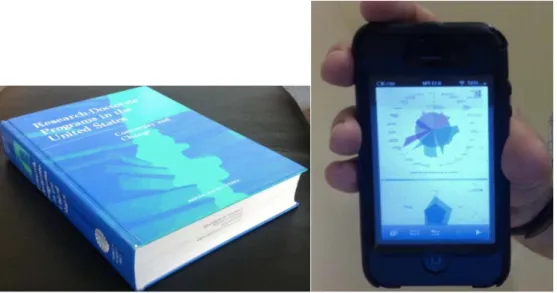
of similar NRC studies in years to come is uncertain and many universities rely now for a quantitative analysis of re-search productivity on commercial tools such as Academic Analytics and self-col-lected information. Though the needs for such analysis continue to be similar to those in the past, the access to the data and numerous web-based tools is now lit-erally at our fingertips. While the 1995 NRC study almost preceded the World Wide Web and was only available in hard copy, today we can use AA and other re-sources even in our smart phones.Moreover, some data and tools are publically available and subject to scru-tiny by the general public. It is important then that we conduct a serious analysis within our academic institutions to pro-vide a solid understanding of what we can measure and what we cannot, to both take advantage of the information for strategic planning and bench marking, but also to properly communicate to dif-ferent stakeholders true measures of re-search productivity and how they evince the achievements of our institutions of higher education.
Tools, barriers, and objectives for research productivity analytics
The data sources and tools available today for quantitative analysis are so-phisticated and diverse. At KU, like at most research universities, we systemati-cally track institutional data that relates to our programs scholarly productivity in different forms. We gather data related to research funding such as current and pending awards, but we also try to fore-cast future funding based on past perfor-mances and other parameters. Through our Academic Information Management
System (AIMS), we have detailed data about PhD production, time to degree, student support, and student placement for our programs, which can also be com-bined with demographic information. We are also implementing a new system for self-reported data by faculty. The Pro-fessional Record Online (PRO) is a web-based product of Digital Measures, which will not only gather information about faculty but will also produce and update vitas, web pages, and a variety of customized reports. In addition to AA, there are several commercial or publi-cally available tools that provide citations reports, citations maps, h-indexes, and journals impact factors. They include Web of Knowledge, Scopus and Google Scholars, among others. We have also re-cently subscribed to Pivot, which is an-other web-based tool that provides infor-mation about funding opportunities.
Despite the relatively easy access to tools and information, there are com-monly encountered barriers that restrict a wider use of research analytics. In partic-ular, there is not enough “buy-in” about the data/analysis from faculty in certain disciplines, which is compounded by the lack of training and expertise in quantita-tive analysis in some areas. The analysis of the data is sometimes complex and subject to misinterpretations. Equally im-portant is the fact that the type of data analysis needed could be sometimes ex-tremely time-consuming.
To mitigate some of these barriers we are currently developing a “consulting service” model. We will have specialists trained in data analysis and with famili-arity with our available tools and data-bases to assist programs and academic
99
units with specific reports and requests. Our goal is to help academic programs to analyze the data by• Looking beyond rankings and in-dexes, understanding how different metrics affect them;
• Identifying additional discipline spe-cific important metrics and combin-ing them with the PRO system, AIMS reports, and other sources;
• Attempting to compensate with local information some of the lag and in-completeness that the global data may have;
• Identifying relative strengths (weak-nesses) of different programs and de-vising ways to further enhance (re-duce) them;
• Customizing our data analysis based on specific goals, strategic initiatives, or requests;
• Exploring funding opportunities that have not been substantially tapped; • Presenting the data in a
comprehen-sive way that can be easily read, al-lowing for analysis at increasing lev-els of depth.
A few simple examples
We will briefly illustrate a few fea-tures of Academic Analytics that we have
been analyzing in combination with other tools. AA collects information on more than 30 different metrics of research productivity divided into 6 categories: Awards, Publications (articles in jour-nals), Conference Proceedings, Books, Ci-tations, and Grants. The data, as numer-ous talks at the 2013 Merrill retreat pre-sented, can be displayed in a variety of formats, tables and graphs. The access to raw data also allows for customized local usages. Using 15 of the metrics, which are typically “per faculty” counts meant to account for different program sizes, a Fac-ulty Scholarly Productivity Index (FSPI) is computed by AA using z-scores for each metric and weights similar to those used by the last NRC study. While the FSPI provides a snapshot number that could be used for a quick comparison with peers, looking in more detail at the data on which the index is based is often a lot more revealing.
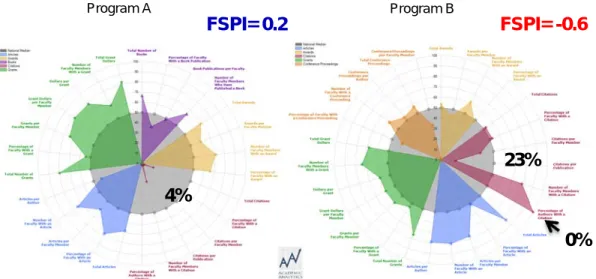
An important issue is the under-standing of the effect of the variable weights in different disciplines. We illus-trate this with the following example in-volving two programs in Figure 2 below. The figure shows the typical summary of variables radar plot of AA where the dark
100
area represents the median of the disci-pline at the national level and the light area shows the percentage rank of the program.After a first look at the summary plot, Program B (on the left of Figure 2) may appear to over preform Program A. Program B ranks at or above the 50% mark in all variables, while Program A appears to be very weak in terms of cita-tions. However a look at the all variables radar plot in Figure 3, where we have
in-cluded the weights of selected variables, reveals why actually Program A has a better profile as indicated by the FSPI.
Some important facts about the vari-ables and their weights to keep in mind are:
• AA metrics best resonate with the STEM disciplines
o Grants and Citations are heavily
weighted in STEM fields
• The Humanities have some major criticisms including:
o Citations to/from books are not
counted
o No differentiation between
Edi-tor/Chapter-author in books is yet available
o Only federal funding is counted
• The Social Sciences fall somewhere in between
o There is more diversity from
“book based” disciplines to “arti-cle based” ones.
Weights correlate well among re-lated disciplines as can be seen in the fol-lowing samples from the Natural
Sci-ences in Figure 4, the Social SciSci-ences in Figure 5, and the Humanities in Figure 6. In the programs in the Natural Sciences displayed, the variables Awards (Aws), Citations (Cit), Publications (Pub), Grants (Grts), are all substantially weighted. Aws weight varies from 12% to 18%, Cit varies from 23% to 28%, Pub from 22% to 31%, Grts 30% to 33%. On the other hand in all these programs Conference Pro-ceedings (Cnfp) are only weighted from 1% or 2% and Books (Bks) are weighted 0%.
FSPI= 0.2
FSPI= -0.6
Program A Program B4%
23%
0%
Figure 3. All variables radar plots of two programs in which the relative weights of some variables were added.
101
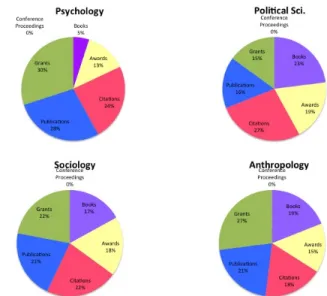
In the Social Sciences programs dis-played, Bks starts to have a more promi-nent role ranging from 5% to 23% and taking some of the weight from Grts and Pub, but Cnfp remains insubstantial at 0% weight. Cit continues to be close to the 20% range. It is interesting to observe that in Psychology, a discipline with more quantitative aspects but included in the Social Sciences division of KU College of Liberal Arts and Sci-ences, the weights are distributed more like the Natural Sciences than in the Social Sciences. In par-ticular Grts is again weighted in the 30% range but Bks with 5% weight takes part of the weight in Pub.Moving into the Humanities, History and Art History exhibit very similar weight distribution, with Bks carrying about half of the total weight. Aws becomes more predominant too, but Pub and Cit are not significant, weighting only from 0% to 4%. Bks remains the variable with the bigger weight in
the Languages but Pub regains more weight, 7%-8%, taking away some weight from Grts and Aws.
As we saw in the earlier comparison between Programs A and B, the visual ef-fect of the radar plots could be mislead-ing if one does not keep in mind the met-rics weights. To help in this regard, we Figure 4. Sample of AA weights in the
Natural Sciences
Figure 5.Sample of AA weights in the Social Sciences.
Figure 6.Sample of AA weights in the Humanities.
have developed a new radar plot where the area for each variable is plotted pro-portionally to the variable. An example of this, analyzing the productivity profile of a program in combination with AA plots, is given in Figure 7. This display gives a
more complete visualization of the rele-vance of each metric.
Understanding how the different metrics affect the program profile and how they may relate to each other is of crucial importance. In the above example we see how this program ranks very high in Conference Proceedings (about 80%) but that metric is only weighted by 3% in the discipline at the national level. It may be possible that the faculty members in this program are not publishing in the
ap-propriate venues (conference proceed-ings as opposed to journal articles). This may help explain in part the relative low citations rates observed. This could trans-late in a lack of visibility that may also negatively affect the Awards metric. This
observation can be presented to the pro-gram for further consideration and possi-ble remedy actions.
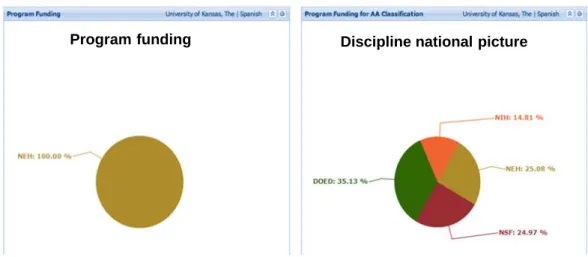
A common need of programs in the current economic environment is the search for new funding sources. The
pro-gram market share tool of AA can be used
to aid in this regard. The analysis is lim-ited to funding from Federal Agencies, which can present a quite incomplete pic-ture in some disciplines, but it is still of value and shows potential opportunities not tapped by a program. In Figure 8 we
Figure 7. Summary and all variables radar plots of AA combined with custom made plot of variable weights
103
see a program that is receiving all of its funding from the National Endowment for the Humanities (NEH). This is a well-funded program at KU, yet a comparison with the discipline national picture re-veals how the program may be missing on about 75% of the available opportuni-ties. Such opportunities include support in the discipline from the National Insti-tute of Health (NIH), Department of Ed-ucation (DOED) and the National Science Foundation (NSF). When potential un-tapped resources have been identified, the already mentioned web-based tool Pivot could be then used to seek specific funding opportunities suitable for the program. Such information could be-come very valuable for a program trying to increase their external funding.Other important measures that should be incorporated into a program evaluation and strategic planning are re-lated to data on students’ performance and success. The tables in Figure 9 give a snapshot of part of the academic profile of a program. At KU we have such infor-mation, which is generated from our AIMS system, reported on the Office of
Graduate Studies website for all PhD pro-grams. It would be of interest to explore any correlation of these student perfor-mance and demographic metrics with the research productivity metrics in AA.
The few examples presented illus-trate how a more detailed analysis of the metrics used in AA, beyond the compu-tation of the FSPI, and the use of addi-tional data resources and tools can help units make decisions to improve their re-search profile. When some weakness is identified we can use some of the addi-tional data and tools mentioned earlier to look deeper into the sources of such weakness in a multiple level analysis fashion.
Some final comments
As imperfect as the current metrics and data may be, they still provide tre-mendous amount of information that we did not have before. The key is to focus on what we can tell from such metrics and data and what we cannot. The tools we have now are only the beginning of better technology in research analytics yet to come. Further databases will be created and aggregated by tools like AA. More accurate and complete sets of data
Program funding Discipline national picture
104
will become available, which hopefully will help us assess disciplines for which some of the current metrics are not signif-icant. For example, it is not hard to imag-ine that a database tracking performances at major artistic venues could become available in the future, providing a valu-able component missing from current metrics in disciplines in the performing arts. Another interesting development is the potential use of Altmetrics(4), whichcan provide a measure of the impact of scholarly work on social media, blogs
and new forms of communications. All these tools add new dimensions to the evaluation of research productivity and should be further explored. While quality is not always quantifiable, there are met-rics that are indicators of good quality programs. More importantly they could be used to demonstrate to the non-ex-perts why a program is of good quality.
We would like to conclude by citing again some of the words of the main speaker at the 2001 Merrill retreat(1):
105
“We will not always agree on what to measure and not everything that we value will be easily captured in quantitative meas-urements. But as members of the academy, we are in the best position to develop valid measures that will promote our values and apply them in ways that sustain and enhance our mission.”The task continues to be difficult but we
now have much better tools at our
dis-posal. A careful use of technology and the
availability of data could prove to be a big
aid in the important engagement of our
ac-ademic institutions in the planning and
as-sessing of our research mission.
References
1. Keynote Address by Joan Lorden, in
Evaluating Research Productivity, no. 105 - June 2001. A Merrill Center publication on the Research Mission of Public Universities.
http://www2.ku.edu/~masc/publica-tions/2001whitepaper/intro.html
2. Assessing Research-Doctorate Pro-grams. A Methodology Study. Edited by Jeremiah P. Ostriker and Char-lotte V. Kuh. National Research Council (US) Committee to Examine the Methodology for the Assessment of Research-Doctorate Programs. Washington (DC): National Acade-mies Press (US); 2003. ISBN-10: 0-309-09058-X.
http://www.ncbi.nlm.nih.gov/books/ NBK43475/
3. Annual Survey of the Mathematical Sci-ences. Old Annual Survey Groupings of Doctoral Departments (1996 to 2011).
American Mathematical Society.
http://www.ams.org/profes-sion/data/annual-survey/groups_des
4. Almetrics: A Manifesto, Jason Priem, Dario Taraborelli, Paul Groth, Cam-eron Neylon.