ABSTRACT
Nutrient management on grazed grasslands is of criti-cal importance to maintain productivity levels, as grass is the cheapest feed for ruminants and underpins these meat and milk production systems. Many attempts have been made to model the relationships between controllable (crop and soil fertility management) and noncontrollable influencing factors (weather, soil drain-age) and nutrient/productivity levels. However, to the best of our knowledge not much research has been per-formed on modeling the interconnections between the influencing factors on one hand and nutrient uptake/ herbage production on the other hand, by using data-driven modeling techniques. Our paper proposes to use predictive clustering trees (PCT) learned for building models on data from dairy farms in the Republic of Ire-land. The PCT models show good accuracy in estimat-ing herbage production and nutrient uptake. They are also interpretable and are found to embody knowledge that is in accordance with existing theoretical under-standing of the task at hand. Moreover, if we combine more PCT into an ensemble of PCT (random forest of PCT), we can achieve improved accuracy of the estimates. In practical terms, the number of grazings, which is related proportionally with soil drainage class, is one of the most important factors that moderates the herbage production potential and nutrient uptake. Fur-thermore, we found the nutrient (N, P, and K) uptake and herbage nutrient concentration to be conservative in fields that had medium yield potential (11 t of dry matter per hectare on average), whereas nutrient uptake was more variable and potentially limiting in fields that had higher and lower herbage production. Our models also show that phosphorus is the most limiting nutrient
for herbage production across the fields on these Irish dairy farms, followed by nitrogen and potassium. Key words: nutrient uptake, herbage production, predictive clustering trees, random forest
INTRODUCTION
Grasslands make a significant contribution to food security through providing part of the feed require-ments of ruminants used for meat and milk produc-tion. There is a renewed interest in grazing systems in many temperate and subtropical regions of the world. In Ireland, more than 90% of the agricultural area con-sists of pasture, grass silage or hay, and rough grazing (O’Mara, 2008). The utilization of grass by grazing should provide a sustainable basis for livestock produc-tion systems, as grazed grass is the cheapest source of nutrients for ruminants (O’Donovan et al., 2011). With feed cost accounting for more than 75% of the total variable costs on these livestock farms (Connolly et al., 2010), the production of sufficient grass for the grazing herd has a significant effect on farm profitabil-ity (Shalloo et al., 2004; Finneran et al., 2010). From 2013 to 2015, average levels of grass DM production on intensive dairy farms measuring grass in Ireland ranged from 8.0 to 18.5 t/ha (O’Leary et al., 2016). Grass production between and within farms can vary widely depending on several soil-, climate-, and management-related factors.
Potential herbage production on a farm system is the result of management practices in a given environment. Management practices are controllable factors and include crop management, soil fertility management, and sward composition. Environmental conditions are noncontrollable factors and include soil type/drainage and weather.
Most agricultural soils are treated periodically with fertilizers or organic manures and lime to correct min-eral element deficiencies or toxicities and subsequently promote growth of grass. The nutrient management strategy practiced on grassland farms in Ireland is
Using machine learning to estimate herbage production
and nutrient uptake on Irish dairy farms
Stevanche Nikoloski,1,2* Philip Murphy,2 Dragi Kocev,1,3 Sašo Džeroski,1,3 and David P. Wall2
1Jožef Stefan International Postgraduate School, Jamova cesta 39, Ljubljana 1000, Slovenia
2Teagasc, Environment, Soils and Land-Use Department, Johnstown Castle, Co. Wexford, Y35 Ireland 3Department of Knowledge Technologies, Jožef Stefan Institute, Jamova cesta 39, Ljubljana 1000, Slovenia
J. Dairy Sci. 102
https://doi.org/10.3168/jds.2019-16575
© 2019, The Authors. Published by FASS Inc. and Elsevier Inc. on behalf of the American Dairy Science Association®. This is an open access article under the CC BY-NC-ND license (http://creativecommons.org/licenses/by-nc-nd/4.0/).
Received March 5, 2019. Accepted July 1, 2019.
usually based on soil nutrient leaves and the stocking rate of the farm (Wall and Plunkett, 2016). Managing soil fertility levels closely, especially soil pH, can ensure that potential herbage production is not being limited by nutrient availability in the soil. Nitrogen is often a main limiting nutrient in temperate soils. Intensively managed grazed grasslands generally receive multiple applications of fertilizer N during the growing season to increase the forage available to grazing animals. Losses of N and P from such intensively managed systems have also come under scrutiny due to their effect on water quality, air quality, acidification, and anthropo-genic climate change (Dillon and Delaby, 2009). As a result of such concerns, restrictions on fertilizer use for grasslands were implemented in many parts of Europe under the European Union Nitrate Directive (Nitrate Directive, 1991). This combination of economic and environmental factors makes improved efficiency of fertilizer N use central to any strategy for sustainable grassland production systems.
Fertilizer input in grazed grasslands is usually linked to the grazing schedule, with fertilizer N in particular applied after each grazing. Recovery of N, P, and K in grass herbage can be highly variable depending on the date and rate of application (Vellinga et al., 2010). In Ireland, swards are typically grazed at intervals of between 21 and 28 d during most of the grazing sea-son and there may be a carry-over effect of nutrient applications and deposition by the grazing animals to the following growth interval. Herbage production and nutrient recovery are also affected by site factors such as soil type. Soil N mineralization rates can vary con-siderably, both seasonally and between soils (Herlihy, 1979; Nunan et al., 2000), and contribute a significant proportion of N to grass growth on farms (Humphreys et al., 2008).
However, emphasis is currently being put on achiev-ing a high number of grazachiev-ings per field, as this is closely correlated with herbage production (Hanrahan et al., 2017). The rate of reseeding currently practiced in Ireland is low (Creighton et al., 2011). Sward composi-tion is an important contributor to potential yield also. A perennial ryegrass (Lolium perenne L.) dominated sward is likely to produce higher yield than mixed grass species swards (Smith and Allcock, 1985; Ergon et al., 2016). A sward that incorporates white clover ( Trifo-lium repens L.) can be managed to offset N fertilizer inputs due to its N fixing capacity.
Soil type and soil drainage class refers to the physi-cal, chemiphysi-cal, and biological soil characteristics. The sum of these properties is a very important factor that contributes to the potential herbage production, but is commonly overlooked. Weather, specifically rainfall, is
a major limiting factor in the implementation of any agronomic strategy.
Modeling herbage production, as well as nutrient uptake, is difficult because of the number of environ-mental and management factors that affect the final result. The farm system is made up of multiple moving parts. It can be very difficult to implement a practice change and expect to achieve an isolated and easily measurable difference. The model can consider multiple factors acting together (i.e., multiple moving parts). Potential yield depends on factors associated with the site in question. It is better to consider all the factors together, or as many of them as possible, although this could be impractical because of economic and time constraints.
This complexity of the farm system is the reason why research often uses component type studies. Schils et al. (2007) developed a whole-farm dairy simulation model, called DairyWise, which simulates some environmental, technical, and economic processes on a dairy farm. The DairyWise model is evaluated using 2 data sets consist-ing of 29 dairy farms. As output, this model provides a farm plan describing all nutrient flows, as well as the consequences to the environment and economy. The outputs of DairyWise model components are further used as inputs in other environmental, economic, or technical sub-models.
Plot-, field-, or farmlet-scale studies provide the in-sight needed to address a problem, but they does not give the real picture of possible trade-offs and syner-gies between the controlling factors at hand. For that reason, in this study, we rely on a data-driven approach to modeling. We use predictive clustering trees (PCT; Blockeel et al., 1998), which are a generalization of de-cision trees, adapted for structured output prediction tasks. So far, PCT have been applied in many differ-ent environmdiffer-ental domains, for instance, for predicting the abundance of different species occupying the same habitat (Demšar et al., 2006), estimating different veg-etation quality indices for the same site (Kocev et al., 2009), or predicting the composition of a community of organisms (Levatić et al., 2015a).
Predictive clustering trees can consider multiple factors acting together (i.e., multiple moving parts) and can also deal with multiple targets (responses), where the task at hand is called multi-target regres-sion (MTR). The MTR task is to predict/estimate the values of multiple targets simultaneously and PCT solve this task by building one predictive model for all of the targets. Recent research shows that PCT are su-perior to most of the state-of-the-art machine learning algorithms for MTR (Kocev et al., 2009). Furthermore, trying to improve the predictive performance of a single
PCT, Kocev et al. (2013) proposed to combine a set of single (base) predictive models into an ensemble of tree models. For basic regression tasks, it is widely accepted that ensemble model learners improve over the predic-tive performance of single-tree learners (Kocev et al., 2013).
In this study, we use PCT for MTR, as well as en-sembles (random forests) of PCT to estimate herbage production potential and N, P, and K uptake by us-ing soil, environmental, and management attributes. Individual PCT are interpretable and can be used for the visualization of input variable interactions and the dependency of the target thereof. The lack of inter-pretability is the main drawback of ensemble learners because overall predictions of ensemble are the aver-age of the predictions from each tree in the ensemble. We use the PCT to obtain insight into the domain of study and ensemble of PCT to obtain estimates of herbage production and nutrient uptake. The latter can be used, for example, to create accurate maps for the response(s) of interest.
This study aims to address the question of why herb-age production potential can differ greatly between regions and even farms. We have a data set for 15 dairy farms in Ireland, where a range of soil (S), environmen-tal and weather (E), and management (M) variables has been measured (see Appendix Table A1).
The goal of this study was to address the following research questions related to herbage production and nutrient uptake on grazed grassland-based dairy farms in temperate regions:
• What are the main drivers of herbage production on grassland-based dairy farming systems?
• How do nutrient supply and nutrient (N, P, and K) uptake affect herbage production?
• How do S, E, and M variables interact within a grazed grassland farming system to affect herbage production and herbage nutrient uptake?
The remainder of this paper is organized into the fol-lowing sections. The Materials and Methods section describes the data we used in our experiments, as well as the way in which it was collected. In this section, we also present the machine learning methodology we used for building the models and specify the design of the machine learning experiments. The Results and Discus-sion section presents and discusses the obtained models (trees and ensembles) in terms of their predictive per-formance and interpretability. Finally, we present the conclusions of this work and outline its implications and potential outcomes for advisory services and grass-land management on dairy farms.
MATERIALS AND METHODS
Data Description and Collection
A scoping process was carried out with several advi-sors across 3 counties (Wexford, Cork, and Tipperary), which led to the selection of 15 commercial Irish dairy farms.
All of these farms are specialized dairy farms and were selected based on farmer willingness to adopt new practices and have good record-keeping skills. The final selection included production intensity and soil drain-age differences so that a range in each category would be captured. It must be noted that this approach to selection may bias the results toward more progressive farmers who farm in the south and south-east of Ire-land.
In terms of milk delivered and concentrate per cow, this cohort was slightly above the national average of 861 kg per cow in 2015 (Hennessy and Moran, 2015). However, this selected group of farms is representative of main intensive dairy regions of Ireland. It was ex-pected that many dairy farms would expand or inten-sify post milk quota abolition in March 2015. In 2015, 11 out of the 15 farms had a derogation to farm more intensively (i.e., stocking rates between 170 and up to a maximum of 250 kg of organic N/ha) and in 2016 all 15 farms were in this more intensive stocking rate category.
General Farm System and Soil Data Collection
Management (controllable factors) and environmen-tal (noncontrollable factors) data were collected for 804 fields on the 15 farms for 2 yr (2015 and 2016). A de-tailed description for each factor is given in Apppendix Table A1. Information on how the data were collected is given below.
General biophysical, farm system, and management activity data were collected by visiting each farm 3 times per year. During these visits, information such as the number of fields and paddocks, area of individual fields, area used for grazing the dairy herd, duration of periods that the livestock are grazing versus indoors, slurry production system and quantity, and grazing infrastructure and grassland management (i.e., areas used for grazing vs. silage) were recorded and further verified by repeating pertinent questions during subse-quent visits. A survey of the soils (general soil classifi-cation using the Irish Soil Information System (Simo et al., 2008) and ground-truthing using soil auguring, field orography (aspect, topography), and sward composi-tion on each farm was conducted during 2015.
Nutrient and Management Activity Data Collection
The farms in the study recorded nutrient use and grassland management at the field or paddock scale using an online software package PastureBase Ireland (Hanrahan et al., 2017; Teagasc, 2019). Some farmers choose to keep written records of fertilizer and manure applications and other field management information, such as reseeding and grazing events. The accuracy of record keeping was improved by sending monthly text message reminders to each farmer participant over the 2-yr period to visit the farms quarterly to record any missing information. For all farms, at least the follow-ing details were collected: field name and area, fertil-izer type (chemical fertilfertil-izer type, organic manure type, soiled water, lime, or other), quantity applied (kg or t/ ha) and date of application, and number of grazings per field or paddock area. Total concentrates imported and organic N stocking rate data were collected from the fertilizer plans developed by the advisor and farmer for each individual farm. These records were collected an-nually on site or downloaded from the online software package used by the farmer. To maintain consistency, all records were downloaded or transcribed individually and structured before analysis. Total milk sold from the farm and cow herd size data were collected online from the Irish Cattle Breeding Federation website (ICBF, 2018).
Herbage Production and Accumulation
Total herbage production and annual herbage ac-cumulation was recorded by the farmer on a per field basis throughout the growing season using a sward cut and weigh technique or a calibrated falling plate meter (Li et al., 1998; Smit et al., 2005). Farmers were asked to carry out weekly pasture measurements on each field or paddock on the main grazing area used for the dairy herd. These measurements were entered into the Pas-tureBase Ireland software, which calculated a grass feed budget and the total quantity of grass grown and accu-mulated annually. At the end of each year, the annual herbage accumulation (kg of DM/ha) corresponding to each field or paddock on each farm was downloaded from the PastureBase Ireland software.
Herbage Nutrient Concentration
On each farm, herbage samples were taken from all fields/paddocks at 3 times over the growing season, corresponding to spring, summer, and autumn, to de-termine macro- and micro-nutrient concentrations in the herbage DM. On each sampling occasion, a 0.5 m ×
0.5 m area was randomly selected at 3 locations moving down the long axis of each field, an adaptation of the approach of Sheridan et al., (2008). The herbage was sampled from all 3 areas, using electronic grass shears to a height of 4 cm, as would be typical of grazing conditions. The samples from the 3 areas were bulked and a subsample was taken for nutrient testing in the laboratory. The subsample was oven-dried for 48 h at 40°C and following this was ground to pass through a 1-mm mesh in preparation for chemical analysis.
Herbage nutrient concentrations (g/kg of DM) were determined in the laboratory as follows: herbage N con-centration was determined by C & N analyzer (Leco Corporation, St. Joseph, MI). Major nutrients (g/kg of DM) such as P, K, and Mg were determined by in-ductively coupled plasma atomic emission spectroscopy following hot acid (HNO3) digestion and following the
method by Byrne (1979). Pasture nutrient uptake was calculated for each field during the spring, summer, and autumn periods of 2015 and 2016 by multiplying the herbage DM produced (kg of DM/ha) during each period by the measured herbage nutrient concentration (g/kg of DM) for the period. Total annual herbage nutrient uptake was expressed as kg N, P, or K per hectare by summing the nutrient uptake values for each of the 3 periods in 2015 and 2016.
Machine Learning Methods
To estimate herbage production and nutrient uptake from soil, environmental, and management variables, we applied machine learning methods to the data de-scribed above. In particular, we used PCT to capture and visually represent the dependencies between the input variables and the response variables, where the latter are considered both individually (single-target PCT) or jointly (multi-target PCT). Moreover, to get more accurate estimates, we used ensemble of PCT (i.e., random forests of PCT). In this subsection, we will present in detail the methodology used for building the PCT models.
Predictive Clustering Trees. Predictive clustering trees are obtained by using the well-known top-down induction of decision trees (TDIDT) algorithm (Block-eel et al., 1998). The TDIDT takes a set of examples as input and produces a tree model as output. At the beginning, the TDITD procedure selects test on an attribute (independent variable) for the top node, by using a heuristic function computed on the train-ing examples. The heuristic function favors tests that partition the data so that the examples that go to one branch/cluster (tree node) are as similar as possible. To increase cluster homogeneity, heuristic function chooses
the partition that maximally reduces the inhomogeneity, as measured by the variance function. The partitioning procedure continues to recursively split the examples in each subset of resulting partition until a stopping criterion is satisfied. The stopping criterion prevents the tree from overfitting to the training data at hand. When the stopping criterion is met, examples are not split further. A representative value (i.e., prototype) is calculated for the response variables is are stored in the corresponding leaf of the tree (as a prediction).
Two main functions define the algorithm for learning PCT, the variance function, and the prototype func-tion, which computes a representative prediction value for each leaf.
In PCT, both functions can handle multiple response variables, as is required in MTR. This is the main dif-ference between PCT and standard decision trees. The PCT are implemented in the CLUS system (https: / / sourceforge .net/ projects/ clus/ ). For further informa-tion on PCT, we refer the reader to Kocev et al. (2013). Several known tree pruning (stopping) criteria are known that can be used to prevent overfitting, such as specifying the minimal number of examples that must be present in each leaf of a tree and performing F-test pruning, which checks whether a given split yields a significant reduction of its variance. The use of pruning methods typically increases a tree’s interpretability and improves its predictive performance (accuracy).
The advantageous properties of PCT are inherited from standard decision trees. In PCT, no assumptions are made on the probability distributions of the inde-pendent and response variables. The PCT can handle missing values in both the independent and the response variables and are tolerant to noisy and redundant vari-ables as well. Moreover, PCT work with different type of both input and response variables, such as discrete or continuous. Furthermore, they are computation-ally inexpensive to learn and very easy to interpret. While constructing clusters, PCT also produce cluster descriptions. Hence, PCT are readily interpretable, efficient and robust, and have satisfactory predictive performance.
Random Forests of PCT. Random forests of PCT
(Kocev et al., 2013) is an ensemble learning method also implemented in the CLUS system. They are con-structed by using the PCT learning algorithm in CLUS, modified to follow the random forest method proposed by Breiman (2001). The forest of trees is built by using different bootstrap replicates of the training data and by using a randomized version of the PCT learning algorithm that changes the space of input variables dy-namically during the learning process. Bootstrap rep-licates are generated by random sampling of examples from the training set with replacement, until the same
number of examples as in the original training set is sampled. In the random forest algorithm, there is a random selection of input variables (attributes); that is, at each node, a random subset of attributes is taken from the descriptive space D and the best split selected among those is used at the given node. There are dif-ferent ways of setting the number of randomly selected descriptive attributes {f(D) = 1, f(D) = [sqrt(D)] + 1, f(D) = [log2(D)] + 1, and so on}. The response value
predictions for a new instance in a random forest of PCT are calculated by combining the predictions from all base predictive models. In the MTR task, the pre-diction for each target is defined as the average of the predictions obtained from each PCT.
Design of Machine Learning Experiments
To obtain insights into the most influential factors driving the herbage production potential of grasslands on dairy farms and finding some potentially new knowl-edge from data collected from such farms, we investi-gate 4 different scenarios. Over time the interaction of intrinsic soil factors and environment factors creates stable soil environments that can be categorized by soil drainage class. To further explore the influence of field management on herbage production, we split the original data set into 3 data sets based on a different drainage class to further isolate these management ef-fects in the model analysis. Hence, we used 4 data sets for analysis:
• complete data set (CD): consists of all 804 ex-amples, CD = WD ∪ SPD ∪ PD;
• well-drained data set (WD): consists of 606 ex-amples that belong to well-drained soil sex-amples; • somewhat poorly drained data set (SPD):
con-sists of 122 examples that belong to somewhat poorly drained soil samples; and
• poorly drained data set (PD): consists of 76 ex-amples that belong to poorly drained soil sex-amples. In our machine learning experiments, we learned PCT and random forests of PCT from the above data sets. In particular, we learned single-target PCT to estimate herbage production from S, E, and M variables and from nutrient uptake. We also learned multi-target trees to estimate the 4 response variables (herbage pro-duction and N/P/K uptake) for each of the 4 data sets. When learning single PCT, we used the F-test prun-ing algorithm with 8 significance levels: 0.001, 0.005, 0.01, 0.05, 0.1, 0.125, 0.25, and 1.0. By using internal 3-fold cross validation, the optimal significance level was chosen that minimizes the evaluation measure. Be-sides F-test pruning, we also used different values for
the parameter minimum number of instances per leaf in all different scenarios. Namely, in CD and WD, we specified 32 as the minimum number of instances in a leaf, since we have a larger number of instances. Then, in SPD and PD data sets we specified 8 as the mini-mum number of instances in a leaf, since SPD and PD are data sets with a smaller number of examples. To obtain the tree where N, P, and K uptake are used as descriptors to estimate herbage production potential, we used single PCT with a minimum of 64 examples in a leaf with F-test pruning with a 1.0 significance level (default setting).
In the ensemble setting, that is, when using random forests of PCT, we set f(D) = [sqrt(D)] + 1 as the num-ber of randomly chosen attributes from the descriptive space D. Moreover, we set 100 as the number of base-level models (PCT) in the ensemble.
We evaluated the models by using 10-fold cross vali-dation. More specifically, the whole data set was first randomly split into 10 folds. Next, 9 folds were used for training, and the remaining one for testing. The second step in the procedure was repeated 10 times, so that each fold is used exactly once as a test set. The reported results represent the average of all 10 runs.
For assessing the performance of machine learning algorithms, several empirical evaluation measures can be used. In our experiments, we employ 2 well-known measures: the Pearson correlation coefficient (r2) and relative root mean square error (RRMSE). The values of r2 range between 0 and 1. Perfect correlation is
ob-tained when r2 = 1. Therefore, the closer to 1 the value
of r2 is, the better performance is achieved (higher r2
is better). The RRMSE relates the average magnitude of the error (differences between predictions and actual observations) to the error made by the default
predic-tive model, predicting the mean of the observed values. The best performance in terms of RRMSE is obtained if the value of RRMSE is 0 (lower RRMSE values are better).
Our experiments were performed in the PCT frame-work. The PCT framework is implemented in the CLUS system (Blockeel and Struyf, 2002), which is written in Java and is open source software licensed under the GNU General Public License. The CLUS system is available for download at http: / / clus .sourceforge .net/ projects/ clus/ .
RESULTS AND DISCUSSION
In this section, we provide interpretations of the obtained trees and discuss them in the context of the research questions defined in the introductory section.
What Are the Main Drivers of Herbage Production on Grassland-Based Dairy Farming Systems?
We used single-target regression PCT to estimate herbage production using the available S, E, and M variables to investigate the main drivers of herbage production on Irish dairy farms. We started with an interpretation of the tree that estimates the herbage production potential given the S, E, and M attributes, [i.e., herbage production = f (S, E, M), which means that the created trees construct the f function that out-puts the predictions for herbage production and uses the S, E, and M attributes as an input] learned from the entire data set (Figure 1).
The model in Figure 1 selects the number of grazings (NoGrazings) as the top descriptor related to the total annual herbage accumulation (grazing and silage). It
Figure 1. Single-target regression tree for estimating herbage production [i.e., herbage production = f (S, E, M)]. S = soil; E = environment and weather; and M = management. Colored nodes are related on 3 different categories: category 1 (red): high herbage production potential; category 2 (blue): medium herbage production potential; and category 3 (green): low herbage production potential.
is logical that nutrient uptake and herbage accumula-tion will increase with the number of grazing events (NoGrazings). Where herbage production is higher, there is more biomass for the grazing animals to eat and to support grazing events more frequently over the growing season. The majority of grazing events were preceded by an application of chemical fertilizer, mainly N, which is a farm management factor promot-ing increased herbage production. Additionally, durpromot-ing every grazing, some of the nutrients in the herbage consumed were recycled back to the soil in the form of nutrient excretion and deposition (dung and urine) by the grazing livestock, which is not a farm management factor, but a natural process. Overall, the organic and inorganic nutrient inputs, coupled with plant growth stimulation (tillering) through grazing events, led to increased herbage production and nutrient uptake.
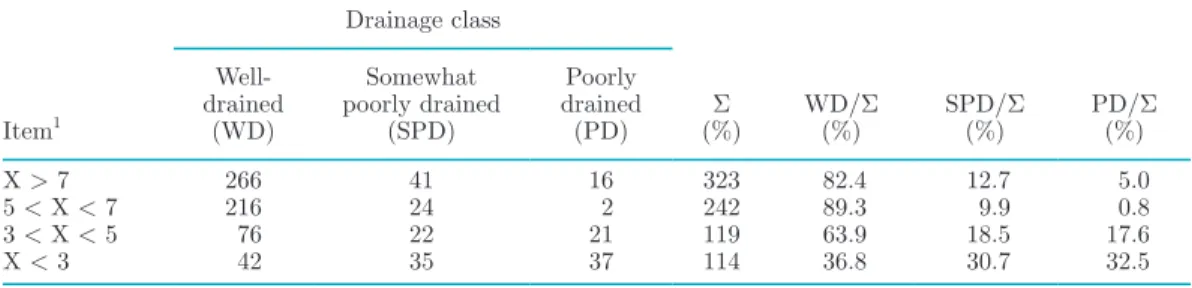
Table 1 shows the proportion of well-drained fields in each NoGrazings category identified by the model. Table 1 indicates that the number of grazing events per field is also related to the soil drainage class. The number of fields in the well-drained class decreased as the number of grazings decreased (see Table 1 and Fig-ure 1). The proportion of well-drained fields (WD/Σ) decreases with NoGrazings, as we examine the model (PCT) from the left to the right. We have 82.4% of well-drained sites for NoGrazings > 7 and only 36.8% for NoGrazings < 3.
Therefore, the model also captures to some degree the biophysical constraints on grazing events and separates the explanation of total annual herbage accumulation into 3 main categories: high (14,300 kg of DM/ha on av-erage), medium (11,600 kg of DM/ha on avav-erage), and low (6,300 kg of DM/ha on average), strongly related to drainage class differences. In general, the model in-dicates high annual herbage accumulation potential on well-drained soils, medium accumulation potential on somewhat poorly drained soils, and low accumulation potential on poorly drained soils.
Next we interpret the parts of the model (PCT in Figure 1) that correspond to each of the 3 categories
(i.e., to fields with different herbage accumulation po-tential).
Category 1: Fields with High Herbage Accumu-lation Potential. At the main node of this component, we find the test Meat_offtake >645.63 kg/ha. Meat off-take is directly related to the stocking rate per hectare, as each cow produces a calf and will gain BW as they mature. In addition, the greater the stocking rate, the greater the nutrient recycling under grazing manage-ment as the excess N and K, in particular, are excreted in dung and urine. However, increased nutrient offtake in meat may also affect the nutrient balance and can typically lead to deficits in P where fertilizer P inputs are low (Buckley et al., 2016). For these fields with high herbage accumulation potential, the model shows that larger Meat_offtake is positively related to higher herbage accumulation. Fields with high stocking rates typically receive high inputs of inorganic and organic fertilizer inputs seasonally to boost herbage production rates. This Meat_offtake >645.63 kg/ha threshold is very high and indicates fields with very high stocking rate, much higher than the average for this study group of farms.
Next, the model splits the fields samples based on the attribute Soil_K_Morgan >125.88 mg/L. In this case, the model chooses soil K fertility to discriminate between the herbage accumulation potential of differ-ent fields. We found that, in general, Soil_K_Morgan was positively related to soil P and Mg fertility and can be viewed as a proxy for soil fertility levels. When Soil_K_Morgan >125.88 mg/L, then, on average, P and Mg were higher too (i.e., average soil fertility was higher). When Soil_K_Morgan ≤125.88 mg/L, the average P and Mg were lower (i.e., the average soil fertility was lower). Lower soil fertility results in lower herbage production (Wall and Plunkett, 2016), which is also indicated by the model. The Mg, K, and P are all essential nutrients for optimum soil fertility for grass production. Each of them is determined by taking a soil sample from the field and chemically testing them for their nutrient concentration. According to the soil
Table 1. The percentage of samples in different drainage classes calculated according to the intervals of number of grazings that appear in the predictive clustering tree model in Figure 1 (from left to right)
Item1 Drainage class ∑ (%) WD/∑ (%) SPD/∑ (%) PD/∑ (%) Well- drained (WD) Somewhat poorly drained (SPD) Poorly drained (PD) X > 7 266 41 16 323 82.4 12.7 5.0 5 < X < 7 216 24 2 242 89.3 9.9 0.8 3 < X < 5 76 22 21 119 63.9 18.5 17.6 X < 3 42 35 37 114 36.8 30.7 32.5 1X = no. of grazings.
index system for K in mineral soils in Ireland, a value above 100 mg/L is considered agronomically optimal for grass production (Wall and Plunkett, 2016). The model identified a Soil_K_Morgan ≤125.88 mg/L threshold, slightly above the level deemed to be optimal by Wall and Plunkett (2016). However, on very high yielding pastures, the K requirement is also high, and under such circumstances, the short-term K supply capacity for plant uptake may be limited in soils with high levels of K fertility.
Next, the model splits fields based on the test Chem_P_input >12.2 kg/ha. Fields with higher chemi-cal P inputs had higher herbage accumulation over the growing season. Chemical fertilizer P is readily avail-able for plant uptake and is typically applied in several fertilizer applications during the growing season to meet the seasonal growth requirements of the grass. Chemi-cal fertilizer P inputs were proportionally the largest of total P inputs on these dairy farms. The majority of the remaining P inputs came from organic manure P inputs, with some concentrate feed-derived P inputs entering the grazing system through parlor feeding at milking time. The model selected a Chem_P_input threshold of 12.2 kg/ha to discriminate between fields of different herbage production potential. This thresh-old P input value is slightly less than the chemical P input requirements for soil P fertility maintenance for grazing only fields on dairy farms (14–19 kg of P/ha; Wall and Plunkett, 2016) and indicates that fields with Chem_P_inputs lower that the threshold of 12.2 kg/ ha were likely to be in P deficit (i.e., mining P from the soil over time). This situation is likely to affect soil P fertility and negatively affect herbage production as indicated by the model.
Category 2: Fields with Medium Herbage
Ac-cumulation Potential. For this component of the
model tree, N_recycled_per_field >5.43 kg of organic N/ha was selected as the test for selecting fields, with higher N recycling, having a higher average herbage accumulation as compared with to those with less N recycled. Nitrogen recycled refers to the quantities of N excretion (dung and urine) the cow recycles back to the field during grazing throughout the year. The nu-trients available for recycling are left over after the cow metabolizes nutrients for milk and meat production first. In a grazed grassland farming system, dung and urine patches contain very high concentrations of N. While the patches are not distributed evenly across the field and lead to heterogeneous soil mineral N levels, if the fields are grazed more often or the stocking rate is relatively high, it is likely that the density of urine and dung patches per unit area grazed will be higher, thus contributing more nutrients across the area to drive grass production. On closer investigation, the fields
identified by the model with N_recycled_per_field >5.43 kg of organic N/ha corresponded to farms with an average dairy grazing platform stocking rate greater than 170 kg of organic N/ha (i.e., 2 livestock units/ ha) and were predominantly grazed. This indicates that fields with N_recycled_per_field >5.43 kg of or-ganic N/ha are associated with higher stocking rates, are predominantly grazed, and have more N excretion compared with fields with very low N recycled (<5.43 kg of organic N/ha).
At the next level of the tree, the test selected was LandUseCropping = GrassOneCutPlusGrazing. While taking a cut of silage removes nutrients in the har-vested grass, increased fertilizer applications are used on fields selected for grass silage production and may drive increased herbage production. Typically, 2 fertil-izing scenarios arise: (1) Fertilizer added pre-harvest: the field was managed to provide sufficient fertilizer inputs to produce enough herbage biomass for a silage cut. During this period of the year, typically early sum-mer, higher qualities of fertilizer were applied to these fields compared with fields that are used for grazing only. (2) Fertilizer added post-silage harvest: after the herbage biomass has been harvested for silage, fertil-izer was added to the system to ensure the grassland was adequately supplied with nutrients to recover after the cutting and harvesting event. In addition, grass-land that is managed for silage production has higher yield potential as the plants grow to a more mature stage up to harvesting time, where they can intercept more light for photosynthesis and the total herbage biomass is greater compared with typical cumulative grazing biomass yield for the same period. As a result, the herbage biomass used for silage had higher nutrient concentration and total nutrient removal from the soil.
Next the Milk_offtake >24,493 L/ha, which was the total amount of produced milk for each field, was used to split the herbage accumulation of the fields into 2 groups. Those with higher milk offtake had a mean herbage accumulation of 14,906 kg of DM/ha and those with lower milk offtake had a mean of 12,974 kg of DM/ ha. This splitting condition Milk_offtake distinguishes between higher and lower stocking rates. The average milk yield per cow in Ireland was 5,036 kg of milk per cow between 2013 and 2015 (Teagasc, 2016) and this threshold of Milk_offtake >24,493 L/ha indicates that, on average, the stocking rate on the dairy grazing plat-form fields above this milk offtake threshold was 4.75 cows per ha.
At the bottom level of the tree, the test W_Clover-Class = Low best discriminated herbage production across the remaining fields that had the lowest herbage production in the medium herbage production category. The presence of white clover is expected to contribute a
source of N for grass uptake. However, in this case, the model identifies high levels of white clover as an herb-age production limiting factor (i.e., fields with white clover had lower overall annual herbage accumulation). According to Murphy et al. (2018), fields with high levels of white clover present also received high levels of fertilizer N inputs. Under such practice these fields with white clover present will not efficiently use the fixing capacity of the white clover for total herbage produc-tion. Fields with a high sward composition for clover received the highest average chemical N input (236 kg of N/ha). However, these fields had lower annual herbage accumulation (11,200 kg of DM/ha) compared with fields with low sward clover composition (12,800 kg of DM/ha) with slightly lower average chemical N input (228 kg of N/ha). This may be a result of too much clover in the grass sward having a negative effect on perennial ryegrass growth because of shading and competition for nutrients and water, thus reducing the total annual herbage accumulation.
Category 3: Fields with Low Herbage Accu-mulation Potential. Examining the fields with lower overall herbage production potential in the tree (on the right side of Figure 1), we can see that only 2 attributes are used for splitting: NoGrazings and LandUseCrop-ping. The number of grazings on this side of the tree is very low (<3) and the fields within this node had a very high proportion of low drained sites. This indicates that soil drainage was an overriding factor limiting grass-land management and herbage production, which was on average 6,264 kg of DM/ha for all the fields in this category.
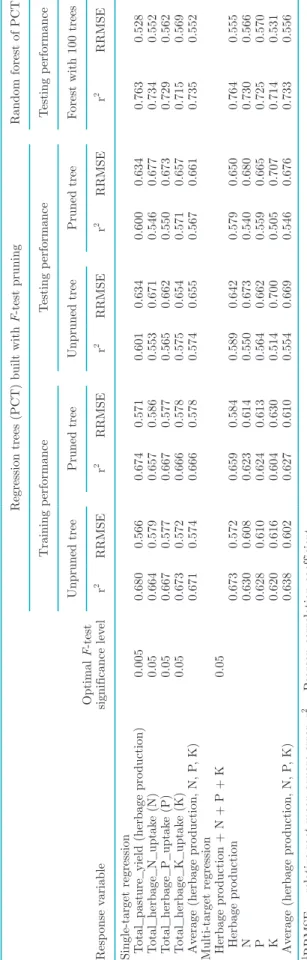
Next, we discuss the descriptive and predictive performance of the models. We consider the descrip-tive (training) and predicdescrip-tive (testing) performance of single PCT and ensemble of PCT (random forest) for single-target regression and MTR tasks. All results considering the model performances for all possible scenarios, based on the CD, are shown in Table 2. The results consist of per target values and averaged values for r2 and RRMSE.
We can see that the (pruned) model (i.e., single PCT), shown in Figure 1 and obtained using F-test pruning, has a descriptive performance of r2 = 0.766
and RRMSE = 0.484. We show the descriptive perfor-mance of the original nonpruned model as well (r2 =
0.777 and RRMSE = 0.472) to compare how good the
F-test pruning method is. We can see that the descrip-tive performances are very similar (i.e., the difference is only 1%). This is an advantage of this pruning method because we do not use the original model and avoid the possibility of overfitting.
The predictive performance estimate obtained using by 10-fold cross validation is r2 = 0.715 and RRMSE
T
able 2.
P
erformance results for the complete data set ac
hiev
ed b
y predictiv
e clustering trees (PCT) for single- and m
ulti-target regression
1
Resp
onse v
ariable
Optimal F-test significance lev
el
Regression trees (PCT) built with
F -test pruning Random forest of PCT Training p erformance T esting p erformance T esting p erformance Unpruned tree Pruned tree Unpruned tree Pruned tree
Forest with 100 trees
r 2 RRMSE r 2 RRMSE r 2 RRMSE r 2 RRMSE r 2 RRMSE
Single-target regression Total_herbage_pro
duction (herbage pro duction) 0.05 0.777 0.472 0.766 0.484 0.715 0.535 0.715 0.535 0.798 0.477 T otal_Herbage_N_uptak e (N) 0.1 0.751 0.499 0.738 0.512 0.684 0.563 0.678 0.569 0.779 0.494 T otal_Herbage_P_uptak e (P) 0.001 0.749 0.501 0.744 0.506 0.691 0.556 0.693 0.554 0.768 0.508 T otal_Herbage_K_uptak e (K) 0.005 0.743 0.507 0.741 0.509 0.696 0.551 0.692 0.555 0.753 0.525 Av
erage (herbage pro
duction, N, P , K) 0.755 0.495 0.747 0.503 0.697 0.551 0.694 0.553 0.775 0.501
Multi-target regression Herbage pro
duction + N + P + K 0.005 Herbage pro duction 0.772 0.478 0.767 0.483 0.720 0.529 0.719 0.530 0.795 0.478 N 0.740 0.510 0.733 0.516 0.691 0.557 0.691 0.557 0.789 0.483 P 0.736 0.514 0.728 0.521 0.686 0.560 0.684 0.562 0.761 0.514 K 0.712 0.536 0.703 0.545 0.647 0.595 0.643 0.598 0.761 0.515 Av
erage (herbage pro
duction, N, P , K) 0.740 0.510 0.733 0.516 0.686 0.560 0.684 0.562 0.777 0.498 1 RRMSE = relativ e ro
ot mean square error; r
2 = P
earson correlation co
efficien
= 0.5346. This is a quite good predictive performance, considering the problem complexity and domain di-verseness. Observing the results obtained by using ensembles of PCT (i.e., random forests of PCT), as expected, we can see an improvement (approximately 8%) for the predictive performance (r2 = 0.798 and
RRMSE = 0.477). The problem with ensembles from a domain expert point of view is their interpretability. The random forests cannot be interpreted, but can be easily used if the domain expert is only interested in the accurate predictions (for example, for drawing an ac-curate map). In our case, we are also interested in elu-cidating the interactions and interconnections among the variables (attributes).
How Do Nutrient Supply and Nutrient (N, P, and K) Uptake Affect Herbage Production?
To investigate this question, we model herbage accu-mulation as a response variable, using nutrient uptake for each field as an independent variable, to investigate how the herbage production is driven by soil fertility and nutrient supply. The nutrient uptake value rep-resents the nutrients that the grassland herbage has removed from the soil and will be consumed and uti-lized by the cow. The cow requires these nutrients to produce milk and meat. After this, the cow excretes the residual nutrients, not used for production, in dung and urine. While we expect nutrient uptake to be closely related to the annual herbage production, we propose this modeling analysis to identify the most limiting nu-trient influence on herbage production. In Figure 2, we examine how the herbage production levels across the grassland dairy fields were categorized based on their
nutrient (N, P, and K) uptake. The purpose of Figure 2 is to present how herbage production is driven by nutrient uptake rather to make predictions. Nutrient uptake variables are considered to be response variables in the remaining analyses.
The tree clearly indicates that Total_Herbage_P_ uptake is the most limiting nutrient driving herbage production, since it appears in the top levels of the tree. The tree is generated by using the PCT algorithm, where the descriptors (independent variables) are total herbage N, P, and K uptake and annual herbage ac-cumulation is the response. The next most important driver was Total_Herbage_N_uptake that appears in the third level of the tree and is followed by To-tal_Herbage_K_uptake in the fourth level. This model provides new insight into the obvious interconnection between these nutrients and how they relate at differ-ent herbage production levels, where the supply and uptake for these nutrients vary.
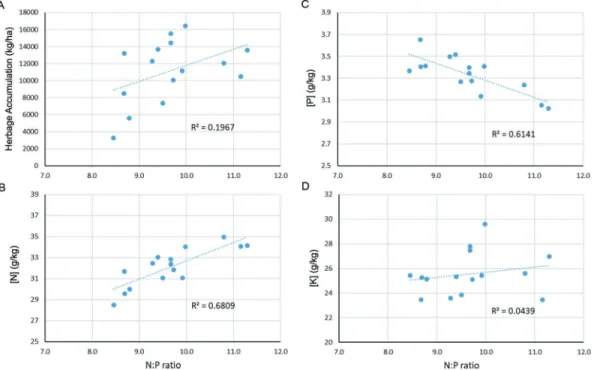
We further investigated the nutrient (N, P, and K) uptake levels in the herbage produced as per the group-ings (leaf nodes) of fields identified by the PCT in Figure 1 and their relation to the N:P ratio, as shown in Figure 3. Each panel depicts on the y-axis one of the 4 response variables, whereas the N:P ratio is shown on the x-axis. Each point corresponds to one of the leaves of the PCT in Figure 1.
Figure 3A shows a weak positive relationship (r2 =
0.197) between the herbage accumulation and the N:P ratio for these field groupings. For the majority of these field groupings, N, P, and K appear to be sufficiently supplied. However, variability exists between them and when the average nutrient concentrations in the herb-age measure in the herbherb-age form fields within these
groupings is evaluated, indications of nutrient limita-tions for achieving maximum herbage production arise. Figure 3B indicates that N may be somewhat limiting in field groups with N:P ratio <9 as the N concen-trations dropped below 30 g/kg of DM, and similarly Figure 3C indicates that P may be somewhat limiting on field groups with a N:P ratio > 11, as the herbage P concentration drops to ~3 g/kg of DM. Figure 3D shows that other field groups had low K concentrations (<25 g/kg) even when the N and P appeared to be optimal. This multi-target modeling approach shows utility for assessing and identifying what nutrients may be limiting herbage production across a range of field sites with different S, E, and M conditions. It could also be used to assess the robustness of nutrient manage-ment programs where multiple nutrient input practices interact with varying soil and soil fertility levels both within and between farms.
How Do S, E, and M Variables Interact Within a Grazed Grassland Farming System to Affect Herbage Production and Herbage Nutrient Uptake?
The above discussion provides insight into the effects of nutrient uptake on herbage production. However, many factors affect both soil nutrient supply and plant uptake of nutrients beyond fertilization and general nutrient management practices. To further elucidate which factors may be most important in this respect,
we introduce a third research question: How do S, E, and M variables interact within a grazed grassland farming system to affect herbage production and herb-age nutrient uptake? To answer this question, we evalu-ated if our models could simultaneously predict N, P, and K uptake and herbage production using various S, E, and M attributes collected at each field site [i.e., (N, P, K, herbage production) = f (S, E, M)]. The tree shown in Figure 4 is pruned by using the F-test pruning procedure, which selected the optimal significance level of 0.005.
First, we examine the MTR model performance (descriptive and predictive), shown in Table 2. The descriptive (training) performance of the pruned tree, averaged across the 4 targets, is r2 = 0.733 and RRMSE
= 0.516, which does not differ significantly from the descriptive performance of the original unpruned tree. This fact confirms that the pruning method performed well. The predictive (testing) performance of the pruned tree is r2 = 0.684 and RRMSE = 0.562, which is quite
good for this specific domain, considering the problem complexity. Furthermore, if we compare the perfor-mances of the single-target tree that predicts herbage production potential and the multi-target tree that predicts herbage production potential plus N, P, and K uptake, simultaneously, using the same descriptive variables, we can see that the difference is only 1% (the average performance of single-target trees is 1% better than that of the MTR tree). This is an insignificant
dif-Figure 3. Relationships between (A) herbage accumulation, (B) nitrogen, (C) phosphorus, and (D) potassium concentrations and mass N:P ratio of herbage produced within the groups of different field sites identified by the model (Figure 2).
ference in performance, but a strong advantage of using MTR modeling because instead of looking separately at 4 different single-target models for N, P, and K uptake and herbage production, we look at and use only one tree that predicts all 4 values at the same time. Hence, using MTR has practical advantages. As expected, the predictive performance is improved by approximately 10%, if we use an ensemble of PCT for MTR (in our case a random forest). We have r2 = 0.777 and RRMSE
= 0.498.
Next, we continue with an interpretation of the MTR tree model given in Figure 4. The top descriptive attri-bute was the number of grazings (NoGrazings), where sites with higher numbers of grazings had higher annual herbage accumulation as compared with those which were grazed less frequently over the year. Similar to the discussion of Figure 1 previously, the NoGrazings variable was closely linked with herbage production and utilization, with nutrient inputs and recycling and also with the drainage class of the soils within each grouping of fields (Table 1). Hence, the NoGrazings variable divides the sites into the same herbage pro-duction potential categories (high, medium, and low annual herbage production potential). Examining the differences between the trees produced by the single-target and MTR tree models (Figure 1 versus Figure 4), we can see that there are differences in the nutrients used to split the groups. For example, in Figure 1, the attribute used to split the fields is Soil_K_Morgan, but in Figure 4, the Soil_Mg_Morgan attribute appears. In many parts, the discussion of the attributes used for splitting the tree of Figure 1 are the same for Figure 4. In the following part, we only discuss the new tests that appear in this MTR tree, but not in the single-target tree in Figure 1. Specifically, we interpret the tests:
WeatherStation = [Moorepark, Gurteen, Castledocker-ell], FieldArea >1.84 ha (in high herbage production potential fields) and AirTemp >9.9 (in medium herb-age production potential fields).
The weather stations Moorepark, Gurteen, and Castledockerell have similar low rainfall and air tem-peratures in contrast to the other weather stations (Johnstown, Ballycanew, and Timoleague). In Ireland, the amount of rainfall is often a limiting factor on the times when grazing animals can enter a field for graz-ing events, because when the soils are too wet severe poaching of the soil can occur, which has negative consequences for subsequent herbage production and utilization. An area with low rainfall would suggest that there are more opportunities (days available) to graze a field, compared with an area with high rainfall (less days available). Note that rainfall will affect the trafficability of the soil, where poor trafficability due to high rainfall means animals will not be able to graze because the soil is too soft and the animals would only damage it. Good trafficability during dry spells means animals can graze without damaging the soil.
Next, we move to the test FieldArea >1.84 ha. This side of the branch was not distinguishable specifically by the field area, drainage class, or slope, but was re-lated back to the weather station difference. This side of the branch represents the weather stations that are nearer the coast (Johnstown, Ballycanew, and Timole-ague). Farms on the coast are generally slightly warmer and are not as severely affected by frost, which can af-fect herbage production levels. Based on the evidence, we found for the sites that belong to this branch of the tree, we see that these farms (and associated weather stations) have a lower number of degree days (days below 15°C), which gives them a longer
growing/graz-Figure 4. Multi-target regression tree learned on the complete data set. Colored nodes are related on 3 different categories: category 1 (red): high herbage production potential; category 2 (blue): medium herbage production potential; and category 3 (green): low herbage production potential.
ing season. It is likely that field area and number of grazings are linked. A high stocking rate and small field area could result in more grazings. A high stocking rate on a large field would take more days to graze out as compared with a small field. With a limited amount of time during the grazing season, a smaller field may be grazed out more times than a larger field. For this data set, the average field size was 1.37 ha, with field sizes ranging from 1.74 to 0.82 ha, excluding outliers.
The next new condition in the tree given in Figure 4 is AirTemp >9.9. Air temperature may be a proxy for weather differences per region. This proxy is also connected to rainfall, solar radiation, and degree days. Air temperature may indicate a longer growing/grazing season. A longer growing season allows more time to apply fertilizers and increase the pasture production (i.e., more grazings and higher herbage production). Moreover, air temperature is an indicator of growing season length and can be connected to the number of growing days (i.e., degree days below 15°C). A higher number of degree days with temperatures below 15°C (i.e., a colder growing season) versus a lower number of degree days, which means a lower number of days below 15°C (i.e., a warmer growing season). Air temperature and soil temperature (to 10 cm depth) are very closely linked. Nitrogen uptake begins around 5°C and grass growth around 6°C. An average air temperature above 9.9°C would indicate the soil conditions were suitable for pasture production for a longer time period. This enables fields or farms with air temperatures greater than 9.9°C to experience a longer growing season.
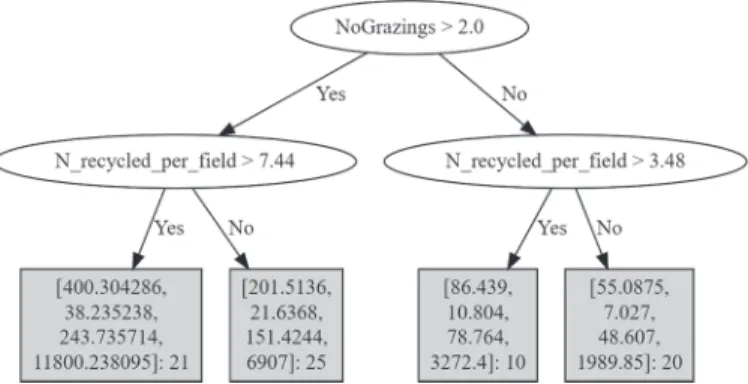
Additionally, we split the CD into 3 drainage classes: well-drained, somewhat poorly drained, and poorly drained sites. We perform the same analysis on those 3 different data sets to see if some new insights and knowledge can be extracted considering the tree models learned from each data set. Although the distinguishing based on drainage class is made by the number of graz-ings on the CD, we tried to find additional information in the models for each drainage class. For example, considering the low herbage production potential fields (green subtree) in the tree (Figure 4), we can see that for this subtree, there are no other splitting attributes but NoGrazing and LandUseCropping that we already discussed before. Following the fact that most of the examples belonging to this subtree are poorly drained, the idea of considering the tree obtained on the PD is justified.
If we look in the tree obtained from the PD (see Figure 5), we can see that there is additional important information that complements the green subtree given in Figure 4. Namely, if NoGrazings > 2 or ≤2, the next attribute used is N_recycled_per_field, which indicates the fact that the reason of higher or lower annual
herb-age accumulation is the amount of nutrients recycled (dung and urine) by the cows at grazing.
The predictive performance of the tree built on the PD is the highest (r2 = 0.761 and RRMSE = 0.489).
The ensembles, again, as expected, improve the predic-tive performance (r2 = 0.830 and RRMSE = 0.438).
The predictive and descriptive performances for all 3 scenarios (well-drained, somewhat poorly drained, and poorly drained) are given in Appendix Tables A2, A3, and A4, respectively.
Summary and Discussion
The technical results show that performance of a MTR tree is not significantly different from that of the 4 single-target models. The predictive performance of r2 = 0.684 shows that we have a quite good
predic-tive model, despite the complexity of the task at hand. Practically, the MTR tree is more efficient, since we have to interpret only one tree instead of looking at 4 different trees, one for each response variable. As we discussed, a MTR tree can be easily interpreted by a domain expert (e.g., agronomist). As expected, we get improved predictive performance if we use ensembles of PCT (random forest of PCT) in all scenarios in both single- and MTR tasks, but we lose interpretability.
Using this modeling approach, we found that the N, P, and K uptake is not always proportional relative to herbage accumulation levels. We could explore this variability by interpreting the learned models to bet-ter understand which nutrient may be limiting herbage production. Variability in herbage nutrient concentra-tions across dairy farms could lead to significant vari-ability in nutrient use efficiency for a given level of production. Across these dairy grassland fields used for dairy production, we found the strength of limita-tion to herbage produclimita-tion based on nutrient uptake to follow this order P > N > K. This finding indicates that grassland swards are undersupplied with P from
Figure 5. Multi-target regression tree learned on the poorly drained data.
either soil reserves or fertilizer P input to maximize herbage production potential. Uptake of N and K is less limiting; however, given the P limitations, their uptake would be less efficiently used by the grassland.
In this study, we identified several important S, E, and M variables driving grass production in Ireland. Out of these factors, the number of grazing events was the most significant factor related to annual herbage accumulation. Across the large number of fields used in this study, the number of grazing events was also linked with soil drainage class, which indicates that soil type moderates/controls herbage production potential and also herbage utilization under grazing management. On high herbage production potential grassland, the regional weather has the biggest effect, whereas on me-dium and low herbage production potential grassland, the factors grassland land use (grazing vs. silage) and fertilizer P input have the largest effects.
Overall, the MTR tree provided the most useful in-formation in terms of explaining herbage production potential and nutrient uptake across these grassland sites. Although this modeling approach could be used to identify herbage production potential with high ac-curacy, it can also inform the most influential dynamic factors that could be managed to increase herbage production in the future. These models could be also used as a basis for integrated soil fertility management, where other factors, such as soil type and environment factors, constrain optimum N, P, and K recommenda-tions.
CONCLUSIONS
Our research study combined machine learning (i.e., data-driven modeling techniques) with practices and knowledge based on various soil, environmental, and management indicators, which describe interactions between nutrient uptake and herbage production. This approach has several technical advantages and impli-cation for future nutrient management and advice for farmers to increase herbage production on dairy farms.
The implications of this work for Irish grass-based dairy farms are as follows: (1) the models we have learned from data can be used to identify fields with poorer herbage production performance and to direct on-site investigation to ascertain the problem or the constraints. (2) This data-driven modeling approach suggests that (1) guiding a more balanced approach to fertilizer inputs, including P and also K, is required, in addition to high quantities of N fertilizer input; (2) to improve environmental sustainability, explicit geo and climatic recommendations for fertilization are required; and (3) to monitor and assess grassland productivity, only a few variables are required, including soil
drain-age class (grazing events), grassland mandrain-agement, soil nutrient status, production intensity, as well as region and local weather. Further work could be conducted to evaluate other farm production and environmental sustainability targets, as well as trade-offs and syner-gies between the underlying factors by using different modeling approaches for solving the MTR task.
ACKNOWLEDGMENTS
We thank the TEAGASC, Environment Soils and Land-Use Department, for providing the data. Fur-thermore, we acknowledge the support of the Euro-pean Commission through the project LANDMARK - Land Management, Assessment, Research, Knowledge Base (H2020 grant number 635201). As their fellow, SN thanks the Teagasc Walsh Fellowship Programme (Johnstown Castle, Co. Wexford, Ireland).
REFERENCES
Blockeel, H., L. Raedt, and J. Ramon. 1998. Top-down induction of clustering trees. Pages 55–63 in Proceedings of the 15th Interna-tional Conference on Machine Learning. Morgan Kaufmann Pub-lishers Inc., San Francisco, CA.
Blockeel, H., and J. Struyf. 2002. Efficient algorithms for decision tree cross-validation. J. Mach. Learn. Res. 3:621–650.
Breiman, L. 2001. Random forests. Mach. Learn. 45:5–32.
Buckley, C., D. P. Wall, B. Moran, S. O’Neill, and P. N. C. Murphy. 2016. Phosphorus management on Irish dairy farms post controls introduced under the EU Nitrates Directive. Agric. Syst. 142:1–8. Byrne, E., 1979. Chemical Analysis of Agricultural Materials. An
Fo-ras Taluntais, Dublin, Ireland.
Connolly, L., A. Kinsella, G. Quinlan, and B. Moran. 2010. National Farm Survey 2008. Teagasc, Athenry, Ireland.
Creighton, P., E. Kennedy, L. Shalloo, T. M. Boland, and M. O’Donnovan. 2011. A survey analysis of grassland dairy farming in Ireland, investigating grassland management, technology adop-tion and sward renewal. Grass Forage Sci. 66:251–264.
Demšar, D., S. Džeroski, T. Larsen, J. Struyf, J. Axelsen, M. B. Peder-sen, and P. H. Krogh. 2006. Using multi-objective classification to model communities of soil. Ecol. Modell. 191:131–143.
Dillon, P., and L. Delaby. 2009. Challenges from EU and International Environmental policy and legislation to animal production from temperate grassland. Tearmann (Dublin) 7:51–68.
Ergon, Å., L. Kirwan, M. A. Bleken, A. O. Skjelvåg, R. P. Collins, and O. A. Rognli. 2016. Species interactions in a grassland mixture under low nitrogen fertilization and two cutting frequencies: 1. Dry-matter yield and dynamics of species composition. Grass For-age Sci. 71:667–682.
Finneran, E., P. Crosson, P. O’Kiely, L. Shalloo, D. Forristal, and M. Wallace. 2010. Simulation modelling of the cost of producing and utilising feeds for ruminants on Irish farms. J. Farm Manag. 14:95–116.
Hanrahan, L., A. Geoghegan, M. O’Donnovan, V. Griffith, E. Ru-elle, M. Wallace, and L. Shalloo. 2017. PastureBase Ireland: A grassland decision support system and national database. Comput. Electron. Agric. 193:193–201.
Hennessy, T., and B. Moran. 2015. National Farm Survey 2015, Athen-ry, Co. Galway, Ireland. Agricultural Economics and Farm Surveys Department, Rural Economy Development Programme.
Herlihy, M. 1979. Nitrogen mineralisation in soils of varying texture, moisture and organic matter, I. Potential and experimental values in fallow soils. Plant Soil 53:269–275.
Humphreys, J., K. O’Connell, and I. A. Casey. 2008. Nitrogen flows and balances in four grassland based systems of dairy production on a clay-loam soil in a moist temperate climate. Grass Forage Sci. 63:467–480.
ICBF. 2018. Irish Cattle Breeding Federation website. Accessed Feb. 14, 2019. https: / / www .icbf .com/ wp/ .
Kocev, D., S. Džeroski, M. D. White, G. R. Newell, and P. Griffioen. 2009. Using single- and multi-target regression trees and ensembles to model a compound index of vegetation condition. Ecol. Modell. 220:1159–1168.
Kocev, D., C. Vens, J. Struyf, and S. Džeroski. 2013. Tree ensembles for predicting structured outputs. Pattern Recognit. 46:817–833. Levatić, J., D. Kocev, M. Debeljak, and S. Džeroski. 2015a.
Commu-nity structure models are improved by exploiting taxonomic rank with predictive clustering trees. Ecol. Modell. 306:294–304. Li, G. D., K. R. Heylar, L. J. Castleman, G. Norton, and R. P. Fisher.
1998. The implementation and limitations of using a falling plate meter to estimate pasture yield. In Agronomy—Growing a Greener Future, Proceedings of the 9th Australian Agronomy Conference, July 1998, 20–23, Sydney, (Australia).
Murphy, P. M., P. N. C. Murphy, and D. P. Wall. 2018. An evaluation of nutrient balances at the whole-farm and field scale on 21 Irish dairy farms. Proceedings of the 27th European Grassland Federa-tion General Meeting, Cork 17th-21st June 2018, 23 Grassland Science in Europe.
Nitrate Directive. 1991. Council Directive of December 1991 concern-ing the protection of waters against pollution caused by nitrates from agricultural sources. Urban Waste Water Treatment Direc-tive. Council Directive 91/271/EEC of May 1991 concerning urban waste-water treatment, European Commission, Brussels, Belgium. Nunan, N., M. A. Morgan, J. Scott, and M. Herlihy. 2000. Temporal
changes in nitrogen mineralisation, microbial biomass, respiration and protease activity in a clay loam soil under ambient tempera-ture. Biol. Environ. 100B:107–114.
O’Donovan, M., E. Lewis, and P. O’Keily. 2011. Requirements of fu-ture grass-based ruminant production systems in Ireland. Ir. J. Agric. Food Res. 50:1–21.
O’Leary, M., A. Geoghegan, and M. O’Donovan. 2016. PastureBase Ireland – Capturing grassland data on commercial Irish farms.
Accessed Jun. 20, 2019. https: / / www .teagasc .ie/ media/ website/ crops/ grassland/ IGA -Student -Conference .pdf.
O’Mara, F. 2008. Country Pasture/Forage Resource Profile/Ireland. Accessed Mar. 11, 2019. http: / / www .fao .org/ ag/ AGP/ AGPC/ doc/ pasture/ forage .htm.
Schils, R. L. M., M. H. de Haan, J. G. Hemmer, A. van den Pol-van Dasselaar, J. A. de Boer, A. G. Evers, G. Holshof, J. C. van Mid-delkoop, and R. L. Zom. 2007. DairyWise, A whole-farm dairy model. J. Dairy Sci. 90:5334–5346.
Shalloo, L., P. Dillon, M. Rath, and M. Wallace. 2004. Description and validation of the Moorepark Dairy System Model. J. Dairy Sci. 87:1945–1959.
Sheridan, H., J. Finn, N. Culleton, and G. O’Donovan. 2008. Plant and invertebrate diversity in grassland field margins. Agric. Eco-syst. Environ. 123:225–232.
Simo, I., R. Creamer, B. Reidy, G. Jahns, P. Massey, B. Hamilton, J. Hannam, E. McDonald, and P. Sills. 2008. Irish Soil Information System. Accessed Feb. 13, 2019. http: / / gis .teagasc .ie/ isis/ . SIS. 2017. Soil Index System. Accessed Jan. 27, 2019. https: / /
www .teagasc .ie/ crops/ soil–soil -fertility/ soil -analysis/ soil -index -system/ .
Smit, H. J., H. Z. Taweel, B. M. Tas, S. Tamminga, and A. Elgersma. 2005. Comparison of techniques for estimating herbage intake of grazing dairy cows. J. Dairy Sci. 88:1827–1836.
Smith, A., and P. J. Allcock. 1985. The influence of species diversity on sward yield and quality. J. Appl. Ecol. 22:185–198.
Teagasc. 2016. Sectoral road map: Dairying. Accessed Nov. 14, 2018.
https: / / www .teagasc .ie/ publications/ 2016/ road -map -2025 -dairy .php.
Teagasc. 2019, PastureBase Ireland. Accessed May 2019. https: / / www .teagasc .ie/ crops/ grassland/ pasturebase -ireland/ .
Vellinga, T. V., G. Andre, R. L. M. Schils, T. Kraak, and O. Oenema. 2010. Accounting for residual effects of previously applied nitro-gen fertilizer on intensively managed grasslands. Grass Forage Sci. 65:58–75.
Wall, D. P., and M. Plunkett. 2016. Major and micro nutrient advice for productive agricultural crops. Teagasc Johnstown Castle, Oc-tober 2016. https: / / www .teagasc .ie/ media/ website/ publications/ 2016/ soil -fertility -green .pdf.
APPENDIX
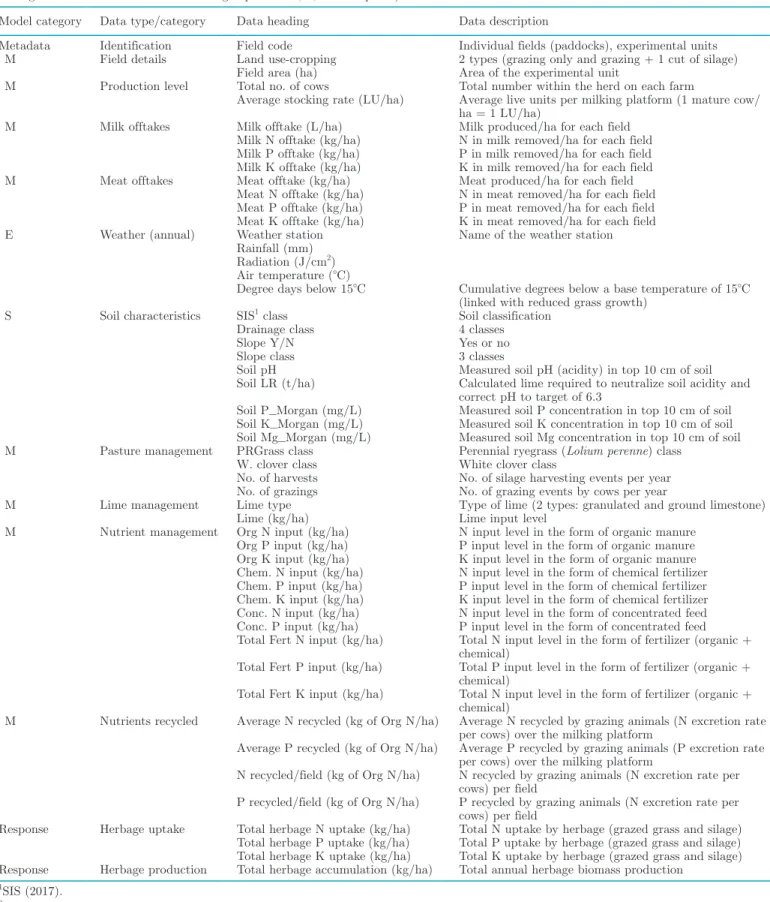
Table A1. Descriptions of the soil (S), environment/weather (E), and management (M) factors (variables) and response variables (annual herbage accumulation and nutrient herbage uptake – N, P, and K uptake)
Model category Data type/category Data heading Data description
Metadata Identification Field code Individual fields (paddocks), experimental units M Field details Land use-cropping 2 types (grazing only and grazing + 1 cut of silage)
Field area (ha) Area of the experimental unit
M Production level Total no. of cows Total number within the herd on each farm
Average stocking rate (LU/ha) Average live units per milking platform (1 mature cow/ ha = 1 LU/ha)
M Milk offtakes Milk offtake (L/ha) Milk produced/ha for each field Milk N offtake (kg/ha) N in milk removed/ha for each field Milk P offtake (kg/ha) P in milk removed/ha for each field Milk K offtake (kg/ha) K in milk removed/ha for each field M Meat offtakes Meat offtake (kg/ha) Meat produced/ha for each field
Meat N offtake (kg/ha) N in meat removed/ha for each field Meat P offtake (kg/ha) P in meat removed/ha for each field Meat K offtake (kg/ha) K in meat removed/ha for each field E Weather (annual) Weather station Name of the weather station
Rainfall (mm) Radiation (J/cm2) Air temperature (°C)
Degree days below 15°C Cumulative degrees below a base temperature of 15°C (linked with reduced grass growth)
S Soil characteristics SIS1 class Soil classification
Drainage class 4 classes
Slope Y/N Yes or no
Slope class 3 classes
Soil pH Measured soil pH (acidity) in top 10 cm of soil Soil LR (t/ha) Calculated lime required to neutralize soil acidity and
correct pH to target of 6.3
Soil P_Morgan (mg/L) Measured soil P concentration in top 10 cm of soil Soil K_Morgan (mg/L) Measured soil K concentration in top 10 cm of soil Soil Mg_Morgan (mg/L) Measured soil Mg concentration in top 10 cm of soil M Pasture management PRGrass class Perennial ryegrass (Lolium perenne) class
W. clover class White clover class
No. of harvests No. of silage harvesting events per year No. of grazings No. of grazing events by cows per year
M Lime management Lime type Type of lime (2 types: granulated and ground limestone) Lime (kg/ha) Lime input level
M Nutrient management Org N input (kg/ha) N input level in the form of organic manure Org P input (kg/ha) P input level in the form of organic manure Org K input (kg/ha) K input level in the form of organic manure Chem. N input (kg/ha) N input level in the form of chemical fertilizer Chem. P input (kg/ha) P input level in the form of chemical fertilizer Chem. K input (kg/ha) K input level in the form of chemical fertilizer Conc. N input (kg/ha) N input level in the form of concentrated feed Conc. P input (kg/ha) P input level in the form of concentrated feed Total Fert N input (kg/ha) Total N input level in the form of fertilizer (organic +
chemical)
Total Fert P input (kg/ha) Total P input level in the form of fertilizer (organic + chemical)
Total Fert K input (kg/ha) Total N input level in the form of fertilizer (organic + chemical)
M Nutrients recycled Average N recycled (kg of Org N/ha) Average N recycled by grazing animals (N excretion rate per cows) over the milking platform
Average P recycled (kg of Org N/ha) Average P recycled by grazing animals (P excretion rate per cows) over the milking platform
N recycled/field (kg of Org N/ha) N recycled by grazing animals (N excretion rate per cows) per field
P recycled/field (kg of Org N/ha) P recycled by grazing animals (N excretion rate per cows) per field
Response Herbage uptake Total herbage N uptake (kg/ha) Total N uptake by herbage (grazed grass and silage) Total herbage P uptake (kg/ha) Total P uptake by herbage (grazed grass and silage) Total herbage K uptake (kg/ha) Total K uptake by herbage (grazed grass and silage) Response Herbage production Total herbage accumulation (kg/ha) Total annual herbage biomass production
1SIS (2017). 2Org = organic.
![Figure 1. Single-target regression tree for estimating herbage production [i.e., herbage production = f (S, E, M)]](https://thumb-us.123doks.com/thumbv2/123dok_us/134563.2516196/6.918.65.826.787.1032/figure-single-regression-estimating-herbage-production-herbage-production.webp)