Closing price manipulation and the
integrity of stock exchanges
T
ā
lis J. Putni
ņ
š
A thesis submitted in partial fulfilment of the requirements for the degree of
Doctor of Philosophy
Discipline of Finance
Faculty of Economics & Business
University of Sydney
Statement of originality
This is to certify that to the best of my knowledge, the content of this thesis is my own work. This thesis has not been submitted previously for a higher degree or qualification at any other university or institute of higher learning. I certify that the intellectual content of this thesis is the product of my own work and that all the assistance received in preparing this thesis, and sources used have been acknowledged.
Acknowledgements
First and foremost, I thank my academic supervisor, Associate Professor Carole Comerton-Forde, for her consistently strong support and guidance throughout the preparation of this thesis. It has been a pleasure to work with Carole and learn from her expertise.
This research has also benefited greatly from the thoughtful insights and feedback provided by Robert Bartels, Jonathan Batten, Henk Berkman, Utpal Bhattacharya, Bidisha Chakrabarty, Ryan Davies, Marina Druz, Jonathan Feinstein, Michael Fleming, Doug Foster, Richard Gerlach, Robin Hanson, Doug Harris, Joel Hasbrouck, David Johnstone, Petko Kalev, Si Li, Pamela Moulton, Terrence Odean, Ryan Oprea, Michael Pagano, Charles Plott, Mike Prior, Maxwell Stevenson, Angelo Ranaldo, James Rydge, Tom Smith, Terry Walter, and Tracy Yue Wang.
I gratefully acknowledge research funding provided by: the Australian Government Department of Innovation, Industry, Science and Research; the Australian Research Council (ARC Linkage Project LP0455536); the Australian Stock Exchange; the Faculty of Economics and Business; and the Securities Industry Research Centre of Asia-Pacific (SIRCA). I also thank SIRCA and Reuters for providing data used in this thesis, and Kevin Cheng and Ian Friedman for their support in working with these data.
A special thank you goes to my family, friends and fellow research students. I am especially grateful to Vēsma for her wholehearted support and for enduring my neglect throughout my work on this thesis. Finally, I have dedicated this thesis to my parents. Besides being a source of constant encouragement, they are an inspiration to me.
Preface
Some of the work in this thesis has been presented as joint work. A version of Chapter 3 was presented as a working paper co-authored with Assoc. Prof. Carole Comerton-Forde at various academic conferences and seminar series, including the Financial Management Association Annual Meeting, the European Financial Management Association Annual Conference, the University of Sydney 2nd Annual Microstructure Meeting, the Financial Integrity Research Network (FIRN) Doctoral Workshop, the University of Technology Sydney, Macquarie University and the Stockholm School Of Economics (Riga) / Baltic International Centre for Economic Policy Studies.
A version of Chapter 4, with parts of Chapter 6, is forthcoming in the
Journal of Financial Intermediation, as an article co-authored with Assoc. Prof. Carole Comerton-Forde. This paper has also been presented at various academic conferences and seminar series, including the Financial Management Association Annual Conference, the European Financial Management Association Annual Conference, the Australasian Banking and Finance Conference, the Australian National University, the Ontario Securities Commission, Regulation Services/DeGroote Business School Lecture Series, the University of New South Wales, the University of Western Australia and Villanova University
A version of Chapter 5 was presented as a working paper co-authored with Assoc. Prof. Carole Comerton-Forde at various academic conferences and seminar series, including the Financial Management Association Annual Conference, the Asian Finance Association Annual Conference, the Australasian Banking and Finance Conference, the FINRISK 8th Swiss Doctoral Workshop in Finance, the University of New South Wales, the University of Tasmania and the University of Western Australia.
Table of Contents
Page Statement of originality ... ii Acknowledgements...iv Preface ...v Table of Contents...viList of Tables ...ix
List of Figures...x
Abbreviations...xi
Abstract... xii
Chapter 1 Introduction ...1
1.1 Background and motivation ...1
1.1.1 Closing price manipulation ...3
1.1.2 Why manipulation matters ...5
1.2 Purpose and contributions ...5
1.3 Structure of this thesis...7
Chapter 2 Literature review ...8
2.1 Definition and forms of market manipulation ...8
2.1.1 Legal interpretation of market manipulation ...9
2.1.2 Law and economics literature definitions...11
2.1.3 Forms of market manipulation ...12
2.2 Theoretical literature ...15
2.2.1 Information-based manipulation ...15
2.2.2 Trade-based manipulation ...16
2.3 Empirical literature...20
2.3.1 Indirect empirical evidence ...20
2.3.2 Empirical studies of known manipulation cases...22
2.3.3 Experimental studies ...24
2.4 Conclusions...25
Chapter 3 Prevalence and determinants of closing price manipulation ...27
3.1 Introduction...27
3.2 Empirical model of manipulation and detection...28
3.2.1 The model setup ...30
3.2.2 Estimation...33
3.3 Variables and model specifications...38
3.4 Data ...46
3.5 Results...50
3.5.1 The determinants of manipulation and detection...50
3.5.2 The frequency of manipulation and detection ...57
3.5.3 Robustness tests...61
3.6 Conclusions...64
Chapter 4 Trading characteristics around closing price manipulation cases...66
4.1 Introduction...66
4.2 Related literature ...67
4.3 Predicted effects of manipulation...69
4.4 Data ...71
4.5 Effects on trading characteristics ...74
4.5.1 Measurement of trading characteristics...74
4.5.2 Difference-in-differences estimates...78
4.5.3 Matched stock estimates...82
4.5.4 Discussion and robustness tests...84
4.6 Conclusions...85
Chapter 5 The effects of closing price manipulation on market quality ...87
5.1 Introduction...87
5.2 Experiment design and procedure ...90
5.3 Analysis...97
5.3.1 Effects on price accuracy...97
5.3.2 Effects on liquidity ...105
5.3.3 Manipulation strategy...110
5.3.4 Effects on ordinary traders’ behaviour ...114
5.3.5 Ability of market participants to recognise manipulation ...116
5.3.6 Robustness tests...118
5.4 Discussion and conclusions...118
Chapter 6 Detecting and measuring closing price manipulation...121
6.1 Introduction...121
6.2 Data ...123
6.3 Closing price manipulation index...123
6.3.1 Components...123
6.3.2 Functional form and coefficients...126
6.3.3 Issues in using the index...128
6.3.4 Validation and robustness testing...130
6.4 An instrument for detecting closing price manipulation ...136
6.4.2 Combined detection tool ...138
6.5 Conclusions...139
Chapter 7 Conclusions...141
7.1 Why are closing prices manipulated?...141
7.2 How are closing prices manipulated?...142
7.3 How often are closing prices manipulated?...143
7.4 What makes closing price manipulation and detection more likely? ...143
7.5 How does closing price manipulation affect markets?...144
7.6 Implications for economic efficiency and policy ...144
7.7 Avenues for future research ...146
References...148
Appendix A Alternative detection controlled estimation models ...157
A.1 Two-equation model of manipulation and detection ...157
A.2 Three-equation model of manipulation and detection with expectations simultaneity...158
Appendix B Details of prosecution cases...159
Case 1: Competitive Technologies Inc. et al. ...160
Case 2: RT Capital Management Inc. et al. ...162
Case 3: Spear, Leeds & Kellogg/ Baron Capital Inc. et al. ...163
Case 4: John Andrew Scott et al. ...165
Case 5: Douglas Christie...166
Case 6: Schultz Investment Advisors Inc...167
Case 7: Research Capital Corporation...168
Case 8: Luc St Pierre...169
Appendix C Formulae for day-end trading characteristics ...171
Appendix D Selected robustness tests ...174
Appendix E Experiment instructions an screen layout ...183
E.1 Instructions provided to participants...183
List of Tables
Page
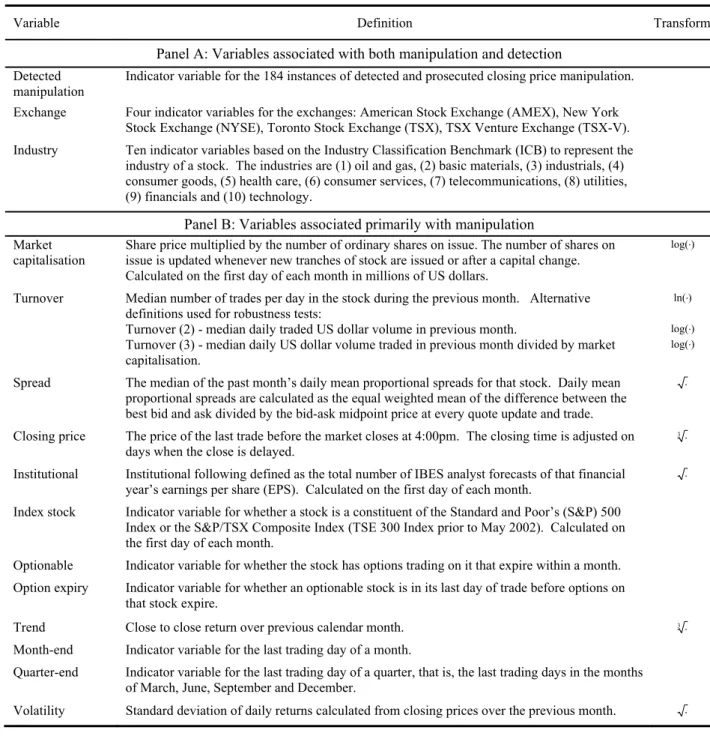
Table 3.1 Definitions of variables...39
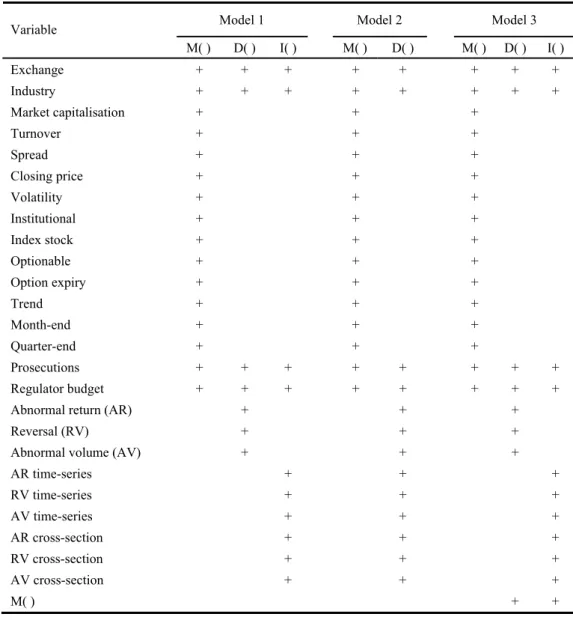
Table 3.2 Specification of models ...45
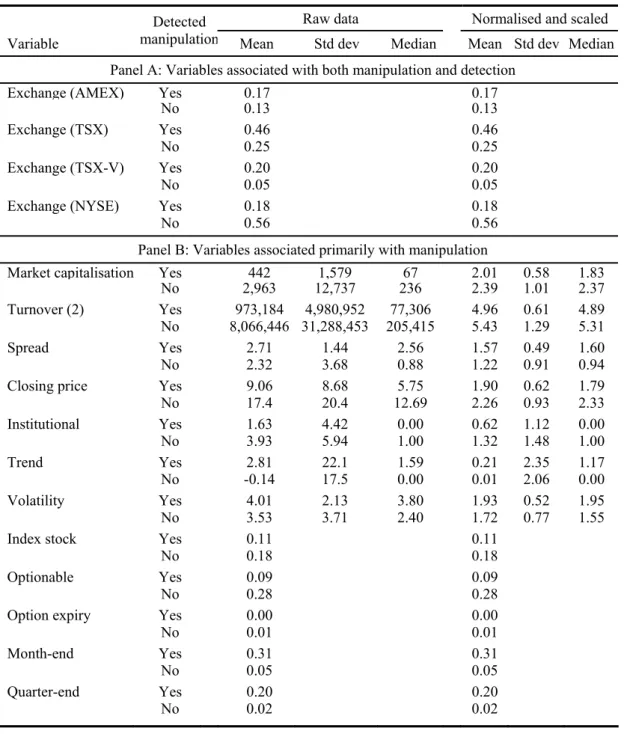
Table 3.3 Summary statistics ...49
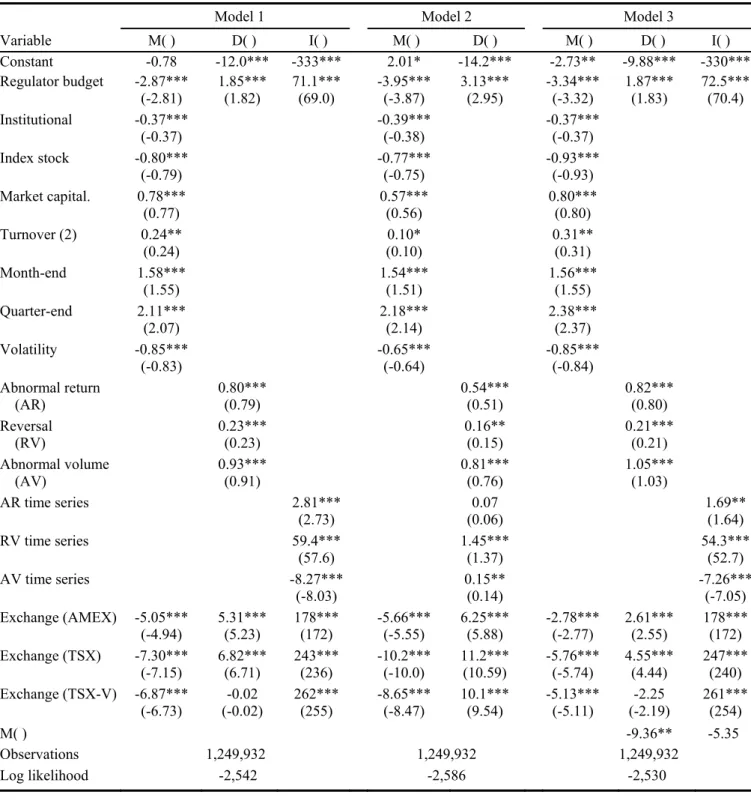
Table 3.4 Model estimates ...52
Table 3.5 Estimated frequency of manipulation and detection by exchange ...59
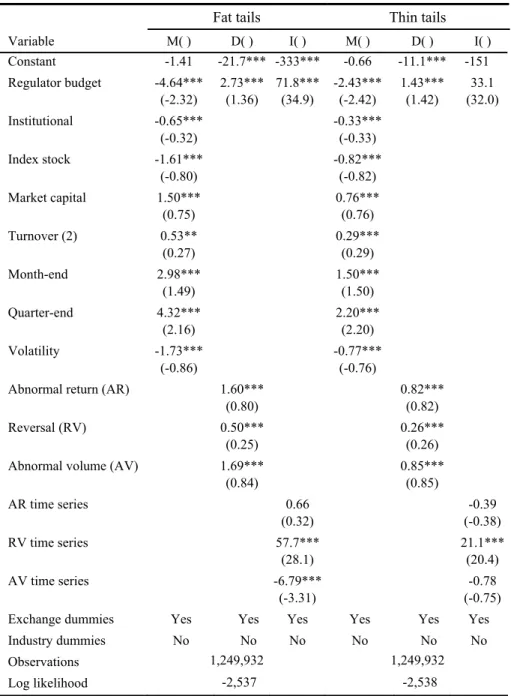
Table 3.6 Robustness tests ...62
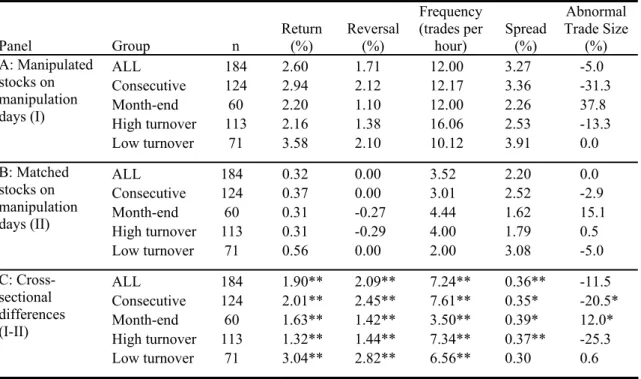
Table 4.1 Characteristics of manipulated stocks compared to all other stocks on the same market ...73
Table 4.2 Effects of manipulation on day-end trading characteristics using difference-in-differences...80
Table 4.3 Effects of manipulation on day-end trading characteristics using matched stocks ...83
Table 5.1 Summary of end of period trader payoffs by treatment ...94
Table 5.2 Asset values, clues and manipulator allocations ...96
Table 5.3 Effect of manipulation on end of period price accuracy ...100
Table 5.4 Effect of manipulation on price accuracy within a trading period ...104
Table 5.5 Effect of manipulation on liquidity...109
Table 5.6 Ability of traders to identify manipulation ...117
Table 6.1 Index coefficients from logistic regression...127
Table 6.2 Comparison of the manipulation index classification performance out of time and out of market ...133
Table 6.3 Marginal contribution of predictor variables to index classification accuracy ...134
Table A.1 Summary of manipulation cases ...160
Table D.1 Replication of Table 4.2 with means...175
Table D.2 Replication of Table 4.3 with means...176
Table D.3 Panel regression with manipulation dummy variable ...177
Table D.4 Replication of Table 4.2 with single day benchmark...178
Table D.5 Replication of Table 4.2 separately for each prosecution case ...179
List of Figures
Page
Figure 1.1 An example of closing price manipulation...3
Figure 2.1 Taxonomy of manipulation techniques ...12
Figure 3.1 Modified detection controlled estimation model ...33
Figure 4.1 Day-end trading in two instances of closing price manipulation...77
Figure 5.1 End of period prices by period ...98
Figure 5.2 Average absolute pricing errors within a trading period ...102
Figure 5.3 Evolution of liquidity variables ...106
Figure 5.4 Order types used by manipulators and ordinary traders ...111
Figure 5.5 Manipulator buying and selling activity within a trading period...113
Figure 6.1 Out of sample classification characteristics of the manipulation index...131
Figure 6.2 Day-end trade-by-trade returns...135
Abbreviations
AMEX American Stock Exchange
AMEX DRC AMEX Division of Regulation and Compliance
ASX Australian Stock Exchange (now the Australian Securities Exchange) AUROC Area under Receiver Operating Characteristics curve
DCE Detection controlled estimation ECU Experimental currency unit ETF Exchange traded fund EU European Union
IDA Investment Dealers Association (Canada)
IIROC Investment Industry Regulatory Organization of Canada (Canada) LOC Limit on close
MFDA Mutual Funds Dealers Association (Canada) MOC Market on close
NYSE New York Stock Exchange NYSE Reg NYSE Regulation Inc.
OSC Ontario Securities Commission (Canada) ROC Receiver Operating Characteristics RS Market Regulation Services Inc. (Canada) SEC Securities and Exchange Commission
SIRCA Securities Industry Research Centre of Asia-Pacific TSX Toronto Stock Exchange
TSX-V TSX Venture Exchange US United States of America
Abstract
Allegations of market manipulation abound in the popular press, particularly during the recent financial turmoil. However, many aspects of manipulation are poorly understood. The purpose of this thesis is to enhance our understanding of market manipulation by providing empirical evidence on the prevalence, effects and determinants of closing price manipulation.
The first issue examined in this thesis is the prevalence of closing price manipulation. This thesis uses a hand collected sample of prosecuted closing price manipulation cases from US and Canadian stock exchanges, and methods that explicitly model the incomplete and non-random detection of manipulation. The results suggest that approximately 1.1% of closing prices are manipulated. For every prosecuted closing price manipulation there are approximately 300 instances of manipulation that remain undetected or not prosecuted. Closing price manipulation is more prevalent on larger exchanges than smaller ones, but is detected at a higher rate on small exchanges.
Second, this thesis examines the effects of closing price manipulation. Using a sample of prosecution cases, this thesis finds that closing price manipulation is associated with large end returns, subsequent return reversals, increases in day-end spreads and increases in day-day-end trading activity. At the broader level of market quality, this thesis provides evidence from a laboratory experiment that closing price manipulation decreases both price accuracy and liquidity. Even the mere possibility of manipulation decreases liquidity and increases trading costs.
The third issue analysed in this thesis is the determinants of closing price manipulation and its detection. Estimating an empirical model of manipulation and detection, this thesis finds that the likelihood of closing price manipulation is increased by smaller regulatory budgets, greater information asymmetry, mid to low
levels of liquidity, month-end days and lower volatility. Manipulation is more likely to be detected when regulatory budgets are larger and when the manipulation causes abnormal trading characteristics. Further evidence from laboratory experiments suggests that regulation helps restore price accuracy by deterring some manipulation and making remaining manipulation less aggressive. These experiments also show that regulation has an insignificant effect on liquidity because participants in regulated markets still face relatively high uncertainty about the presence of manipulators.
This thesis also examines how closing price manipulation is conducted and how other market participants respond. It develops an index of closing price manipulation that can be used to study manipulation in markets or time periods in which prosecution data are not available. It also provides a tool for the detection of manipulation, which can be used by regulators in automated surveillance systems.
Finally, this thesis has implications for economic efficiency and policy. Closing price manipulation is significantly more prevalent than the number of prosecution cases suggests. Further, it harms both pricing accuracy and liquidity and therefore undermines economic efficiency. The prevalence of closing price manipulation can be reduced by increasing regulatory budgets, improving the accuracy of market surveillance systems by using the detection tools developed in this thesis, structuring markets such that participants are better able to identify manipulation, and implementing closing mechanisms that are difficult to manipulate. These actions would enhance market integrity and economic efficiency.
Chapter 1
Introduction
Among the plays which men perform in taking different parts in this magnificent world theatre, the greatest comedy is played at the Exchange. There, … the speculators excel in tricks, they do business and find excuses wherein hiding places, concealment of facts, quarrels, provocations, mockery, idle talk, violent desires, collusion, artful deception, betrayals, cheatings, and even tragic end are to be found
- Joseph de la Vega (1688), describing the Amsterdam Stock Exchange.
1.1 Background and motivation
Since the beginning of trading on organised exchanges, speculators have manipulated markets to profit at others’ expense. This is illustrated by Joseph de la Vega’s eloquent description of one of the earliest organised exchanges, in which he lists a variety of strategies used by speculators, many of which would today be labelled ‘market manipulation’. Numerous cases of manipulation exist in history, such as when the influential Rothschilds sold large amounts of stock to create the false impression that Napoleon had defeated Wellington, causing prices to crash and allowing them to repurchase the stock at depressed prices (Griffin, 1980). The magnitude of manipulation’s effects can be extraordinary; for example, the price of nearly bankrupt NEI Webworld Inc. shot up by 11,400% within a day in response to rumour mongering on the internet.1 Manipulation is not confined to small and illiquid
1 See “Stock pump-n-dump fraudsters settle suit, earn jail time”, by Brian Krebs, Newsbytes, 24
companies; for example, multibillion dollar Lucent Technologies was successfully manipulated (Leinweber and Madhavan, 2001). The amount of funds used in manipulation and scale of profits can be immense; for example, in 2004 Citigroup netted €18.2 million profit from manipulation that involved placing €12.9 billion worth of sell orders in 200 different government bonds within 18 seconds and later repurchasing them.2 Manipulation is not confined to sophisticated market
participants; for example, Jonathan Lebed, a teenager from New Jersey successfully manipulated stocks 11 times by posting messages on Yahoo Finance message boards and made profits of $800,000 (Lewis, 2001). Nor is manipulation confined to individual securities; for example, in 1996 Nomura Int. Plc. manipulated an entire market index (Australian All Ordinaries) by selling a $600 million basket of stocks (more than the average daily market turnover) within minutes of the close of trading.3 Allegations of manipulation abound in the popular press. During bull markets, media attention tends to be focussed on manipulation that inflates stock prices. However, during the recent market turmoil manipulation has been widely blamed for contributing to sharp price declines and collapses of companies. Regulators such as the US Securities and Exchange Commission (SEC) have introduced a number of new rules and implemented temporary short selling bans, citing combating manipulation as an underlying reason.
Despite the significant interest in manipulation, many aspects of manipulation are not well understood. This thesis enhances our understanding of manipulation by providing evidence on the prevalence, effects and determinants of a particular type of manipulation, closing price manipulation.
2 See “The day Dr Evil wounded a financial giant”, by Avinash Persaud and John Plender, Financial
Times, 23 August 2006.
3 See “The financial monster that tried to eat Australia”, by Ben Hill, Sydney Morning Herald, 11
1.1.1 Closing price manipulation
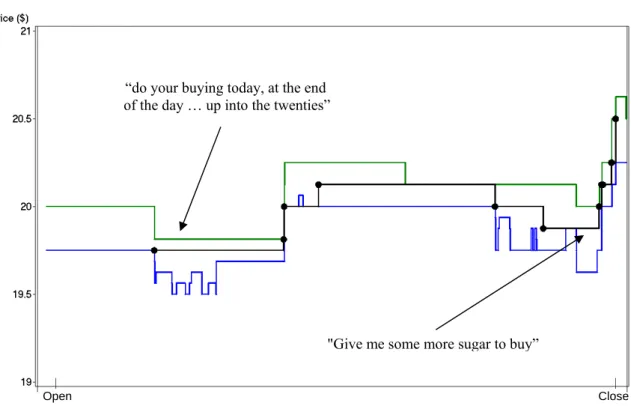
Closing price manipulation is the illegal act of intentionally forcing a closing price to an artificial level. It is usually conducted by aggressively buying or selling stock at the end of a trading day. Figure 1.1 illustrates a typical example of closing price manipulation obtained from a prosecution case. At the beginning of the day the stock is trading below $20 and the manipulator instructs his broker, “do your buying today, at the end of the day … up into the twenties” (recorded telephone conversation, see Case 3 in Appendix B for further details). Later that day, the broker requests from the manipulator, “give me some more sugar to buy”, and shortly before the close he executes a series of trades in quick succession raising the price and setting an inflated closing price.
“do your buying today, at the end of the day … up into the twenties”
"Give me some more sugar to buy”
| |
Open Close
Figure 1.1 An example of closing price manipulation
This figure plots the best bid (bottom line), best ask (top line), last trade price (middle line), and trades (dots) for Southern Union Company (SUG) on the New York Stock Exchange during 25 October 1999. The quoted text is from telephone conversations between the manipulator and his broker recorded by the US Securities and Exchange Commission (SEC).
This thesis’s focus on closing price manipulation is driven by the importance of closing prices. A large number of contracts are based specifically on closing prices, creating incentives for many different parties to manipulate them. For example, mutual fund net asset values (NAV) and fund performance are often calculated using closing prices. The performance of a fund determines its ranking relative to competitors and is also commonly used to determine fund manager remuneration. Given these incentives, it comes as little surprise that some fund managers manipulate closing prices.4 Closing prices have also been manipulated in order to profit from positions in derivatives on the underlying stock5 and by brokers attempting to alter their customers’ inference of their execution ability.6 Closing prices have been manipulated during pricing periods for seasoned equity issues and takeovers, to maintain a stock’s listing on an exchange with minimum price requirements, to avoid margin calls, and on stock index rebalancing days for a stock to gain inclusion in an index.
Recognising the problems closing price manipulation can create, numerous stock exchanges have introduced closing call auctions to make manipulation more difficult. Several contracts have been redesigned to be more robust to manipulation, for example, by using volume weighted average prices (VWAP) in place of closing prices. Despite these measures, closing price manipulation remains a significant issue because many exchanges still utilise simple closing mechanisms, cases of closing price manipulation are still found in markets with closing call auctions, and many contracts today still provide incentives to manipulate closing prices.
4 This type of manipulation is commonly conducted on the last day of a reporting period such as a
month-end or quarter-end. See Carhart et al. (2002) and Bernhardt and Davies (2005). This practice is also known as ‘marking the close’, ‘painting the tape’, ‘high closing’, ‘marking up’ or ‘portfolio pumping’.
5 See, for example, Kumar and Seppi (1992) and Ni et al. (2005). 6 See, for example, Hillion and Suominen (2004).
1.1.2 Why manipulation matters
Most market manipulation is detrimental to stock markets and their participants. Manipulation can discourage participation and cause investors to trade in alternative markets, thereby decreasing liquidity and increasing trading costs. Consequently, manipulation can lead to an increase in the cost of capital, making firms reluctant to list their shares in markets known for manipulation. Manipulation impairs price discovery through reduced order flow and distorts prices from their natural levels. This reduces market efficiency and causes deadweight economic losses due to distorted resource allocation and wealth redistribution (Pirrong, 1995). The price distortions caused by closing price manipulation are particularly harmful because of the widespread use of closing prices (Kahan, 1992). For these reasons, understanding closing price manipulation is of great importance to academics, exchanges and regulators.
1.2 Purpose and contributions
The purpose of this thesis is to enhance our understanding of market manipulation. Thel (1994, p. 287) points out “[w]e do not know how often prices are manipulated, how much harm manipulation does or how existing manipulation rules influence behavior.” The main contribution of this thesis is providing evidence on precisely these issues - the prevalence, effects and determinants - in the specific context of closing price manipulation.
The first issue is the prevalence of closing price manipulation. This thesis estimates the frequency of closing price manipulation on US and Canadian stock exchanges. The estimates are obtained using a hand collected sample of prosecuted closing price manipulation cases and methods that explicitly model the incomplete and non-random detection of manipulation. The results suggest that approximately 1.1% of closing prices are manipulated. For every prosecuted closing price manipulation there are approximately 300 instances of manipulation that remain
undetected or not prosecuted. Closing price manipulation is more prevalent on larger exchanges than smaller ones, but is detected at a higher rate on small exchanges.
The second issue is the effects of closing price manipulation. Using a sample of prosecution cases, this thesis finds that closing price manipulation is associated with large day-end returns, subsequent return reversals, increases in day-end spreads and increases in day-end trading activity. At the broader level of market quality, this thesis provides evidence from a laboratory experiment that closing price manipulation decreases both price accuracy and liquidity. Even the mere possibility of manipulation decreases liquidity and increases trading costs. Following the arguments of Kyle and Viswanathan (2008), closing price manipulation therefore undermines economic efficiency and should be prohibited.
The third issue is the determinants of closing price manipulation and its detection. Using a sample of prosecuted manipulation cases, this thesis finds that the likelihood of closing price manipulation is increased by smaller regulatory budgets, greater information asymmetry, mid to low levels of liquidity, month-end days and lower volatility. Manipulation is more likely to be detected when regulatory budgets are larger and when the manipulation causes abnormal trading characteristics. Further evidence from a laboratory experiment suggests that regulation helps restore price accuracy by deterring some manipulation and making remaining manipulation less aggressive. These experiments also show that regulation has an insignificant effect on liquidity because participants in regulated markets still face relatively high uncertainty about the presence of manipulators.
This thesis makes some further contributions. It examines how closing price manipulation is conducted and how other market participants respond. It develops an index of closing price manipulation that can be used to study manipulation in markets or time periods in which prosecution data are not available. It also provides a tool for the detection of manipulation, which can be used by regulators in automated surveillance systems.
1.3 Structure of this thesis
The next chapter discusses what constitutes market manipulation and reviews the relevant literature. Chapter 3 analyses the determinants of closing price manipulation and its detection, and estimates its prevalence. It describes the hand collected sample of prosecution cases that is also used in Chapters 4 and 6. Chapter 4 examines the trading characteristics (returns, return reversals, trading frequency, spreads and trade size) around cases of closing price manipulation. Chapter 5 analyses the effects of closing price manipulation on market quality, using a laboratory experiment. Chapter 6 constructs an index of closing price manipulation and a closely related tool for the detection of manipulation, drawing on the findings of earlier chapters. Chapter 7 concludes.
Chapter 2
Literature review
This chapter reviews the literature on market manipulation. It begins by summarising the debate on what constitutes market manipulation. The intent is to provide context to the trading strategies studied in the literature and illustrate how closing price manipulation, the focus of this thesis, fits among the diverse range of manipulation strategies. Next, this chapter reviews the theoretical work on market manipulation, followed by the less numerous and more recent empirical and experimental studies. This chapter finishes with a summary of the conclusions that can be drawn from the literature.
2.1 Definition and forms of market manipulation
There is no generally accepted definition of market manipulation. This may seem surprising given the long history of manipulation in world financial markets7 and the fact that more than three quarters of a century has passed since the inception of US federal securities regulation against market manipulation.8 Legal definitions
7 For example, one of the most famous of the early manipulation prosecutions during the Napoleonic
wars involved a group of manipulators spreading false rumours about the death of Napoleon and that the allies had entered Paris. The Court of King’s Bench in England ruled that it was an offence to conspire to raise the price of Government securities by false rumours with the intent of injuring purchasers (Rex v De Berenger in Maule and Selwyn’s reports 67 (1814), see Baxt et al. (1996)).
8 A common view is that regulation against market manipulation in the US began in the 1930s with the
Securities Act of 1933, the Securities Exchange Act of 1934, and the creation of the Securities and Exchange Commission (SEC) in 1934, largely in response to the massive losses suffered by the public in the Great Depression. However, Berle (1938) points out that while the reforms of the 1930s contributed significantly to bringing legal action against market manipulators, the forms of
are often intentionally not explicit, and much of the finance and economics literature uses the term market manipulation in an imprecise manner. This situation has led to a longstanding debate and controversy over the definition of market manipulation. This section reviews the legal interpretation of market manipulation, the definitions used in academic studies and the range of practices commonly regarded as market manipulation.
2.1.1 Legal interpretation of market manipulation
Legal definitions vary across jurisdictions and in many cases are not explicit about what constitutes market manipulation. For example, the Corporations Law in Australia, the Securities Exchange Act 1934 in the US and the Market Abuse Directive in the European Union (EU) prohibit market manipulation and contain various provisions to achieve this purpose, but none of these laws attempt to precisely define manipulation (Goldwasser, 1999). The task of defining manipulation is largely left to the courts on a case-by-case basis. According to US statutory law it is unlawful “to use or employ, in connection with the purchase or sale of any security … any manipulative or deceptive device or contrivance”.9 In Australia, statutory law prohibits “transactions that have or are likely to have; the effect of … creating an artificial price”.10 The EU has recently adopted a principles-based approach to describing prohibited practices. EU statutory law stipulates, “market manipulation shall mean transactions or orders to trade which give, or are likely to give, false or misleading signals as to the supply of, demand for or price of financial instruments, or which secure … the price of one or several financial instruments at an abnormal or
manipulation banned by the Acts of 1933-1934 were already effectively outlawed by the courts through common law.
9 Section 10(b), Securities Exchange Act 1934. For a detailed discussion see Thel (1990) and
Goldwasser (1999).
artificial level”.11 A definition that captures the essence of the relevant statutory law in several jurisdictions, but by itself is neither precise nor objective, is provided by the Australian Stock Exchange (ASX):
“Market manipulation describes a deliberate attempt to interfere with the free and fair operation of the market and create artificial, false or misleading appearances with respect to the price of, or market for, a stock.”12
Given that statutory law does not provide a precise definition of manipulation, one must turn to case law to understand what is viewed as manipulation by courts. US case law has established a four part test for manipulation involving ability, intent to deceive, causation and artificiality (Johnson, 1981). Across a number of jurisdictions, arguably the two most important elements, and often the most difficult to prove, are artificiality and intent. Artificiality can be with respect to trading activity (e.g., creating the appearance of more trading than what would naturally take place), or price (e.g., altering the price by raising or depressing it). Intent distinguishes manipulative from non-manipulative trading. Because intent can rarely be determined with certainty, this element causes significant difficulties in identifying manipulation. Proper, non-manipulative market participation can cause an increase in market activity or alteration of the market price. Manipulative trading can have exactly the same effects on the market, but is distinguished by the fact that it is undertaken for an impermissible purpose (Goldwasser, 1999). Broadly speaking, case law establishes that market manipulation involves actions or trades undertaken with the intent of forcing a price to an artificial level, inducing other people to trade, or deceiving others.
11 Section 1(2)(a) Market Abuse Directive 2003.
2.1.2 Law and economics literature definitions
The law and economics literature contains considerable debate about how to define manipulation. In a sharp departure from mainstream legal thought, Fischel and Ross (1991) argue that market manipulation is too vague a concept to form the basis for criminal charges. They point out that there is no objective definition of manipulation and suggest that manipulation could only be defined as dishonest intent to move stock prices. Fischel and Ross argue that irrespective of intent, trades should not be prohibited as manipulative; but fictitious trades (e.g., trades in which the buyer and seller is the same person) and spreading false information should be classified as fraud. Their reasoning is that: (i) purely trade based manipulation is unlikely to be successful; and (ii) rules that prohibit manipulation deter some legitimate trading.
Thel (1994) delivers a strong rebuttal. Based on evidence in the economics literature Thel states that manipulation is easier to accomplish than Fischel and Ross claim. Thel argues that manipulators can sometimes control prices with trades and in doing so profit either from pre-existing contracts that are contingent on prices, or by inducing other market participants to trade at manipulated prices.
Thel uses the term manipulation to mean trading undertaken with the intent of increasing or decreasing the reported price of a security. Jarrow (1992) uses the term market manipulation in the context of large uninformed traders to mean a trading strategy that generates positive real wealth with zero risk. Cherian and Jarrow (1995) define manipulation as trading by an individual (or group of individuals) in a manner such that the share price is influenced to his advantage. More recently, Kyle and Viswanathan (2008) propose that trading strategies should only be classified as illegal price manipulation if they undermine economic efficiency both by decreasing price accuracy and reducing liquidity. Unless both of these conditions are satisfied, the trading strategy is not unambiguously socially harmful and therefore, according to Kyle and Viswanathan, should not be prohibited.
2.1.3 Forms of market manipulation
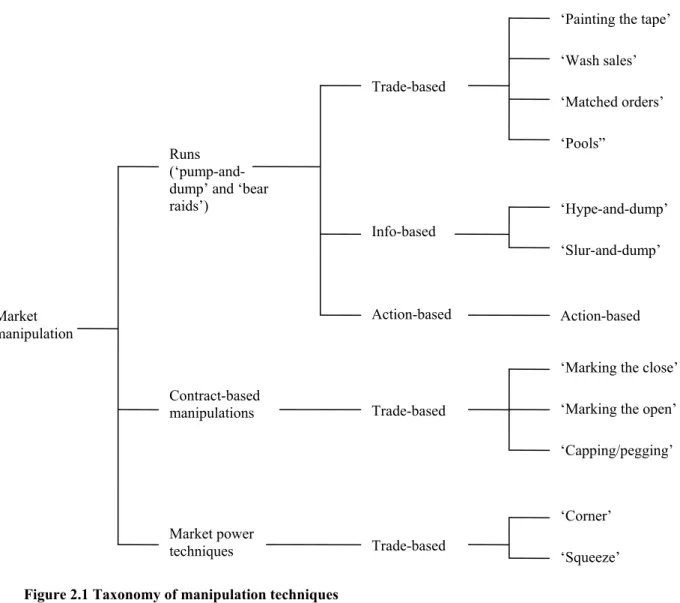
The generic term ‘market manipulation’ encompasses many distinct and widely varied strategies. To illustrate some of the relations between strategies, this overview constructs a simple taxonomy of the most common types of market manipulation (Figure 2.1). At the broadest level, manipulation can be divided into runs, contract-based manipulations and market power techniques. Within these groups, manipulation can be further broken down into trade-based, information-based and action-based forms. This overview first describes the two levels on which manipulation can be grouped and then defines the individual techniques.
Market manipulation Trade-based Info-based Action-based Trade-based Trade-based Runs (‘pump-and-dump’ and ‘bear raids’)
Contract-based manipulations
Market power techniques
‘Painting the tape’ ‘Wash sales’ ‘Matched orders’ ‘Pools” ‘Hype-and-dump’ ‘Slur-and-dump’ Action-based ‘Marking the close’ ‘Marking the open’ ‘Capping/pegging’
‘Corner’ ‘Squeeze’
In a run the manipulator takes either a long or a short position in a stock, inflates or deflates the stock’s price while attracting liquidity to the stock, and finally reverses his position at the inflated or deflated price. Runs that inflate a stock’s price are often referred to as ‘pump-and-dump’ manipulation. The stock ‘pumping’ can take anywhere from a matter of hours to several years and make use of techniques such as rumour spreading, wash sales and pooling by several manipulators. ‘Bear raids’ are a form of run in which the manipulator short sells a stock, manipulates its price downwards by inducing others to sell, and covers his position at a depressed price. A common feature of runs is that the manipulator profits directly from the manipulated market by exploiting investors that buy at inflated prices or sell at depressed prices.
In contract-based manipulation, on the other hand, the manipulator profits from a contract or market that is external to the manipulated market. For example, a manipulator might take a position in a derivatives contract then manipulate the underlying stock price to profit on the derivatives position. An important difference is that such manipulation does not require the manipulator to induce others to trade at manipulated prices and therefore tends to be more mechanical by nature.
The third broad group of manipulation techniques involves the manipulator exploiting market power by, for example, taking a controlling position in the supply of a security. Like contract-based manipulation, market power techniques are more mechanical in nature than runs. However, they are similar to runs in that the manipulator profits by exploiting participants of the manipulated market.
Within the three broad types, manipulation techniques can be further broken down using Allen and Gale’s (1992) definitions of trade-based, information-based and action-based manipulation. Trade-based manipulation involves influencing the price of a stock through trading. In information-based manipulation a manipulator releases false information or rumours about a company in order to inflate or depress its price. Action-based manipulation involves taking actions to affect the value or perceived
value of a firm. For example, a company director may shut down a factory to depress the share price.
Each of the three forms of manipulation consists of a wide variety of techniques, particularly trade based manipulation (see Cumming and Johan (2008) for a list of the techniques targeted by market surveillance authorities). Engaging in a series of transactions that are reported on a public display facility which give the impression of trading activity or price movements is known as ‘painting the tape’. This technique often involves ‘wash sales’, i.e., improper transactions in which the buyer and seller is the same person such that there is no genuine change in ownership, or ‘matched orders’, i.e., pairs of buy and sell orders placed by different but colluding parties at the same time for the same price and volume. ‘Pools’ are when a group of manipulators trade shares back and forth among themselves to influence prices and create the appearance of trading volume. Dissemination of false information or rumours via the media, internet or other means is commonly known as ‘hype-and-dump’ when the intent is to inflate a stock price, and ‘slur-and-‘hype-and-dump’ when the intent is to depress the stock price.
‘Marking the close’ (also known as closing price manipulation and ‘high closing’) involves buying or selling securities at or shortly before the close in an effort to alter the closing price. ‘Marking the open’ is similar, but involves influencing the opening price rather than closing price. Closing and opening price manipulation are common techniques for contractual manipulation because often contacts are based on closing prices (and less often opening prices), but are also used in conjunction with other techniques to facilitate runs. ‘Pegging’ and ‘capping’ refer to placing orders that effectively prevent a price from moving up or down. This is often done to ensure a derivatives contract expires in or out of the money. ‘Corners’ and ‘squeezes’ are techniques in which the manipulator secures a controlling position in the supply of an asset and/or a derivative contract. The manipulator then uses this position to manipulate the price by exploiting investors that need the underlying asset to close out short positions.
To summarise this section, a definition of market manipulation that captures the key elements of statutory and case law, as well as the main arguments in the economics and law literature, is interference with the free and fair operation of a market, conducted with the intent to create a misleading price or a misleading trading activity. Broadly speaking, market manipulation can be divided into runs, contract based manipulations and manipulation using market power, each of which can be conducted with a range of action-, information- and trade-based techniques. Closing price manipulation is typically a trade-based form of contractual manipulation, although it is also sometimes used in conjunction with other techniques to facilitate a run.
2.2 Theoretical literature
The theoretical market manipulation literature provides insights about the conditions under which manipulation is possible and profitable. The literature, which spans the past 20 years, is fairly extensive, particularly regarding trade-based manipulation, and to a lesser extent information-based techniques. Although action-based manipulation is not explicitly studied in the literature, it can often be viewed as a type of information-based strategy because the manipulator’s actions create a false signal similar to false information. Consequently, many of the findings about information-based manipulation are relevant for action-based manipulation.
2.2.1 Information-based manipulation
Vila (1989) uses game theory to model a simple scenario in which a manipulator short sells a stock, releases false and damaging information about the stock and then covers his position at the depressed price. Bagnoli and Lipman (1996) analyse a model in which a manipulator announces a false takeover bid to drive up the price of a stock. The profitability of both strategies hinges on the credibility of the information released by the manipulator. In repetitions of such games, if market
participants are able to deduce that false information originated from a manipulator, the manipulator will quickly be discredited and the manipulation strategy will cease to be profitable.
To overcome the problem of credibility in repeated games, Benabou and Laroque (1992) and Van Bommel (2003) model the use of imprecise information to influence stock prices. In Benabou and Laroque (1992), noise in private information restricts the ability of traders to verify the truthfulness of a piece of information. Consequently traders, such as company insiders, journalists or stock analysts, can manipulate stock prices over a long period of time without losing credibility by mixing truth and lies in the information they release. Van Bommel (2003) uses a Kyle (1985) framework to model informed investors that manipulate prices by spreading imprecise rumours. In equilibrium, rumours are informative and therefore rational profit maximising agents trade on them. Because the rumours are imprecise, prices occasionally overshoot. This allows the informed rumourmonger to profit not only from trading on their information, but also from trading against overshot prices. Eren and Ozsoylev (2006) use a similar model to Van Bommel (2003) and find that ‘hype-and-dump’ manipulation increases market depth and trading volume, but decreases market efficiency.
2.2.2 Trade-based manipulation
Early theoretical trade-based manipulation literature establishes very general conditions under which pure trade-based manipulation in a single market (e.g., a series of buys followed by a series of sells) is and is not profitable. Fischel and Ross (1992), among others, argue that trade based manipulation is not possible in an efficient market. Jarrow (1992), Cherian and Kuriyan (1995) and Cherian and Jarrow (1995) build on the model of Hart (1977) and derive conditions under which trade-based manipulation is not possible. In Cherian and Kuriyan’s model manipulation is not possible with rational agents when price responses are symmetric. Jarrow demonstrates that a sufficient condition to exclude market manipulation strategies is
that the price response function depends only on a trader’s aggregate stock holdings and not on his past sequence of trades, in other words, when prices do not exhibit ‘momentum’. Huberman and Stanzl (2004) demonstrate that uninformed trading strategies that generate infinite expected profits are ruled out when price update functions, i.e., the permanent effect of trade size on future prices, are time independent and linear.
Many theoretical studies seek to prove that trade-based manipulation is possible in variations of the seminal models of Kyle (1985) and Glosten and Milgrom (1985). Allen and Gorton (1992) argue that the natural asymmetry between liquidity purchases and liquidity sales gives rise to profitable trade-based manipulation. If liquidity motivated sales are more likely than liquidity motivated purchases, buy orders are more informed on average and therefore have a larger effect on prices. In a Glosten and Milgrom (1985) model, this asymmetry allows an uninformed manipulator to generate a profit by executing a series of buys to bid the price up and then sell the stock causing a relatively smaller decrease in price. Allen and Gale (1992) similarly use a Glosten and Milgrom (1985) framework, but in their model an uninformed manipulator mimics an informed trader with positive information about the stock. The uninformed trader’s manipulation is profitable under certain restrictions on the strategy of the informed trader. Of critical importance to the success of such a strategy is information asymmetry. Investors are uncertain whether a large trader who buys the stock does so because he knows it is undervalued or because he intends to manipulate the price. Aggarwal and Wu (2006) extend this model and provide the insight that although information seekers (or arbitrageurs) generally make markets more efficient, when manipulation is possible more information seekers imply greater competition for shares, making it easier for an uninformed manipulator to enter the market and harm market efficiency.
Unlike the previous studies that examine uninformed manipulators, Chakraborty and Yilmaz (2004a, 2004b) demonstrate that in Glosten and Milgrom (1985) and Kyle (1985) models, informed traders also benefit from manipulating the
market. When the existence of an informed trader is uncertain and there is a large number of trading periods before all private information is revealed, long-lived informed traders will manipulate the market in every equilibrium by initially trading in the opposite direction to their information. This strategy results in short-term losses for the informed traders, however, the increased noise in the trading process allows them to retain their informational advantage for longer and extract more profit from their information. When there are many competitive rational traders who hold coarser information than the insider but finer information than the market maker, the manipulator has added incentive to manipulate because the competitive rational traders follow the insiders trades in equilibrium (Chakraborty and Yilmaz, 2008).
A number of studies model how specific securities (e.g., derivatives), events (e.g., seasoned equity offerings), or market design features (e.g., trade reporting requirements) give rise to profitable trade-based manipulation. Jarrow (1994) provides evidence of manipulation strategies that arise from derivative securities. In Gerard and Nanda (1993) strategic informed traders short sell a stock just prior to a seasoned equity offering to place downward pressure on the price. The manipulators then more than cover their position by purchasing stocks in the offering at a discount price and finally liquidate their positions at a profit when the stock price is eventually restored to its fair value. In Fishman and Hagerty (1995) a manipulator takes advantage of the Securities Exchange Act (1934) mandatory disclosure rule for large trades. The manipulator declares large buys, thereby forcing prices up, and then sells the position anonymously in a series of small trades. John and Narayanan (1997) and Huddart et al. (2001) also examine the effect of mandatory disclosure laws on the insider’s incentive to manipulate. Kyle (1984), Vila (1987) and Allen et al. (2006) model corners and squeezes in which manipulators control prices by obtaining a large fraction of the supply. Pirrong (1993) shows that squeezes hinder price discovery and create deadweight losses. In Vila (1989) and Bagnoli and Lipman (1996) a manipulator trades to give the impression of a takeover bid, misleading the market and allowing the manipulator to profit by selling at an inflated price.
Theory suggests that another mechanism manipulators can exploit to their advantage is the feedback effect from financial markets to the real value of a firm. This occurs when directors use their company’s stock price as a signal in making decisions about the company’s investment. In Goldstein and Geumbel’s (2008) model manipulators aggressively short sell shares to depress share prices, thereby negatively influencing companies’ investment decisions, harming fundamentals and allowing the short sellers to cover their positions at depressed prices. Khanna and Sonti (2004) demonstrate that feedback effects from stock prices to fundamental values can also be exploited in the other direction. In their model long-term shareholders manipulate prices upwards to encourage value creating investment. These studies illustrate that manipulation can reduce economic efficiency by distorting resource allocation.
In contrast to much of the theoretical literature, Hanson and Oprea (2009) do not seek to demonstrate the possibility or profitability of manipulation, but rather they examine the effects of manipulators on price accuracy. They find that in a Kyle (1985) model adapted to the case of a thin prediction market a manipulator with an exogenous preference for manipulation has the somewhat counter-intuitive ex-ante effect of increasing price accuracy. This effect arises because in the presence of a manipulator, the profitability of informed trading is higher and consequently more traders exert costly effort to become informed.
A few studies specifically analyse closing price manipulation. Kumar and Seppi (1992) use a Kyle (1985) framework to model a manipulator that takes a substantial long position in the futures market and then aggressively bids up the spot price before the close to profit from a more favourable futures settlement price. In Hillion and Suominen (2004) brokers manipulate closing prices to alter customers’ perceptions of their execution quality. Their model demonstrates that closing call auctions reduce manipulation and enhance price efficiency. A recent model of a mutual fund manager’s investment decision (Bernhardt and Davies, 2009) suggests
that fund managers have incentives to use short-term price impacts to manipulate closing prices at the ends of reporting periods.
2.3 Empirical literature
The theoretical literature is valuable, particularly in: (i) providing insights about the conditions under which manipulation is possible; and (ii) identifying circumstances in which profitable manipulation opportunities may exist even if no such cases have yet been reported. However, many manipulation strategies are too complicated to be modelled theoretically and the assumptions and simplifications made in order for theoretical models to be tractable lead to questions about the validity of their results in real markets. For these reasons empirical research is crucial to understanding market manipulation. Compared to the theoretical literature, empirical studies are fewer and more recent. This is largely due to the difficulties in obtaining data. This section reviews studies that provide circumstantial or indirect evidence on manipulation, followed by studies of known manipulation cases and finally, the small number of experimental studies.
2.3.1 Indirect empirical evidence
Early empirical asset pricing and market microstructure literature identifies various abnormalities in closing prices, but does not link the abnormalities to market manipulation.13 More recently, however, several studies attribute seasonal patterns and anomalies in day-end trading to closing price manipulation. Felixson and Pelli (1999) examine whether closing prices are manipulated in the Finnish stock market using regression analysis. Although their results are consistent with the hypothesis that closing prices are manipulated, they concede that further research is required to be conclusive. Carhart et al. (2002) find more conclusively that in US equities
13 See Keim (1983), Ariel (1987) and Ritter (1988) on seasonal patterns and Wood et al. (1985) and
markets price inflation is localised in the last half hour before the close and that it is more intense on quarter-end days. They report that 80% of funds beat the S&P 500 Index on the last trading day of the year, but only 37% do so on the first trading day of a new year. They attribute this phenomenon to manipulation by fund managers. Similarly, Hillion and Suominen (2004) find on the Paris Bourse that significant rises in volatility, volume and bid-ask spreads occurs mainly in the last minute of trading and they attribute this to manipulation. Akyol and Michayluk (2009) make use of the Istanbul Stock Exchange’s design involving two trading sessions per day to isolate end of period effects from end of day effects. They report evidence of closing price manipulation.
Empirical studies that analyse underlying stock prices around options expiration generally find that effects of manipulation can be found in the last hour before options expire and that the price effect is reversed in the first half hour of trading after expiration (Stoll and Whaley, 1987; Chamberlain et al., 1989; Stoll and Whaley, 1991). Ni et al. (2005) find evidence that on option expiration dates the closing prices of stocks with listed options cluster at option strike prices. They attribute this finding to closing price manipulation. McDonald and Michayluk (2003) examine whether manipulators exploit the trading halt mechanism on the Paris Bourse, where trading is halted in a stock when an order is submitted outside the daily price limits. They document suspicious trading characteristics around some trading halts, consistent with manipulators submitting trade-ending orders to secure the most recent trade price as the closing price. Onayev and Zdorovtsov (2008) find patterns of abnormal returns around the reconstitution of the Russell 3000 index. They suggest the patterns of returns are caused by closing price manipulation that is intended to influence the index reconstitution.
Two recent studies find evidence of manipulation by examining the trading records of likely manipulators, rather than market prices. Khwaja and Mian (2005) find evidence of ‘pump-and-dump’ market manipulation by brokers in Pakistan’s main stock exchange. Brokers earn at least 8% higher returns on their own trades and
neither market timing nor liquidity provision offer sufficient explanations for this result. They conclude that traders in developing markets resist stronger regulation to maintain high rents, suggesting poor regulatory systems hinder market development. Gallagher et al. (2009) support the earlier findings of Carhart et al. (2002) that some fund managers manipulate closing prices to influence their fund’s reported performance. Gallagher et al. find that on the last day of the quarter, fund managers tend to purchase illiquid stocks in which they already hold overweight positions. Unlike in Carhart et al. (2002), however, Gallagher et al. (2009) find that poor performing managers are more likely to manipulate prices.
A limitation of studies that are based on indirect evidence is that usually there are alternative explanations for their results and it is virtually impossible to eliminate all alternative explanations. Despite this limitation, they provide some indication of the magnitude of price distortions caused by manipulation (in the order of 0.5% to 2% in Carhart et al. (2002)) and the scale of profits earned by a manipulator (in an emerging market, 50% to 90% higher annual returns than the average investor (Khwaja and Mian, 2005)). These studies support theoretical models (e.g., stock price manipulation related to derivatives) and identify motivations for manipulation not studied in the theoretical literature (e.g., around index reconstitutions).
2.3.2 Empirical studies of known manipulation cases
Studies of known manipulation cases are relatively few and in several instances resemble case studies due to the unavailability of larger and more representative datasets. A recent and significant study in this area due to its relatively large sample of cases is Aggarwal and Wu (2006). Aggarwal and Wu analyse ‘pump-and-dump’ manipulation cases obtained from The US Securities and Exchange Commission (SEC) litigation releases. They identify 142 cases of manipulation, of which they are able to obtain data on 51 manipulated stocks during the period 1990-2001. The minimum length of a manipulation periods is two days, the median is 202 days and the maximum is 1,373 days, highlighting the variation in the nature of
pump-and-dump manipulation. They find that in their sample of prosecution cases stocks generally experience a price increase during the manipulation period, a subsequent decrease during the post-manipulation period, and increased volatility. Their sample of cases is more concentrated in illiquid stocks and most of the manipulation is conducted by informed insiders such as management, substantial shareholders, market-makers or brokers. Aggarwal and Wu (2006), however, do not address the sample selection bias arising from incomplete detection. This is discussed further in Chapter 3.
A widely stated reason for the introduction of closing call auctions on stock exchanges is to minimise the ability for the closing price to be manipulated. Despite this, Comerton-Forde and Rydge (2006) identify several cases of closing price manipulation in exchanges with closing call auctions. In their sample of 25 closing auction manipulations from six developed markets, manipulators exhibit similar behaviour across markets in that they tend to submit large, unrepresentative orders in the final seconds of the auction. Their analysis indicates that the design of the closing auction algorithm influences how easily the closing price can be manipulated. Some algorithm designs are more effective than others in reducing the impact of manipulation.
A small number of studies examine corners, squeezes, the stock pools of the 1920s. Although the widespread manipulation through stock pools before the crash of 1929 is vividly documented in Galbraith (1972) and one of the main reasons for the introduction of the US federal securities legislation in the 1930s, Mahoney (1999) and Jiang et al. (2005) find little evidence of manipulation in the alleged stock pools of the 1920s. They conclude that these pools did not harm investors. Their sample consists of 55 stock pools identified from a US Senate report. Allen et al. (2006) examine several well-known stock and commodity market corners which occurred between 1863 and 1980. They find that manipulation by large investors and corporate insiders using market power increases market volatility and has an adverse price impact on other assets. They also find that the presence of large investors makes it risky for
would-be short sellers to trade against the mispricings, which in some cases are severe. Merrick et al. (2005) examine a case of manipulation involving a delivery squeeze on a bond futures contract traded in London, while Jegadeesh (1993) and Jordan and Jordan (1996) examine the Salomon brothers’ market corner of a Treasury note auction in 1991.
Besides the somewhat obvious limitation of small sample sizes, a less obvious limitation of these studies is non-randomness of their samples that arises as a result of incomplete detection (and prosecution) of manipulation. The biases in inference that can arise when this problem is ignored are well documented by Feinstein (1990). Despite this limitation, studies of known manipulation cases provide rich insights about manipulation that can not be gained using other approaches.
2.3.3 Experimental studies
In an unusual field experiment, Camerer (1998) attempts to manipulate horse racing odds by making bets and then cancelling them shortly before the race. Although making and then cancelling bets is costless, this is not widely known by bettors at the time. Camerer finds that that the bets placed by the experimenter do not distort prices.
Hanson et al. (2006) conduct the first laboratory work on price manipulation. In their study, 12 participants trade stock and cash in an electronic limit order book market. In their manipulation treatment, half of the participants are given monetary incentives to manipulate the stock price. Their main result is that manipulators are unable to distort price accuracy because other traders counteract the actions of the manipulator.
Experimental studies are able to overcome many of the limitations of other empirical methods because the experimenter is able to observe and control information, incentives and fundamental asset values, as well as being able to overcome the problems caused by incomplete detection of manipulation. The main limitation in this type of research is in the ability to construct the experimental setting
in a sufficiently realistic manner so that results have external validity and offer meaningful insights for real markets. Despite this limitation, experimental studies are a promising and underutilised method for enhancing our understanding of market manipulation.
2.4 Conclusions
The generic term ‘market manipulation’ refers to a very large number of highly varied strategies generally involving the intent to create a misleading appearance regarding the price or trading activity of a security. Closing price manipulation is typically a trade-based form of contractual manipulation, although it is also sometimes used in conjunction with other techniques to facilitate a run on a stock.
The large body of theoretical market manipulation literature provides insights about the conditions under which manipulation is profitable. A limitation of this literature is that the assumptions and simplifications made in order for theoretical models to be tractable lead to questions about the validity of their results in real markets. The empirical literature by comparison is scarce, largely due to the difficulties in obtaining data, but provides some rich insights. The greatest difficulty for studies based on circumstantial or indirect evidence is ruling out alternative explanations. Studies of known manipulation cases use small non-random samples, which brings into question the ability to generalise their results. Controlled experiments can overcome many of the difficulties faced by empirical studies, however, there is almost no work in this area yet. Many aspects of market manipulation are not yet well understood, such as its prevalence, determinants and effects. Further empirical evidence on these issues would be valuable. Future empirical studies might seek to obtain more comprehensive datasets of manipulation cases, addressing the incomplete detection problems in existing datasets, or using controlled experiments.
There is only a small amount of work specifically on closing price manipulation, despite the many uses of closing prices and the perceived pervasiveness of this form of manipulation.14 Theoretical studies demonstrate that derivative traders, brokers and fund managers have incentives to manipulate closing prices and empirical studies find evidence that these market participants engage in closing price manipulation. There is scope for research that furthers our understanding of closing price manipulation, particularly its prevalence, determinants and effects.
This thesis contributes to the empirical literature using the approaches suggested by this review: collection of a comprehensive dataset of closing price manipulation cases, application of econometric methods that address the incomplete detection problem, and a controlled experiment. This thesis adds to the small number of studies specifically focussed on closing price manipulation. Unlike many existing studies, this research is not limited to specific motivations for closing price manipulation or specific groups of market participants, and examines closing price manipulation more broadly. Rather than providing evidence of the possibility or profitability of closing price manipulation, this thesis focuses on the prevalence, determinants and effects of manipulation.
14 For example, an article in news magazine Maclean’s (10 July 2000, Vol. 113 No. 28, page 39)
Chapter 3
Prevalence and determinants of closing
price manipulation
3.1 Introduction
Our understanding of the pervasiveness and underpinnings of closing price manipulation is limited by the fact that only some non-random fraction of manipulation is detected and prosecuted by market regulators. Thel (1994, p. 223) remarks “manipulation is theoretically possible and probably occurs fairly often”. Closing price manipulation in particular is perceived by market participants to be common, but how common is common? Similarly, the underpinnings of manipulation are not well understood. For example, fund managers have been prosecuted for manipulating closing prices on quarter-ends but is closing price manipulation more likely on quarter-ends than on other days?
This chapter makes two main contributions. First, it quantifies the extent to which various factors drive closing price manipulation and its detection, and second, it estimates the prevalence of closing price manipulation in stock markets. The analysis uses a hand collected sample of actual manipulation cases and detection controlled estimation (DCE) methods, which explicitly take into consideration that only a non-random subset of manipulation is detected. The sample of prosecuted manipulation cases is from four US and Canadian stock exchanges: the New York Stock Exchange (NYSE), the American Stock Exchange (AMEX), the Toronto Stock Exchange (TSX) and the TSX Venture Exchange (TSX-V).
The results indicate that stocks with high levels of information asymmetry and mid to low levels of liquidity are most likely to be manipulated. A significant
proportion of manipulation occurs on month-end and quarter-end days suggesting fund managers are responsible for a considerable fraction of manipulation. Stock price volatility deters manipulation by drawing the attention of regulators. The DCE models estimate that approximately 1.1% of closing prices are manipulated. For each prosecuted instance of closing price manipulation approximately 280 to 310 instances of manipulation remain undetected or not prosecuted. The rates of manipulation and detection differ substantially across exchanges. Larger government regulatory budgets increase the rate of prosecution and deter manipulation. Therefore, increased government regulatory budgets are likely to enhance market integrity.
The estimates of the fraction of manipulation that remains undetected are crucial in evaluating the effectiveness of regulation and deciding whether or not current regulatory effort is sufficient. The insights into what drives manipulation have implications for improving the efficiency with which scarce regulatory resources are utilised in detecting and deterring manipulation. The estimates of the frequency of closing price manipulation and where it is most likely to occur help quantify the harm caused by manipulators to market efficiency and social welfare.
3.2 Empirical model of manipulation and detection
Many violations of laws and regulations, such as manipulation and insider trading, are not detected and not prosecuted. Analysing only the detected and prosecuted fraction can lead to substantial biases in inference about the characteristics or frequency of violations. This problem is overlooked or inadequately addressed in much of the empirical literature.
Biases in inference about the characteristics of market misconduct arise when the set of detected cases systematically differ from all violations because of non-random detection. Due to their limited resources, regulators such as the US Securities and Exchange commission (SEC) are unable to pursue all violations and are likely to
focus enforcement effort on egregious violations and high-profile cases that will have the most deterrence effect (Agrawal and Chadha, 2005).
The biases caused by non-random detection become particularly problematic when some aspect of the detection process is related to the effects being examined. For example, Aggarwal and Wu (2006) analyse a sample of ‘pump-and-dump’ manipulation cases prosecuted by the US Securities and Exchange Commission (SEC). In a pump-and-dump scheme a manipulator takes a long position in a stock, inflates the price through aggressive trading or by releasing false information and then profits from selling the stock at the inflated price. If cases of manipulation that cause large price changes are more likely to be detected and prosecuted by the SEC, then the inferences of Aggarwal and Wu about the effect of manipulation on prices, or what types of stocks are more likely to be manipulated, are potentially significantly biased. The difficulty in estimating the underlying rate of violations (consisting of detected
and undetected violations) is more obvious – if undetected violations cannot be observed, how can one infer what fraction goes undetected?
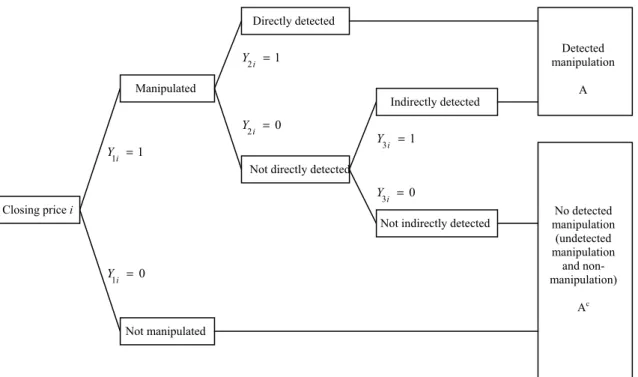
The econometric problems caused by incomplete detection are well documented by Feinstein (1990, 1991). To overcome these problems, Feinstein (1990) develops detection controlled estimation (DCE) methods that allow inference about undetected violations, which are not directly observable. DCE models have been applied to the regulation of nuclear power plants (Feinstein, 1989), income tax evasion (Feinstein, 1990, 1991), compliance with environmental protection legislation (Brehm and Hamilton, 1996; Helland, 1998) and false positives in mammograms (Kleit and Ruiz, 2003). The idea behind DCE is simple: jointly estimating models of the detection and violation processes explicitly allows for incomplete detection. In its simplest form, a DCE model is a system of two equations: one modelling violation and the other modelling detection conditional on violation having occurred.