A Complexity and Networks approach to
Sustainability.
Nicky Zachariou
Department of Physics
and
Centre for Complexity Science
Imperial College London
This thesis is submitted in part fulfilment of the requirements of the degree
of Doctor of Philosophy in Physics of Imperial College London and the
Diploma of Imperial College London.
Copyright
The copyright of this thesis rests with the author and is made available under a Creative Commons Attribution Non-Commercial No Derivatives licence. Researchers are free to copy, distribute or transmit the thesis on the condition that they attribute it, that they do not use it for commercial purposes and that they do not alter, transform or build upon it. For any reuse or redistribution, researchers must make clear to others the licence terms of this work.
Στην Αυγή, Ελένη και Ροβινσών.
Declaration
I hereby declare that except where specific reference is made to the work of others, the contents of this dissertation are original and have not been submitted in whole or in part for consideration for any other degree or qualification in this, or any other University. Parts of this dissertation that have been published in peer reviewed journals have been clearly indicated as such in the text.
Nicky Zachariou July 2016
Acknowledgements
As I was writing this I realised two things: one, that I am an extremely lucky person who is surrounded by very kind and good people and two, that I actually enjoyed this adventure and lived to tell the tale. I call this my Seven Year Itch. And below is the list of people that helped me grow up slightly and/or made my days better and/or helped shape my future whilst being extremely patient with me until I got there. They are all great friends and have taught me important lessons about life1.
Thank you μάμα μου – for everything. If I am here today, it’s because of you. You made the right decisions at the right time, regardless of personal cost and sacrifice and you have worked extremely hard so that I wouldn’t need to. But most of all, thank you for passing onto me your love for education and your fierce energy for life.
Thank youπαπά μου– for teaching me cards that taught me maths, for not taking 95 when you thought 100 was possible and for dancing with me, protecting me, being proud of me and supporting me until your final breath.
1If I have forgotten anyone it is because I am an awful person and I do not deserve your love and
Thank youμάμα θεία Ελένη μου – for being my second mum and my best friend and for asking me at age two what I was going to be when I grow up and for patiently waiting for the answer still.
Thank you Kim – for persistently fighting for me and holding my hand through all the hurdles, for knowing what to do when everything was taken away. But most importantly thank you for being my teacher and a great friend. I will be forever in your debt.
Thank you Henrik – for not giving up on me, for giving me enough freedom to find myself but subtly guiding me along the way and inspiring me to be an all rounded mathematician.
Thank you Paul – for taking me under your wing, for being a great friend and companion in this journey, for being stuck in the toilet during the 311 earthquake, for knowing the Japanese words for explosion and alcohol and finally for teaching me what a real scientist is and helping me realise that I am not one.
Thank you Gunnar – for making me realise that (a)this is real life, I can just open the door and get out of hereand (b)who cares about all that I know, it’s what I don’t that’s exciting!
Thank you Shama and Kishan – for pushing the boundaries and helping me spread the word on complexity and networks to non-scientists.
Thank you Rishi – for using data for good and for making a full time job and a weekend PhD an attractive idea. It was tough, but I made it and you will too.
9
Thank you Misako – for welcoming me to Japan with open arms, but most importantly for not succumbing to gender biases and showing me first hand that when sexist people serve you lemons you don’t just make lemonade, you raise capital and buy the equivalent dataset from their competitors.
Thank you Hideki – for showing me that interesting research can be done both within and outside of academia and that to succeed I always need to be ahead of the curve.
Thank you Wataru, Hayafumi, Yura, Yukie and Taro – for introducing me to many new experiences, be it raw chicken or cooked oysters. Also, thank you Yura – for showing me that it is important to do what you are passionate about regardless of the personal costs.
Thank you Adrian – for taking charge and succeeding in getting Paul and I safely home by anymeans necessary, because hindsight is a luxury that arrives a minute too late.
Thank you Maria – for making sandcastles, playing mermaids, being a lady and making the days that I see you absolutely spectacular.
Thank you Elena – for still sending me handwritten letters by post, for showing me that “you only fail when you stop trying” and finally for succeeding against all odds.
Thank you Giovanna – for choosing all the flavours of ice cream, for creating databeers just for fun and for sending me two copies ofThe Thirtieth Yearwhen I was in my late twenties because you thought I needed to read it and would appreciate a head start.
Thank you kids – Alex for your endless wisdom and thirst for knowledge. Dylan for count-ing in batches of sixteen and for not touchcount-ing my laptop durcount-ing simulations, even though you really wanted to. Melissa for approaching every situation with a smile first.
Thank you Timon – for picking up the phone on that day, for being a constant positive influence ever since and for falling multiple times but still getting up to finish the dance.
Thank youΙάκωβε– for the music and the lyrics.
Thank youΜάριε– for showing me that it’s possible to find out what you want to be when you grow up and then do everything in your power to be it.
Thank you Dean – for perfecting my right hook, for kicking the pedestal and for making me feel like anything is physically possible.
Thank you Gauss – for being the best dog and for keeping me company all these sleepless nights that I stayed up writing this thesis.
Thank youΤόπη μου– for not giving up when I did and for being a grown up and a kid.
Κάντε υπομονή, κι ο ουρανός θα γίνει πιο γαλανός. Κάντε υπομονή, μια λεμονιά ανθίζει στη γειτωνιά.
Αλέκος Σακελλάριος2
2
Translation: Be patient, and the sky will become more blue. Be patient and a lemon tree is blooming in the neighborhood.
Abstract
Sustainability is a key issue of the 21st century. A complexity and networks approach is taken to investigate what makes socio-economic systems sustainable, or not, and what lessons that can be learned from the sandpile model, an analogy of observed economic ac-tivity.
The sandpile model has been studied extensively on regular lattices with fixed coordination numberK=2. Here, the dynamics is generalised to evolve on less rigid networks. The reg-ular lattice structure is relaxed by introducing an inter-layer distribution for the interactions between nodes. This forces the scaling exponent of the avalanche-size probability density function out of the two-dimensional directed sandpile universality class τ =4/3, into the mean field universality classτ=3/2.
An apparent drift in the exponents of the avalanches found in the Monte Carlo simulations on a lattice with K >2 is attributed to the observed holes and side-branches of avalanche clusters, which leads to large corrections to scaling. TheK =3 case is solved analytically, proving that in fact the critical exponents forK>2 are identical to theK=2 case.
production-consumption network between firms in a real economy. A novel avalanche-size exponent τ ≈1.87, that falls outside the two known universality classes, emerges when the model evolves on the Japanese inter-firm network. This network has the typical bow-tie structure of a real-world directed network: in and out-layers, and a strongly connected component. The strongly connected component is not layered and displays a large range of network motifs [61].
Randomly adding a small proportion of links between non-adjacent layers in one of the lay-ered networks in the field universality class, abruptly takes the system out of the mean-field regime with a non-trivial avalanche-size probability density function, which closely reproduces the behaviour observed on the real-world Japanese network.
Contents
Contents 13 List of Figures 17 List of Tables 25 Nomenclature 27 1 Introduction 29 1.1 Motivation . . . 29 1.2 Thesis Outline . . . 30 1.3 List of Publications . . . 33 2 Sustainability 352.1 The world we live in . . . 35 2.2 The principles of Sustainability . . . 38
2.4 Seeking Sustainability in an age of complexity . . . 42
2.5 Summary . . . 44
3 Complexity and Networks 47 3.1 Reductionism Limitations . . . 47
3.2 Complexity Science . . . 49
3.2.1 Insect Colonies . . . 50
3.2.2 Economies . . . 51
3.2.3 The Earth . . . 52
3.3 Adaptability of Complex Systems . . . 53
3.4 Emergence . . . 54
3.5 Network Science . . . 54
3.6 Summary . . . 58
4 The generalised sandpile model as a paradigm for economic activity 61 4.1 Introduction . . . 61
4.2 Model definition of the generalised sandpile . . . 66
4.3 Theoretical framework . . . 71
4.4 Results on a regular lattice with K≥2 . . . 73
Contents 15
5 Analytical solution of the directed sandpile model forK≥2 79
5.1 Introduction . . . 79
5.2 Model definition . . . 81
5.3 Calculation of the 2-point correlation function . . . 84
5.4 Calculation of the 3-point correlation function . . . 88
5.5 Corrections to scaling . . . 99
5.6 Numerical simulations . . . 102
5.6.1 Initialisation . . . 102
5.6.2 Parameters and Results . . . 103
5.7 Summary . . . 109
6 Avalanches in the real-world inter-firm network of the Japanese economy 111 6.1 Introduction . . . 111
6.2 Methods . . . 114
6.3 Results on less rigid networks . . . 115
6.3.1 Japanese inter-firm network . . . 116
6.3.2 Layered lattice with inter-layer distribution of interactions . . . 118
6.3.3 Long range connections across layers . . . 123
7 Discussion 129
7.1 Conclusions . . . 129 7.2 Outlook . . . 132
List of Figures
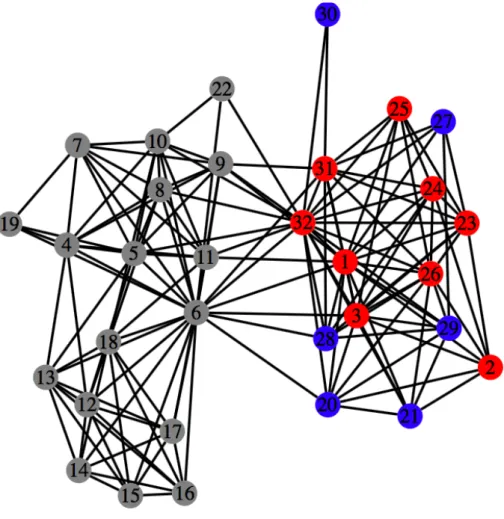
3.1 Network of acknowledgements. The social network of the individuals in the acknowledgements section, where nodes are numbered in order of ap-pearance in the text and coloured according to whether they are family (red), academics (grey) and close friends (blue). The average path length is 1.86 and the average degree is 9.3. Node 6 is a hub node, as it is connected to 70% of the other nodes in the network and its degree (22), greatly exceeds the average. It also has the highest betweenness centrality (166), which means that it acts as the predominant bridge along the shortest path between most pairs of nodes. . . 56
4.1 Illustration of a sandpile in bureaucracy.Bureaucrats remain inactive un-til four or more pieces of paper requiring action are found on their desk, at which point they will send one piece of paper to each of their nearest neigh-bours. After some time, the system will reach a point where a single piece of paper entering the office will cause an avalanche of papers being shuffled around. This light-hearted application of the sandpile to a bureaucratic set-ting is courtesy of the physicist Peter Grassberger who, ironically, is famous for his research in chaos theory. . . 64
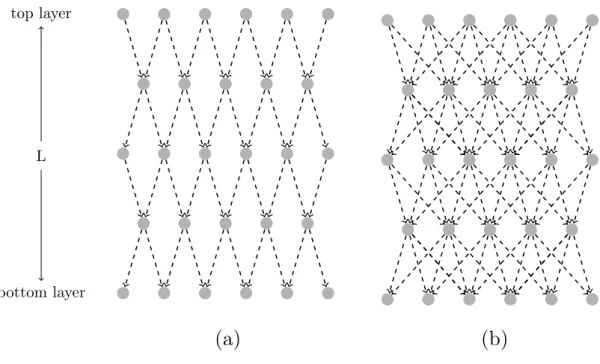
4.2 Illustration of regular lattice topologies. Networks shown are subsets of: (a) a two-dimensional directed lattice with coordination numberK=2; (b) a two-dimensional directed lattice with coordination number K=4. Peri-odic boundary conditions are applied to the left- and right-most nodes to form a cylindrical structure. The nodes in the top layer are the final goods producers, the nodes in the bottom layer are providers of raw materials and all other nodes between are the producers of intermediate goods. It is left to the readers imagination to extend this setup to higher co-ordination numbers K>4. . . 67
List of Figures 19
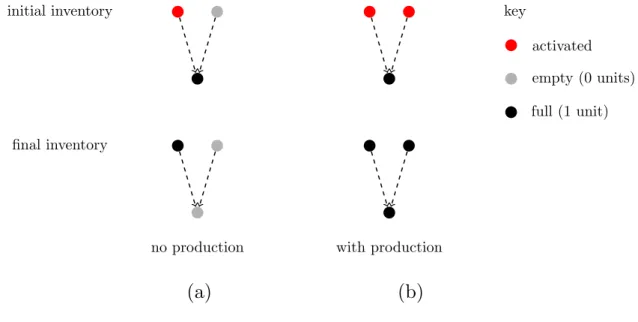
4.3 Illustration of a local process with and without production. Networks shown are subsets of a two-dimensional directed lattice with coordination number K =2 with different initial inventory configurations: (a) the pro-ducer node (black) receives an order from its customer, the activated (red) node in the layer above, and since it can fulfil the order from the prod-uct in its inventory it will simply hand it over and not go into prodprod-uction, yi,j(t) =0, resulting in an empty inventory in the final configuration; (b) the producer node (black) receives two orders from both its customer, the activated (red) nodes in the layer above, and since this time it cannot fulfil both orders from the product in its inventory it must produce to its full ca-pacity,yi,j(t) =kini,j which is 2 units in this case, and give the product to its customers leaving all inventories full in the final configuration. . . 69
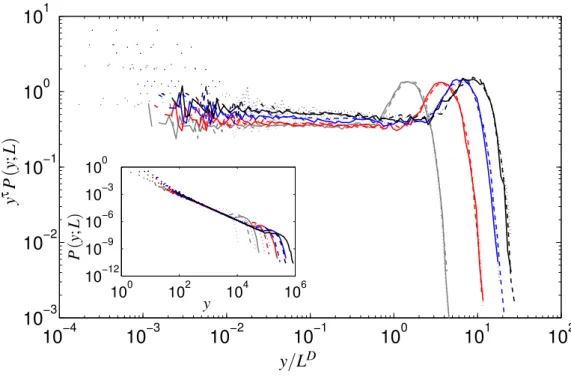
4.4 Results on regular lattice with higher coordination number. The main figure shows the data collapse for different coordination numbers K of the avalanche-size pdfsP(y;L)obtained by plotting the transformed avalanche-size pdf yτP(y;L)against the rescaled avalanche size y/LD using the esti-mates of the avalanche-size scaling exponentsτ and Dobtained from mo-ment scaling analysis, see Table 4.1. The line style indicates the system size, dotted line: L=200; dashed line: L=400; solid line: L=600. The width of the system is kept constant atM=2000 nodes. The colours show the coordination number for the regular lattice underlying networks;K=2 (grey), K =4 (red), K =6 (blue), K =8 (black). The inset displays the avalanche-size pdf P(y;L) plotted against the avalanche size y after loga-rithmic binning was used. . . 75
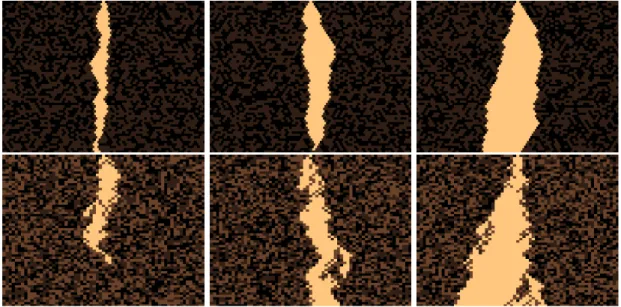
5.1 Illustrations of avalanches.Three randomly selected examples of avalanches for systems with co-ordination numbersK=2 (top row) andK=3 (bottom row), with avalanche sizess=201; 406; 802 ands=201; 404; 805 respec-tively. The avalanches start at the top row (t=0) and for display purposes have been centred around their seed node. The lattices used to generate these results have height L=64 and widthM =160; only the middle 64 columns are displayed here as these are enough to show the trajectory of the avalanche. The toppled sites have an off-white colour and the remaining sites have different shades of brown based on their height at the end, when the avalanche has stopped. ForK=2 the allowed heights areh(x,t) =0,1 and forK=3 a site does not topple forh(x,t) =0,1,2. The avalanches for K=2 are compact as opposed to the avalanches forK=3. Also, notice the K=3 avalanches can have side branches. . . 81
5.2 Illustration of the directed sandpile model on a cylindrical lattice.Each site has K =3 downward neighbours and is allowed to have a height of h(x,t) =0,1,2, wheret =0,1, ...,L−1 and x=0,1, ...,M−1. When the height exceeds 2, then the site is said to topple and one particle is transferred to each of its K=3 downward neighbours as denoted by the arrows. The light cone of the top site, the seed node, is indicated with sites having black circles; sites in grey will be unaffected by any avalanche initiated at that specific seed. . . 82
List of Figures 21
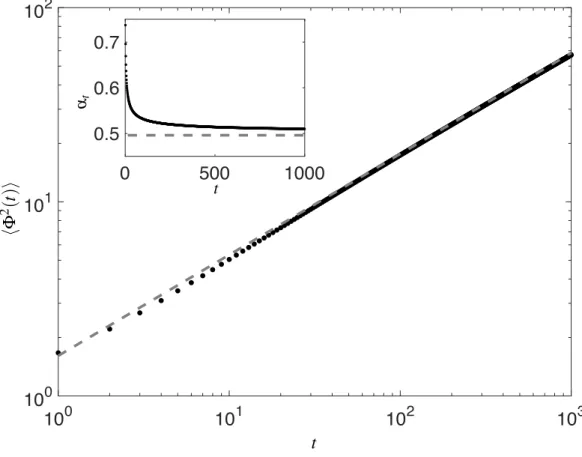
5.3 Corrections to scaling. The main figure shows the behavior of the mean squared flux⟨Φ2(t)⟩as a function of the deptht, 1≤t≤1000, determined
from the exact series expansion of ˜F(z) (black dotted line) in a double-logarithmic plot. The best visual fit to the function f(t) =atα given by the estimated parametersa≈1.61,α ≈0.52 (grey dashed line). In the inset, we plot effective exponent αt, defined in Eq. (5.47) (black dotted line) which slowly converges to the exact value 0.5 (grey dashed line), as⟨Φ2(t)⟩∝t1/2.
Both plots in this figure show that corrections to scaling are still large for avalanches of duration of order 103, that is, avalanches that reacht =1000. 100
5.4 Moments analysis. The scaled moments⟨sn⟩L−µnplotted against the height of the lattice Lforn=2,3,4,5. The data shown is for differentK=2 (red circles), K=3 (green squares) and K=4 (blue diamonds). For the same K, a higher curve corresponds to higher n. Note that for increasingK, the corrections to scaling become more important. . . 104
6.1 Results on the Japanese inter-firm network. The avalanche-size pdfP(y)
versus the avalanche sizeyobtained when the directed generalised dynamics evolves on the inter-firm network (solid black line). For more than three orders of magnitude, this pdf is well approximated with a power-law decay P(y)∝y−1.87, for 20.y.30000. The grey dashed lines withτ=4/3 and τ=3/2 are guides to the eyes for the known universality classes’ avalanche-size exponents of directed (d=2) and mean-field, respectively. . . 118
6.2 Results on lattices with Gaussian out- and in-degree inter-layer distri-butions.The main figure shows the data collapse of the avalanche-size pdfs P(y;L) from networks with underlying Gaussian out-degree distribution, obtained by plotting the transformed avalanche-size pdf yτP(y;L) against the rescaled avalanche sizey/LD using the estimates of the avalanche-size scaling exponentsτ andDobtained from moment scaling analysis, see Ta-ble 6.1, L=200 (dashed-dotted); L=400 (dashed line); L=600 (solid line). The line colour indicates the standard deviation: σ =0 (red),σ =1 (blue), σ=2 (black). By CLT the in-degree is also Gaussian distributed. The width of the system isM=2000 nodes. The inset displays the avalanche-size pdf P(y;L)versus the avalanche sizey. . . . 120
6.3 Results on lattices with scale-free out- and Gaussian in-degree inter-layer distributions.The main figure shows the data collapse of the avalanche-size pdfs P(y;L) from networks with underlying truncated scale-free out-degree distribution and, by Central Limit Theorem (CLT), Gaussian in-degree distribution. These were obtained by plotting the transformed avalanche-size pdf yτP(y;L)against the rescaled avalanche size y/LD using the esti-mates of the avalanche-size scaling exponentsτ andD obtained from mo-ment scaling analysis, see Table 6.2. The line style indicates the system size, dashed-dotted: L=200; dashed line: L=400; solid line: L=600. The line colour indicates the scale-free exponentγ:γ =2.5 (red),γ=3.0 (blue), γ=3.5 (black). The width of the system is kept constant at 2000 nodes. The inset displays the avalanche-size pdf P(y;L)plotted against the avalanche size y generated from networks with underlying truncated scale-free out-degree distribution. . . 121
List of Figures 23
6.4 Results on lattices with scale-free in- and out-degree inter-layer distri-butions. The main figure shows the data collapse of the avalanche-size pdfs P(y;L) from networks with underlying truncated scale-free in- and out-degree distribution. These were obtained by plotting the transformed avalanche-size pdfyτP(y;L)against the rescaled avalanche sizey/LDusing the estimates of the avalanche-size scaling exponentsτandDobtained from moment scaling analysis, see Table 6.3. The line style indicates the system size, dashed-dotted: L=100; dotted line: L=200; dashed line: L=400; solid line: L=600. The line colour indicates the scale-free exponent γ: γ =2.5 (red) withL=100,200,400 andγ=3.5 (black) withL=200,400,600. The width of the system isM=2000 nodes. The inset displays the avalanche-size pdfP(y;L)versus the avalanche sizey. . . 123
6.5 Illustration of the types of layered topologies tested. Networks shown are subsets of (a) two-dimensional rigid regular directed lattice with co-ordination number K = 2 (black dashed lines); (b) layered network with a randomised inter-layer degree distribution (e.g. Gaussian or Scale-free) with randomly chosen neighbours in the adjacent layer below (black solid lines); (c) networks created by adding links connecting non adjacent layers (red solid lines) in both directions to the layered network with randomised degree distribution (black solid lines). In all cases, periodic boundary con-ditions are applied to the left- and right-most nodes to form a cylindrical structure. . . 124
6.6 Results on lattices with long-range connections. The avalanche-size pdf P(y)versus the avalanche-sizeyobtained using the inter-firm Japanese net-work (solid black line). The dashed red line is the pdf P(y) obtained with 25% of long range connections across layers in an otherwise layered net-work with nodes in- and out- degree drawn from a truncated scale-free distribution with exponent γ =2.5 and system size L =400. The grey dashed lines are guides to the eyes for the different avalanche-size expo-nents (τ =4/3 and 3/2) of the known universality classes for the directed sandpile model and the approximate τ =1.87 that seems to fit the pdfs of inter-firm Japanese network. . . 126
List of Tables
4.1 Scaling exponents on regular lattices. The avalanche-size exponent, τ, and the avalanche-dimension, D, for regular lattice structures with coordi-nation numbers,K=2,4,6,8 and circumferenceM, see Fig. 4.4 for the data collapse. The numbers in the brackets indicate the estimated errors of the exponents. The scaling relation D(2−τ) =1, see Eq. (4.11), is fulfilled (see last column) and, within error bars, both scaling exponents (apart from K =8 andM=2000) are consistent with the universality class of the two-dimensional directed sandpile modelτ =4/3 andD=3/2. The numerical result forK=8,M=2000 and 4000 suggests that the apparent drift is due to finite size effects. . . 76
5.1 Scaling exponents on regular lattices with corrections to scaling. Nu-merical estimates of the avalanche dimension D, and the avalanche-size exponent τ that was derived from it via the scaling relation τ =2−1/D. The numerics for K =2 were performed as a reference, as D=3/2 and henceτ=4/3 was already known analytically [26]. The first two columns are fits without including corrections to scaling. The last two columns list the exponents extracted when the fit includes corrections to scaling (ctos) Eq. (5.52) for systems withK=3 and 4. The errorbars listed in the brack-ets correspond to three standard deviations of the last two significant digits. When corrections to scaling are taken into account, the data is consistent withD=3/2 andτ=4/3 for allKconsidered. . . 107
6.1 Scaling exponens on layered lattices with Gaussian out- and in-degree inter-layer distributions.The avalanche-size exponent,τ, and the avalanche-dimension, D, for networks with nodes’ out-degrees drawn from a Gauss-sian distribution with a fixed mean coordination number µ =4, and stan-dard deviations σ =0,1,2. Note that the case ofσ =0 is just a randomly rewired version of the regular lattice with coordination number K=4, see Fig. 6.2 for the data collapse. The numbers in the brackets indicate the es-timated errors of the exponents. Within error bars, both scaling exponents are consistent with the mean-field modelτ =3/2 andD=2. The last col-umn shows that the exponents fulfill the scaling relationD(2−τ) =1, see Eq. (4.11). . . 119
List of Tables 27
6.2 Scaling exponents with scale-free out- and Gaussian in-degree inter-layer distributions. The avalanche-size exponent τ and dimensionD for networks with nodes’ out-degrees drawn from a truncated scale free distri-bution with exponentγ =2.5,3.0,3.5, see Fig. 6.3 for the data collapse. The CLT ensures the distribution of in-degrees is Gaussian. The estimated errors of the exponents are in the brackets. Within error bars, both scaling expo-nents are consistent with the mean-field modelτ=3/2 andD=2. The last column shows that the exponents fulfill the scaling relation D(2−τ) =1, see Eq. (4.11). . . 121
6.3 Scaling exponents on layered lattices with scale-free in- and out-degree inter-layer distributions.The avalanche-size exponent,τ, and the avalanche-dimension,D, for networks with nodes’ in- and out-degrees were both drawn from a truncated scale free distribution with exponents γ =2.5,3.5, see Fig. 6.4 for the data collapse. The numbers in the brackets indicate the estimated errors of the exponents. Within error bars, both scaling exponents are consistent with the mean field-modelτ =3/2 andD=2. The last col-umn shows that the exponents fulfill the scaling relationD(2−τ) =1, see Eq. (4.11). . . 122
Chapter 1
Introduction
1.1
Motivation
Complexity science deals with systems consisting of a large number of interacting compo-nents, whose aggregate activity cannot be predicted by the summation of the activity of the individual components alone [41]. One such complex system is the economy.
The economy of a country is made up of all the interactions within the country’s inter-firm network. A long-standing problem in macroeconomic theory is explaining the unsustaable large fluctuations in aggregate economic activity that can result from many small, in-dependent shocks to individual sectors [77]. It is of utmost importance as these can occur suddenly, cannot be effectively planned against and their effects can persist for a long time.
sand-pile model, a non-equilibrium system that self-organises into a critical scale-free state. Once settled at the steady state, the system has two characteristic timescales: at the slow timescale the system is driven by a grain of sand being added one at a time and at the fast timescale the system relaxes by a sudden burst of activity with a frequency-size distribution that is scale-free, with avalanches of all sizes and all durations [2]. Investigating how the dynam-ics of the generalised sandpile evolves on more realistic networks of the economy can shed some light on the causes of the large fluctuations.
The real-world inter-firm network of all active companies in the Japanese economy is a prime candidate for this study; the topology of this network is non-layered and directed, displaying the typical bow-tie structure found in real-world directed networks, with cycles and triangles. The emerging large fluctuations, that are observed when the generalised sand-pile dynamics evolves on this network, can be detrimental to the sustainability of the system. It would be highly desirable if one could mitigate or even prevent them.
Understanding the mechanisms behind this example provide great insight as to what makes socio-economic systems sustainable.
1.2
Thesis Outline
The remainder of this thesis is arranged as follows.
In Chapter 2, the notion of sustainability is introduced and its importance in the world we currently live in is discussed in detail. Humans are seen as the dominant species and the sustainability of a human society is based mainly on the way the society is organised
1.2 Thesis Outline 31
rather than solely its relationship with the environment. Human societies have a lot to learn from the fundamental principles of governance in the systems of the natural world. Great insight can be drawn from modelling a human society as a complex system striving for its sustainability where the behaviour of the inter-connected socio-economic systems in the macroscale is really emerging from the interactions of the individuals in the microscale.
In Chapter 3, complex systems are explored. Complexity is an interdisciplinary field of research that tries to understand how large numbers of simple components self-organise, without the control of a central instructor, into a collective whole with macroscopic emerg-ing coherent states that shares information and evolves. Colonies of social insects are in-troduced as some of the most mysterious and knowledge wealthy examples of complex systems in nature, whereas economies are a man made counterpart which are thought of being adaptive complex systems both on the micro- and macroscale. Social communities are networks made up of a large collection of nodes connected with edges; the nodes are the entities making up the social structure such as people, firms or insects whose many different types of relationships are characterised by the edges joining them. Thus, network science is proposed as a method of representing the complex systems under investigation.
In Chapter 4, the sandpile model is introduced and redefined as a model for studying be-haviour in socio-economic systems. A more general form of the traditional dynamics is left to evolve on different regular network topologies with multiple neighbours per site. One can move from a strictly layered and rigid regular lattice, where the directed sandpile model has been studied until now, to a more flexible structure, by relaxing the regular lattice structure and introducing an interlayer distribution for the interactions. This forces the scaling expo-nent of the avalanche-size probability density function out of the two-dimensional directed sandpile universality classτ =4/3, into the mean field universality classτ=3/2.
In Chapter 5, it is shown both analytically and numerically that the generalisation of the directed sandpile model (see Chapter 4) on a square lattice, withK downward neighbours per site, whereK>2, is in the same universality class asK=2 case which has previously been solved analytically. For K>2, the avalanche clusters have side-branches that create holes into the otherwise compact avalanches obtained in theK =2 case. Nevertheless, the large scale structure of the avalanches forK>2 tends to theK=2 case and yields the same critical exponents, which leads to the conclusion that the generalised sandpile model on a regular lattice is in the same universality class for allK≥2 [27].
In Chapter 6, avalanches in the economy are investigated when the generalised sandpile dy-namics evolves on the real-world inter-firm network of all active companies in the Japanese economy. A novel avalanche-size exponent (τ ≈1.87 [98]) is observed, which does not fall into any of the two universality classes already discussed. Randomly adding a small proportion of links connecting non-adjacent layers, in an otherwise layered network with an interlayer distribution for the interactions, takes the system out of the mean field regime to produce a non-trivial avalanche-size probability density function that closely reproduces the behaviour observed on the Japanese inter-firm network.
Finally, the last chapter is a discussion which focuses on conclusions drawn from this re-search and plans for future work.
1.3 List of Publications 33
1.3
List of Publications
From Chapters 4 and 6
Zachariou, N., Expert, P., Takayasu, M., and Christensen, K. (2015). Generalised Sandpile Dynamics on Artificial and Real-World Directed Networks. PLoS ONE, 10(11):e0142685.
From Chapter 5
Dhar, D., Pruessner, G., Expert, P., Christensen, K., and Zachariou, N. (2016). Di-rected Abelian sandpile with multiple downward neighbors. Phys. Rev. E,93:042107.
Chapter 2
Sustainability
2.1
The world we live in
Our Earth is very different to Mars and Venus. As far as we have explored, it is the only planet with the unique property of sustaining itself and providing a nurturing environment for its living organisms [48, 78]. The debate as to whether this property of our planet is a result of its accidental position in our Solar System or is just a simple consequence of the life on its surface persists until the present day [48, 49]. Nevertheless, what remains is that, we, the dominant living things on this earth, should have a responsibility towards each other, to the other organisms and to Gaia herself to leave her behind in at least the same condition as we inherited her. The name Gaia stems from the Greek mythological goddess of the Earth,Γαία;James Lovelock revived this name in his 1979 controversial bookGaia: A New Look at Life on Earth [48], where he introduced his hypothesis: that all living organisms and inorganic material found on Earth are part of a tightly-coupled dynamic system that
self-regulates to maintain an environment fit for life.
The human species has always lived in an ever changing world over the past quarter of a million years. It not only suffered catastrophic events such as earthquakes, volcano erup-tions and ice ages, but has also evolved physically, culturally and politically to adhere with its time. Our extraordinary progress in the last millennia has brought on an unrivalled level of advancement in the technological, economical, environmental and social domain [37]. As a result, population growth alone has made us the dominant species on Earth, with the power to alter the planet’s natural course and cause irreparable damage to the ecosystem which houses us [95].
Over time, our basic instinct to protect ourselves against predators, pandemics and natural disasters has cemented the idea that we, the human species, must persevere by any means necessary. Added value was placed on the needs and desires of man, regardless of the consequences to the planet. What we overlooked in this endeavour is that our species is not isolated and in fact depends upon all the other organisms on Earth. Our survivability is interlinked with the survivability of all the other living things in our ecosystem and more importantly is coupled to the health of our planet [48].
Our advancement in technology, our rate of resource usage and our drive towards industri-alisation has affected the planet in unprecedented measures. Luckily or not, depending on your point of view, our activities are approaching the limits provided by the global cycles of water, food and energy. Highly connected transportation and communication systems have enabled the diffusion of economic activity and with it the exploitation of about every inch of this Earth. Unfortunately, we single handedly bear the responsibility of being the “dominant planetary engineers” [37].
2.1 The world we live in 37
The past few decades have given us a glimpse into the detrimental effects of our new re-lationship with our ecosystem. The observed global changes1include, but are not limited to, desertification, deforestation, species extinction, atmospheric chemistry, climate change, water pollution, floods, drought, growing poverty and frequent epidemics [37, 95]. The causes of these are solely dependent upon the activities of the ever increasing number of people. The observed bursts of economic activity in the last two centuries, which were mainly due to technological development, caused unsustainable demands of energy and re-source use [38]. The situation is extremely serious; the factors that cause these changes continue to advance at the same rate.
At the same time, we should not let our concerns over the irreparable changes we have caused cast a complete shadow over the many successes of the last millennium. Let us not forget that, before the advancements that brought us here, life was mostly short and difficult by the current Western standards. The United Nations Millennium Goals [86] were drafted in 2000 with the intention of providing a clear understanding of where we stand as a society and the outstanding problems we must address in the next millennium: the key two being sustainability and development. At first glance these may seem unrelated, but at close inspection one realises that you cannot have a success in one without the other; any progress made in development will not last unless it is made in a sustainable way. Ultimately, and due to our current way of making decisions, sustainability is at the mercy of the actions of individuals based on the information and the incentives they receive from governmental policies and the state of the economy at a local level, but also from the markets and other global interactions [37]. The behaviour of the inter-connected socio-economic systems in the macroscale is really determined by the interactions of the individuals in the microscale.
1Global changes occur on a planetary-scale in the Earth system, which includes the atmosphere, the land
2.2
The principles of Sustainability
Sustainability as an idea has been gaining momentum in recent years. The word (un-) sustainable appears on governmental leaflets, the back of packaging and television adverts. We understand that it is an important idea, we must live our lives in a sustainable way, but most of us do not really understand what this exactly entails; sustainability is much more than being environmentally friendly, although caring for the environment is a good start.
In its modern form, sustainability as a concept was used as far back as 1974 by the World Council of Churches in their report to the ecumenical study conference [94]. It came as an answer to the world’s developing countries, which had an objection to worrying about the environment, when other crucial matters such as poverty and deprivation of fundamental resources took precedence. The concept of asustainable society, surprisingly, does not im-pose environmental conditions but instead imim-poses social conditions; it follows the principle of equatable distribution and democratic participation. Simply put, a sustainable society is one which will not self-destruct. Sustainability should just emerge at the crossroads between concerns for the global environment and global social justice. The difficulty then truly lies in reconciling the natural limits to growth with the concerns to social justice. The notion of sustainable development was introduced not long after [32].
In 1987, the United Nations World Commission on Environment and Development (WCED) publishedOur Common Future [11], a fundamental report highlighting the importance of sustainability and more so, of sustainable development. TheBrundtland Report2 as it be-came known, attempted to stress the importance of the intertwined relationship between economic development and environmental protection:
2Named after the Norwegian prime minister Gro Harlem Brundtland who chaired the UN General
2.2 The principles of Sustainability 39
“Through our deliberations and the testimony of people at the public hearings we held on five continents, all the commissioners came to focus on one central theme: many present development trends leave increasing numbers of people poor and vulnerable, while at the same time degrading the environment. How can such development serve next century’s world of twice as many people relying on the same environment? This realization broadened our view of development. We came to see it not in its restricted context of economic growth in developing countries. We came to see that a new development path was required, one that sustained human progress not just in a few pieces for a few years, but for the entire planet into the distant future. Thus ’sustainable development’ becomes a goal not just for the ’developing’ nations, but for industrial ones as well [11, 28].”
The report proceeds to define sustainable development as one which “meets the needs of the present without compromising the ability of future generations to meet their own needs.” They emphasised that the concept of sustainable development implies limits on environ-mental resources, which are placed by the current state of technological advancement and social organisation; the Earth cannot be stretched beyond her ability “to absorb the effects of human activities”. However, both technology and social organisation are variables that can be explored and managed so as to pave the way to a more sustainable economic growth. The result of this should be a drastic reduction in poverty, where the basic needs of all are met. It is the belief of the Commission that a world without poverty is one which is less prone to environmental disasters and conversely, a world less prone to environmental disasters is one without poverty [11].
Finally, the Brundtland report acknowledges the difficulties in reaching this goal. It empha-sises that sustainable development implies equity, both within and also between generations [28]. Moreover, sustainable development is not a fixed and stable state of peacefulness.
In-stead, it should be a growth process where the direction of technological development, the change in social organisation and the use of resources does not handicap the future genera-tions whilst trying to meet our generation’s needs.
The report served the purpose of formulating the issue and making imminent that our current destructive trends could not carry on with the everyday business as usual attitude. Difficult and unpopular choices needed to be made and it prompted governments and international agencies to seriously consider how to take action [85]. However, as with anything that rests on the shoulders of political will, the effect and results of any discussions were, and still are, very slow.
2.3
Thinking in systems
After the Brundtland report many international agreements have been prepared, signed, le-galised and the resulting actions taken [85], the most notable being the Kyoto Protocol [87] that became legally binding in 2005 and all agreed parties committed to reduce their green house emissions according to internationally set targets. During the lengthy process of drafting these agreements, the governments of the countries involved have allocated parts of their budgets to programmes at the local and national levels with the aim of influenc-ing people to make choices in the direction of a more sustainable future. However, many of the social and environmental indicators used for measuring the effect of humans on the biosphere continue to deteriorate: an additional 90 million people are pushed into poverty, 125 million are pushed into malnutrition to join the 1.02 billion people that already don’t have enough to eat [29, 30, 88], many species are approaching their limits of extinction and the accelerated global warming effects are becoming more evident [95]. Somehow, we are
2.3 Thinking in systems 41
still getting it wrong; all the joint efforts of our governments and international agencies are failing in reversing our current destructive trends.
Angela Espinosa and Jon Walker [29] argue that the sustainability of a human society is based mainly on the way the society is organised rather than its relationship with the envi-ronment. They strongly believe that governments as they are, cannot manage a transition to a sustainable future. The hierarchical way with which governments operate is very inef-fective in dealing with the high levels of complexity encountered at the lower levels of the society. They suggest that the way we govern ourselves needs to change to allow us to cope with the complexity of our society and that of the environment in which we live.
Stafford Beer, a teacher and colleague to both Espinosa and Walker, was a pioneer opera-tional researcher and cybernetician who observed that the top-down approaches that govern-ments use are not adept to handle the intricacy of societies’ problems. Beer suggests to take a look at the natural world for successful examples of survival under complex conditions [9, 79]. He took inspiration from systems theory.
A system is a set of parts or elements that is coherently interconnected and organised in such a way that its structure leads to a characteristic set of behaviours. These are often the less obvious outcomes of the actions and are considered the function of the system; the system is more than the sum of its individual parts. Once the relationship between the structure and function of the system is understood, we can make inferences about how the system performs to tackle the tasks it undertakes and more importantly how it can improve this mechanism to produce better results. Systems, whether small or large, can behave in similar ways and in understanding these similarities or even differences we are taking the first step in making any lasting changes to the systems in which we are embedded [53]. The Earth
itself is a system made of many “living systems nested and embedded within smaller or larger systems” [29, 53], which are all expert in coping with the high level of complexity of their environment by self-regulating and adapting to any changes either externally or internally induced [89]. Human societies can learn a lot from the fundamental principles of governance in the systems of the natural world.
2.4
Seeking Sustainability in an age of complexity
Modelling communities as complex systems can help us understand how they evolved to the live structures we have today and thus help us manage their complexity. Stafford Beer was a pioneer operational research theorist and one of the first academics to apply complexity theory to the notion of sustainability. He explained that one needs to manage the complexity of a system in order for the system to become more sustainable and by using Ashby’s Law of requisite Variety3 [1] he concludes that the right structures need to be in place to assist in managing the variety of the system. From this cybernetic4viewpoint the government has the role of the facilitator of change that emerges from actions at the local level [29]. Policy making in this respect is created with the view of enabling this change.
Beer developed the Viable Systems Model inspired by the brain and how it works perfectly as an autonomous system whose recursive organisational structure enables it to function in an ever changing environment. This model is in fact applicable to governments and institutions within the society, where they are viewed as recursive self-organising systems 3Ashby’s Law of Requisite Variety states that for a system to reach stability it must have a greater number
of states in its control mechanism than the states that exist in the system that need to be controlled [1].
4Cybernetics stems from the Greek verbκυβερνάω(kybernáo) meaning to steer or govern; it was coined
by Norbert Wiener in 1948 to describe the transdisciplinarry approach exploring the structure and dynamics of systems and "the scientific study of control and communication in the animal and the machine" [96].
2.4 Seeking Sustainability in an age of complexity 43
that evolve in direct communication with each other and the environment in which they live in [9, 29].
The Viable Systems Model was applied successfully in at least two cases to map and manage the complexity of the countries of Columbia in 1998, in order to provide an intervention in the management of public performance, and Chile in 1972, to put in place a regulatory system for the social economy and mitigate the economic crisis that Chile was facing at the time. The latter example is of great importance as it enabled each nested system in the social economy to be self-regulated and autonomous to make decisions, whilst being updated in real time on information from different levels of the economy that it might affect or be affected by. This real time information sharing on all nested systems in the economy made Chile the most advanced government at the time and even makes current methods of governance envious. Sadly, the military coup on the 11th of September 1973 brought this to an end and the hi-tech operations room, where economic information was received and used for making quick decisions, was destroyed.
Perhaps the most powerful lesson learned from this cybernetic approach to governance is that nested systems should be allowed to be self-regulatory with information sharing at all levels and one must build the capacity to act proactively in decision making and respond to change effectively and in a timely manner. A myriad of examples of systems with change and adaptation at their core comes from complexity theory. In complex systems, the in-teractions and feedback between individuals, communities and the environment allow for greater flexibility and adaptation [37, 60]. At this stage it is vital to take a step back to see what we can learn from complex systems, which are either sustainable or unsustainable, and investigate how they organise themselves and how they operate to survive in their ever changing world.
2.5
Summary
The Earth is a unique planet that self-regulates and provides a nurturing environment for all its living organisms. Humans are now the dominant species on Earth and have evolved to be the main planetary engineers, whose actions can cause irreplaceable damages to the other organisms and the Earth itself.
Sustainability, the ability to meet the needs of the present without compromising the ability of future generations to meet their needs [11], goes beyond environmental protection and sits at the crossroads between concerns for the global environment and global social justice. A sustainable development path is needed to sustain human progress into the distant future; it is not a fixed state and thus not a straight forward process as the sustainability in the macroscale really depends on the decisions that individuals take in the microscale.
Governments and international agencies are struggling to find and implement a long-term solution to all the problems that are arising due to our unsustainable ways of living. This is because they are attacking each problem individually instead of viewing human sustainabil-ity as a problem concerning the nature of society and the way it is organised. The top-down approaches that governments and international agencies use are not adept at handling the intricacy of the problem and thus (complex) systems’ theory is proposed as an alternative approach.
The natural world is made up of systems and the Earth itself is a system made of many smaller living systems. Therefore, human societies can learn a lot from the fundamental principles of governance in the systems of the natural world. By modelling communities as complex systems we can understand, and thus manage the complexity of the problems we
2.5 Summary 45 are facing. Με το βουνό θα γίνω φίλος και με τα πεύκα σύντροφος. Κι όταν θα κλαίω και πονώ θ΄ αναστενάζει το βουνό. Ευάγγελος Πρέκας5 5
Translation: I will become friends with the mountain, and a companion of the pine trees. So that when I cry and suffer, the mountain will sigh.
Chapter 3
Complexity and Networks
3.1
Reductionism Limitations
Reductionism is the philosophical belief that a system is nothing more than the sum of its individual parts. In the philosophical text A Discourse on the Method, René Descartes [23], a mathematician of the 17th century and also a prime practitioner of the reductionist approach laid out his scientific method in four steps:
1. “never accept anything for true” unless you prove it yourself
2. “divide each of the difficulties under examination into as many parts as possible, and as might be necessary for its adequate solution”
3. direct the “thoughts in such an order that, by commencing with objects the simplest and easiest to know, I might ascend by little and little, and, as it were, step by step, to
the knowledge of the more complex”
4. review the long chain of argument frequently to make sure nothing was omitted.
This four step process to the scientific method summarises the predominant approach to science until the beginning of the twentieth century. Scientists believed that they can draw firm conclusions about a system by simply understanding the mechanisms and purpose of its individual constituents, and have thus looked for the reductionist reasoning of all natural phenomena from the proven theories of fundamental physics. Sure enough, the application of the underlying principles of fundamental physics was very fruitful in explaining much of the phenomena scientists observed, with the only shortcomings appearing when scientists tried to apply these to the “complex phenomena closest to our human-scale concerns” [54].
Examples in which the reductionism approach has failed can be found all around us: from the way the actions of neurons give rise to the intricate behaviours in the brain, to the way colonies of millions of ants self-organise without the need of a central conductor to perform a particular task and the unpredictable behaviour of human societies in the political and economic domain. What is common in all of these examples is that we observe a complex behaviour that arises from the often simple interactions of a large number of components. In response to the shortcomings of reductionism theory the scientific community started leaning towards the idea that understanding the role of individual parts of a system does not necessarily help you predict the behaviour of a system. Scientists started coming together to look for interdisciplinary approaches to the problems they faced. As a result, new fields were created and old fields were looked at with fresh eyes which enabled science to go beyond the reductionist approach and start solving problems closer to our human scale concern in biology, economics and sociology [54]; a small list of these fields includes systems science and cybernetics which led the way to complex systems, or complexity science, and network
3.2 Complexity Science 49
theory.
There are clear limitations to our knowledge of the underlying systems and all the myriad of feedback loops that cause the intrinsic behaviours observed, so a reductionist approach is impossible. If one wants to know more about the system and obtain quantitative infor-mation about it then a complexity approach is needed. To solve the most difficult problems of our generation such as sustainability, disease spreading and climate change one needs transdisciplinary methods to understand and explain the complexity.
3.2
Complexity Science
The word complexity takes its roots from the latin wordcomplexusthat means to embrace, or comprise of different intertwined elements [19]. A complex system is one consisting of many individual parts with often simple behaviour that are intricately interwoven in a non-linear manner that causes surprising emergent behaviours and patterns.
Complexity science is an interdisciplinary area of research with the aim of building a uni-versal understanding of the characteristics that cause the emergent behaviours arising from the actions of large collections of simple entities, which self-organise into a collective whole that is more than the sum its parts [16]. The plethora of complex systems that exist in nature and the natural world, such as insect colonies, economies and the Earth, make this a fun yet non-trivial task.
3.2.1
Insect Colonies
Social insect colonies are nature’s oldest and most successful complex systems. A single army ant has one of the simplest behaviours observed in nature, it will walk around looking for food, fight enemies and respond to chemical signals. Even in large numbers, say in the order of a hundred, ants exhibit behaviour that is aberrant and not worthy of special note; they will simply walk around aimlessly until they exhaust themselves to, literally, death [31]. Surprisingly, in extremely large numbers in the order of a hundred thousand the Ecitonarmy ants can manage unimaginable things like transport large prey back in time for winter, traverse a tropical rainforest with perfect sense of direction and build long bridges using their bodies to allow other members of their colony to cross difficult terrain. They have biologically evolved to do this by utilising intelligence that has arisen as a property of collective cooperation and communication [31, 35] and only because it increases their probability of survivability as a species.
Ants are highly social, just like humans, and have evolved into “creatures with such an enormous contrast between their individual simplicity and their collective sophistication” [54]. They have been around for an estimated 140 million years [39] in comparison to homo sapiens 0.25 million years. In relative terms, if ants have been around for 1 day, humans have existed for a mere 2 minutes and 34 seconds. In addition, the biomass of ants is estimated to be roughly equal to the biomass of humans [18, 39]. Scientists have made substantial progress in understanding how social insects be it ants, bees or even humans -work as a team [58], divide labour [76] and communicate [18, 75, 76], but cannot to this day fully explain exactly how their individual or collective behaviour came to be. Humans still have a lot to learn about complex systems and sustainability from taking a peek into insect colonies.
3.2 Complexity Science 51
3.2.2
Economies
Economies are human made complex systems that have evolved over time to the structures we see today. They are made of simple economic entities - be it companies or individuals - who are producing or consuming goods. At the microscale, these entities are simply trying to increase their profits by gathering relevant information about the behaviour of other entities within the economy. At large numbers this behaviour becomes very complex and leads to the unpredictable behaviour of markets and fluctuations in prices and production of goods. Ideally, according to macroeconomic theory, the self-organising property of markets that emerges from the microscopic interactions of the companies and individuals should pull the economy into an equilibrium [54] and changes in production/consumption should be perfectly off-set by changes in the price of goods so that nobody is better off as a result of these fluctuations.
Real-world economies are seldom in equilibrium, and thus economists are always interested in what breaks this theory and makes economies inefficient. A complex systems approach to economics seems appropriate based on the description of complex systems observed else-where, namely that simple intricately connected components in the microscale lead to un-expected patterns in the macroscale, which in this case are global shocks to the economy, bubbles and subsequent crashes.
Another very relevant view is that the economy is in fact embedded in social networks [10, 36]. The personal links between the entities in the economy is of equal or at times higher importance than general economic transactions, mainly because these are not occur-ring solely between independent and impartial individuals but in fact between social entities that are connected over space and time. Analysing the structure and dynamics of the social
networks between individuals and companies in the economy can give an insight into the behaviour of their transactions.
3.2.3
The Earth
The Earth is a complicated complex system composed of many interacting components, many of them which are interconnected subsystems themselves. These include natural sys-tems, like the atmosphere and biosphere, and also socio-economic systems like the ones discussed above. The Earth system is particularly difficult to predict for two key reasons. Firstly, it is dominated by the non-linear interactions that exist both within and between its components [95]. Secondly, the unpredictable human behaviour plays an integral part in how the system changes.
Humans play a powerful role within the Earth system; their large numbers and span of activities creates enormous complexity in the system as a whole making it difficult, or even impossible, to predict exactly the outcomes of the ever increasing pressure on the system. Their deep embeddedness and interconnectivity can have a great impact on the system and cause changes which unfortunately are not uniformly distributed, meaning that some parts of the Earth and some people are affected disproportionally too much.
Change in the Earth systems occurs in a non-linear manner, where feedback loops can either reinforce chance or completely dampen it [80]. To prevent negative change, be it social, eco-nomic or environmental, one must investigate and understand the Earth system as a whole, including the intricate interweaved connections between its components [95]. Therefore, the traditional top-down approaches to problem solving will fall short here as they are not
flex-3.3 Adaptability of Complex Systems 53
ible enough to address these non-linear changes. After two decades of tackling sustainable development issues ineffectively, by targeting what we thought were isolated issues [29, 95], it is now time to integrate complex systems thinking into any sustainability conversations and decision-making processes.
3.3
Adaptability of Complex Systems
Simple systems can be broken down using a reductionist approach and their structure and dynamics can both be pinned down exactly. Their behaviour is predictable and can be calculated exactly by using simple cause and effect. Simple systems are mostly closed systems, which do not interact with their surroundings and thus do not need change in response to external factors.
Complex systems are made of many entities, some of which can be smaller nested systems. Above we saw how the Earth can be broadly broken down into natural systems, such as the atoms, oceans and ant colonies, or socio-economic systems like the economy, cities and political systems. These are all inter-connected meaning that they share information and influence the development of one another [95]. Adaptation is fundamental, as changing their behaviour increases their survivability [54].
In socio-economic systems a key component is humans, as their activities impose bound-aries, structure, laws and other rules. The individuals embedded within the systems have the ability to think about their behaviours, reflect on their actions and change in response [37, 95] to what they think the best course of action is: a crisis can turn into a learning opportunity.
3.4
Emergence
Emergent behaviour has appeared a few times throughout this thesis already, in the examples of social insect colonies, economies and the Earth [2]. In all of these examples, simple rules on the individual components on the microscale level lead to complex, unexpected patterns seen in the system as a whole in the macroscale level [54]. The primary cause that gives rise to the emergent behaviour is the intricate underlying connections between the individual entities that cause long spacial and temporal correlations in the system. This means that the emergent properties are not predictable from even complete information of the microscopic entities [37], since the system cannot be broken down into non-interacting linear parts that are not sensitive to their environment.
The non-linear interactions and sensitivity to the environment are in fact the essential condi-tions for emergence [37, 95] and they exist both within and across all the complex systems of interest with respect to sustainability, such as the environment, the economy, society and even government and other institutions. A more formal method of analysing and under-standing these interactions is key to underunder-standing the emergent behaviour of the system as a whole.
3.5
Network Science
Most things in the world can be represented as pair-wise interactions between elements in the system. Mathematically the interactions are represented by links (also known as edges), the elements are represented by nodes (also known as vertices) and the collection of these
3.5 Network Science 55
is called a network [59]. It should be of no surprise that examples of real world networks are found all around us, including neural networks in the brain, airline flight routes, social media friendships or even all the routers that together make up the backbone of the Internet [92]. Social communities are networks whose nodes are people or sometimes groups of people and can have many different types of relationships between them that are of interest to our sustainability or even survival, such as identifying and analysing terrorist networks as a matter of national security [73, 74, 97].
The structure of networks has been studied in isolation by many fields for hundreds of years, in the context that was appropriate in their respective discipline. For example, in mathematics networks takes the form of graph theory [84], in epidemiology it is disease spreading due to direct person-person interactions [15] and in economics it is the spread of technological advancement and expertise across businesses [12, 54]. Over the last two decades, researchers have been coming together to investigate networks of all forms, to find a set on unifying principles that apply to them and develop methods by which to analyse them. This is what now has developed into the science of networks [59].
Common language was created to consolidate the existing work on networks stemming from different fields and allow for better communication between researchers. Some of the most important network terms, that will appear elsewhere in this thesis, will be introduced here; to assist in this task I created the social network of the people (nodes) mentioned in my acknowledgements, numbered in order of appearance in the text, see Fig. 3.1.
Clusteringrefers to the tendency nodes have to create separate communities within a net-work. In my acknowledgement social network (Fig. 3.1) there is a clear divide between my academic (grey) friends and all others.
Figure 3.1 Network of acknowledgements. The social network of the individuals in the acknowledgements section, where nodes are numbered in order of appearance in the text and coloured according to whether they are family (red), academics (grey) and close friends (blue). The average path length is 1.86 and the average degree is 9.3. Node 6 is a hub node, as it is connected to 70% of the other nodes in the network and its degree (22), greatly exceeds the average. It also has the highest betweenness centrality (166), which means that it acts as the predominant bridge along the shortest path between most pairs of nodes.
The degree of a node is the number of links the node is attached to. Accumulating all of these together allows for a degree distribution to be defined.Hubsare high-degree nodes that have an important role in propagating information across the entire network. For example, in Fig. 3.1 node 6 is connected to 70% of the nodes and its degree (22) greatly exceeds the average degree (9.3) of the network.
3.5 Network Science 57
The path length is the shortest distance between two nodes, which is calculated by the number of links that you need to traverse to get from one to the other. And thus, theaverage path lengthis simply the average over all pairs of nodes. In the network shown in Fig. 3.1, the average path length is 1.86 implying that on average you can get from one node to another using less than two edges. Thebetweenness centralityof a given node is the times a node acts as a bridge along the shortest path between two other nodes and is normalised over the total number of shortest paths between all pairs of nodes. Effectively, nodes with high betweenness centrality typically act as bridges between clusters. Unsurprisingly, given its degree, node 6 in the acknowledgement network is the most central with a betweenness centrality of 166 and is the main link between the clusters. Centrality measures, like degree and betweenness, aim to identify key nodes based on their relationship with other nodes in the network.
Most real world networks studied thus far, whether they are social, natural or technolog-ical, seem to have similar characteristics: high-clustering, scale-free degree distributions and hubs [54]. Scale-freenetworks have power-law degree distributions, i.e. they can be expressed according to
P(k) ∼ k−γ, (3.1)
whereγ is the scale-free exponent. The distribution is self-similar, meaning that it has the same shape whether you have a thousand nodes or a million nodes, and hence they do not have a characteristic scale.
Popular scale-free networks are the World Wide Web, social networks and networks of businesses. It is thought that they have developed into this interesting structure because they grew into this shape with preferential attachment, meaning that new nodes entering the network prefer to attach themselves to higher-degree nodes already in the network. This
increases the survivability of the node in a new environment. Some of these concepts will be re-iterated in Chapter 6, where the real-world network between firms of an economy will be introduced.
3.6
Summary
Reductionism was the main approach to all scientific problems and proved very success-ful until it was applied to human-scale phenomena. Scientists believed that nothing was more than the sum of its parts, and thus it could be broken down to its individual compo-nents, studied separately and then put back together to draw conclusions about the whole. The common denominator in all the cases where reductionism has failed is that a complex behaviour arises as a result of the often simple interactions of a large number of compo-nents, such as the unpredictable behaviour of human societies in the political and economic domain.
Such systems are called complex systems and complexity science is the transdisciplinary discipline that has been given as an appropriate method for their scientific investigation. Its sole purpose is to build a universal understanding of how large collections of simple entities self-organise into a collective whole that is more than the sum its parts [16]. Many examples of complex systems exist in nature, such as ant colonies that self-organise to take care of their brood, economies that have unpredictable market behaviours and the Earth that is affected disproportionately by the actions of man.
The entities in complex systems are all inter-connected and therefore, they can use infor-mation, and, in some cases, evolve and learn. In socio-economic systems, for example, the
3.6 Summary 59
individuals embedded within th