ACO and SVM Selection Feature Weighting of Network
Intrusion Detection Method
Wang Xingzhu
Furong College Hunan, University of Arts and Science, Hunan Changde,
415000, China
[email protected]
Abstract
Feature selection and classifier design is the key to network intrusion detection. In order to improve network intrusion detection rate for feature selection problem, this paper proposed a network intrusion detection method (ACO-FS -SVM) combining ant colony algorithm to select the features with a feature weighting SVM. First, the use of support vector machine classification accuracy and feature subset dimension construct a comprehensive fitness weighting index. Then use the ant colony algorithm for global optimization and multiple search capabilities to achieve optimal solutions feature subset search feature. And then selected the key feature of network data and calculated information gain access to various features weights and heavy weights to build support vector machine classifier based on the characteristics of network attacks right. At last, refine the final design of the local search methods to make the feature selection results without redundant features while improve the convergence resistance, and verify the data set by KDD1999 effectiveness of the algorithm. The results show that ACO-FS-SVM can effectively reduce the dimension of features, and have improved network intrusion detection accuracy and detection speed.
Keywords: Feature Selection, Feature Weighting, Ant Colony Optimization Algorithm, Support Vector Machines, Network Intrusion Detection
1. Introduction
In recent years, the Internet scale growing, coupled with its open, non-executives and undefended, the complex network intrusions, the number of intrusions and the growing degree of harm, network intrusion detection has been the focus of network security defense research[1]. With the rapid development of information technology, government departments, research institutions, enterprises, business organizations’ dependence of information system is growing, and threats facing information security is also increasing. Traditional information security technology has been unable to meet the requirements of modern information security. Information security situation assessment (information Security Situation Awareness, ISSA) came into being. On the basis of the integration of information security elements in macroscopic real-time assess the security situation of information, and it can estimate the development trend [2].
Network intrusion detection is a pattern recognition classification problems, including feature selection, classifier selection and optimization modules. Network data is very complex, with a high dimensional feature. The feature set contains some redundant features and useless features, which will increase the model training time and computational complexity, and have a negative impact intrusion detection results[3]. To this end, before network intrusion detection modeling, it often used the feature selection algorithm to select beneficial feature subset of test results, in order to reduce the feature dimension. There are main sequence search algorithm, based on principal component
analysis, genetic algorithms, particle swarm optimization and other feature selection method [3,4]. In addition to the feature subset selection, network intrusion detection results are also closely related to the classifier and parameter. The current network intrusion detection model is mainly Bayesian networks, neural networks and support vector machines and other non-linear classification algorithm[5,6]. Because the network intrusion detection is a large sample classification problem, SVM training is slow for large sample, not conducive to real-time and online network intrusion detection. Neural network does not require prior knowledge, it can be non-linear, unlimited approximation for the system, especially radial basis function RBF(Radial Basis Function). Neural network has the advantages of simple structure, fast learning, etc., which have been in network intrusion detection widely used[7]. In practical applications, RBF neural network classification performance is closely related to its parameters. In order to obtain optimal performance network intrusion detection model, you need to select the most adapted RBF neural network parameters[8]. In some network intrusion detection model currently proposed, many of which are features subset and RBF neural network parameters separately. The selection sequence is not uncertain. So it usually adopts randomly determined way, which is difficult to obtain the optimal feature subset simultaneously and RBF neural network parameters. To get the best effect of network intrusion detection, feature selection and RBF neural network parameters should be carried out simultaneously. When the network intrusion modeling, feature selection and classifier design are critical, which will directly affect the network intrusion detection performance[9]. Since the original network intrusion signature contains a number of redundant features and test results from the "reactive" noise characteristics. If they are directly input to the classifier to learn, they have a negative impact on the rate of the attack detection, and the detection efficiency is reduced. So the need to choose the network intrusion detection results strongly related key features to reduce the feature dimension [10]. Network Intrusion classifier design is another important element in addition to outside of feature selection. Classifier will affect the final detection accuracy and computational complexity. There are currently used widely fisher linear discriminant (FLD), support vector machine (SVM) and neural network classifiers[11-13]. SVM is a machine learning algorithm based on statistical learning theory and structural risk minimization principle. According to the limited sample information in the model, it can find the best compromise between complexity and learning ability to gain better generalization ability. Through mapping can solve learning problems of high-dimensional space, with good generalization ability to overcome local minimum, the curse of dimensionality and other issues. It becomes the major network detection algorithm[14-15]. The traditional SVM algorithm assumes that all network intrusion feature have the same importance. But if the network data contains weak correlation with intrusion detection and even related features, it will affect the network intrusion classifier to some extent on the promotion ability, resulting in low precision study[16]. Feature weighting according to the different importance of the features, each feature gives a number [0,1] to indicate the importance of the feature, the more important features of the greater weight was given [17].
In order to increase network intrusion detection effect, the first ant colony optimization algorithm (ACO) to select features. And then we use the information gain algorithm to calculate the feature weight. Finally, a feature selection and weighted support vector machines (FS-SVM) network intrusion detection methods (ACO-FS-SVM) is proposed, which is on KDD CUP 99 data set to test the merits of the algorithm. The results show that, compared to other intrusion detection method, network intrusion detection rate and efficiency of ACO-FS-SVM has improved significantly.
2. ACO-FS-SVM Network Intrusion Detection Flow
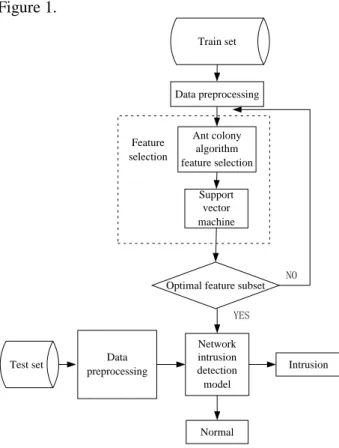
ACO-FS-SVM algorithm use wrapper feature to select model. It uses the automatic optimization capability ACO to global search in the feature space, gets a different combination of features. According to the results of SVM classification to determine the features of the combination of classification performance, and constantly update the selected feature sets, until the search results to obtain the best classification feature combination. First extract the characteristics of network status information, and then send into the ACO-FS-SVM classification feature selection module to select the best feature set for network intrusion detection. ACO-FS-SVM intrusion detection network flow model is shown in Figure 1.
Train set Test set Data preprocessing Ant colony algorithm feature selection Support vector machine Feature selection
Optimal feature subset
Data preprocessing Network intrusion detection model Normal Intrusion NO YES
Figure 1. The Working Flow of ACO-FS-SVM Network Intrusion Detection Model
3. ACO-FS-SVM Network Intrusion Detection Method
Ant Colony Optimization (ACO) is a collective intelligence algorithms, simulated ants foraging information exchange and mutual cooperation, with positive feedback, global search ability and distributed computing, etc. The time of the proposed algorithm is although late, but developed rapidly. It has been widely used in solving the TSP, job-shop scheduling, network route(Qos), knapsack and other aspects. And the simulation results show that ant colony algorithm has good results[18,19]. In network intrusion detection feature selection, the need for network intrusion detection features to be accessed as a place of ants, which will be converted feature optimization problem into a path search problem.
A. The Fitness Function Establishment
Network intrusion feature selection include two aspects: ①select features subset to make the network attack detection accuracy rate higher. ②the feature dimension as far as
possible smallest. But in fact a contradiction between the two. In order to make the balance, this research of fitness function is defined as:
( ) error (1 )d
f s P
D
(1) Where, d is the dimension of feature selection subset s. D is the dimension of candidate feature set. Perror is classification error rate. λ is the weighting coefficient of classification error rate.
The computational formula of weighting coefficient λ is 100 100 D x
(2) where, x presents the percentage of network intrusion detection reduced error rate when features increase one dimension(x%).
B. Feature weighting SVM
Use feature weighting kernel function constructed SVM, we call feature weighting SVM. Weighting function is weighted for one feature. The kernel function kp is defined as
( ,
)
(
T,
T)
p i j i j
k x x
k x P x P
(3) P is called feature weighting matrix, where Pii=ωi(1<i<n) means the weighting of ith feature. Generally speaking, ωi is not all equal. If an ωi=0, represents the kth feature has nothing to do with the output of the classifier.2 2 2 ( , ) exp( ) (( ) ( )) exp( i ) T T i j p i j T T i j j x P x P k x x x x PP x x (4)
Feature weighting support vector machine(FS-SVM) algorithm is described as follows.
, , 1 1 min 2 . . ( ( ) ) 1 0, 1, 2, , l i b i T i i i i T C s t y x b i l
(5)where, C>0 is a penalty parameter.
FS-SVM can be described as a quadratic programming problem. In the case of only the minimum required points, we can use the Lagrange multiplier method for solving minimum ωi: 1 1 1 ( , , , ) 2 ( ( ( ) ) 1 ) l T i i i i l T i i i i i L b C y x b
(6)where,
iis lagrange multipliers. Partial derivative
, b,
respectively, and make them equal 0. 0 0 ( ) 0 0 0 l i i i i l i i i i i i L y x L y b L Cs
(7)Put formula(13) into formula(12), get the dual problem of formula(11): 1 1 1 1 1 min ( , ) 2 . . 0; 0 ; 1, 2, , l l l i j i j i j j a i j j l i i i i y y K Px Px s t y C i l
(8)Solve the dual problem to get optimal decision function
1 ( ) sgn( ( , ) ) l i i i j i f x
y K Px Px b
(9)Network intrusion classification FW-SVM algorithm is as follows:
Step1: Collect network data training sample set {(x1,y1),…,(xi,yi)}, xi=(x1i,x2i,…,xdi) is a d-dimensional vector, yi∈(+1,-1), i=(1,…,l)
Step2: Select high-impact features by ACO.
Step3: Calculate weight value w of each feature method based on the information gain method, and construct its feature vector β=diag(β1,β2,…,βn)T .
Step4: Select the appropriate penalty parameter C> 0, according to formula (14) constructed and solved quadratic programming optimization problem, obtain the optimal solution for α=(α1,…,αl)T.
Step5: αj(0<αj<C) is a component of the α. (xi,xj) is its corresponding sample points. Calculated b, construct optimal classification Hyperplane(ω·x)+b=0, get network intrusion classification decision function: f(x)=sgn((ω·x)+b.
C. Determination of ants state transition probability
Feature is the nodes that each ant must go through. Each complete a cycle, an ant traverse all features. Each feature has a probability of selection, each of the ants through a feature node according to the selected characteristics of the probability to determine whether features are selected. Ants use feature selection probability, the greater the probability of selection feature , the greater the likelihood of being selected. The probability of ants from feature i to j is:
( ) ( ) , ( ) ( ) ( ) 0 ij ij k k ij is is t t j s tabu p t t t otherwise
(10)where,
ijis inspiring factor determined by the intrusion detection accuracy. The larger ij
is, the greater the ants move to feature j.
ij( )
t
is the pheromone from feature i to feature j at t time. Tabuk is the tabu list of ant k.In the state transition probability, α represents the weighting of pheromone, and β represents the weighting of inspiration factor. According to reference [11], α in this study is a constant, β is determined by the formula (11).
0 max
1
n
N
(11) Where, n is iterations. β0 is the initial value of inspiration factor weighting. Nmax is theD. Local Refine the Search Process
After k sub-set of ants important feature search, has got k important feature. In order to prevent some features of the network intrusion detection irrelevant or redundant features retained in the feature subset, search for the optimal feature uj in k feature to meet:
( j) min i,
i
F S S i (12) where U is for any feature subset ui, denote Si=Sm∪ui∪{fn}.
E. Update Pheromone in Path
Ant colony algorithm is mainly done through information feedback mechanism. The pheromone update mechanism has two kinds: local information and global information. The global information can speed up the search algorithm, to increase the global optimal feature probability. So each completed a search, each round of search path information concentration needs to be updated on every road, specific for
( 1) ( 1) ( ) k ij ij ij k k ij k n n Q F s
(13)Where, n is iterations. ρ is pheromones residual factor. k is the number of ants. F(sk) is
thefitness value. Q is the growth concentration of pheromone.
From pheromone update rule can know that, the smaller the fitness function of features subset, the higher the pheromone concentration is. Then it will attract more ants to the path search. To strengthen the impact of the optimal path, for pheromone increase additional incentive, namely:
*
(
)
ij ij optQ
F s
(14) where, F(sopt) is the fitness function for optimal feature subset in this round.The impact of ρ on the convergence of ant colony optimization algorithm is very obvious. The greater ρ is, the convergence is slow. but it is not easy to fall into local optimum. ρ is smaller, the algorithm converges fast but easy to fall into local optimum. In this study, based on references [8], ρ value is set to:
0 max
1
3
n
N
(15) where, ρ0 is the initial value of information residual factor.F. The ants Search Termination Condition
Under normal circumstances it is difficult to determine the dimensions of optimal feature subset. The study of ants search termination conditions is 3 consecutive increasing features, F(s) does not happen too much change, said the current round of search termination.
4. Simulation Test
A. Data Sources
The experimental data selected KDD CUP 99 data sets, and the data sets of data contained 41-dimensional features, 34 numeric fields and seven symbolic field. 41-dimensional features can be divided into four parts: the basic features of TCP
connections (1 ~ 9 No. features), content features of TC connections(10 to 22 No. features) , network traffic statistics feature based on time(23 to 31 No. features), network traffic statistics feature based on host (32 to 41 No. features) . The data set divided into four types of intrusions: Probe (scanning and detection), DoS (denial of service attack), U2R (unauthorized access to local super user) and R2L (unauthorized remote access), see Table 1. In P4 dual-core 2.8G CPU, 1G RAM, Windows XP operating system for the simulation environment, using VC ++ 6.0 algorithm
Table 1. The 41 Data Features of Network Connection
Basic features
Connections content features
Network traffic statistics feature based on time
Network traffic statistics feature based on host
1. duration C 10. hot C 23. count C 32. dst_host_count C
2. protocol_type D 11. num_failed_logins C 24. serror_rate C 33. dst_host_srv_count C
3.service D 12. logged_in D 25. rerror_rate C 34. dst_host_same_srv_rate C
4. src_bytes
13. num_compromised C
26. same_srv_rate C 35. dst_host_diff_srv_rate C
5. dst_bytes C 14. root_shell D 27. diff_srv_rate C 36. dst_host_same_src_port_rate C
6. flagD 15. su_attempted D 28. srv_count C 37. dst_host_srv_diff_host_rate C
7. land D 16. num_root C 29. srv_serror_rate C 38. dst_host_serror_rate C
8. wrong_fragment C
17. num_file_creations C
30. srv_rerror_rate C 39. dst_host_srv_serror_rate C
9. urgent C 18. num_shells C 31. srv_diff_host_rate C 40. dst_host_rerror_rate C
19. num_access_files C 41. dst_host_srv_rerror_rate C
20. num_outbound_cmds C
21. is_hot_login D 22. is_guest_login D
A. Results and Analysis
Performance comparison before and after feature selection
(1) Because the original data set is too large, a small portion of this was chosen as the experimental data of the data set. The training set of randomly selected 5000 and 1000 test set, and they are normalized characteristics, reduced into [0, 1] range.
(2) The training set is input to the SVM for training and test sets for testing. Feature selection before the intrusion detection results are obtained.
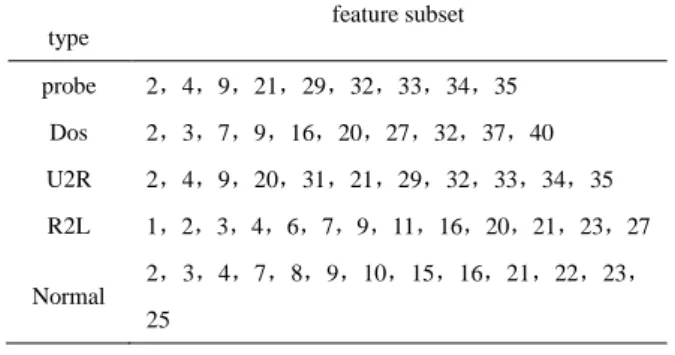
(3) The training set is input to the SVM. Use ACO algorithm combining SVM feature to select. Optimal features as shown in Table 2.
(4) According to the results of the step (3) feature selection for screening training set and testing set
(5) The step (4) obtained the training set put into the SVM for training and test sets for testing, intrusion detection result obtained after the feature selection.
Table 2. ACO Feature Selection intrusion type feature subset probe 2,4,9,21,29,32,33,34,35 Dos 2,3,7,9,16,20,27,32,37,40 U2R 2,4,9,20,31,21,29,32,33,34,35 R2L 1,2,3,4,6,7,9,11,16,20,21,23,27 Normal 2 ,3,4,7,8,9,10,15,16,21,22,23, 25
Using 5 experiments to take the average of the test results. It can obtain intrusion detection rates before and after feature selection are shown in Table 3, the running time shown in Table 4. As apparent from Table 3, the average rate of intrusion detection after feature selection network increased by 3.10% . The results show, feature selection can be more accurately depicts the network status change information, eliminated redundant and useless information. Intrusion detection performance of feature selection improved significantly.
Table 3. Comparative the Average Rate of a Intrusion Detection before and after Feature Selection (%)
Intrusion type Original features After selection features Increasing value probe 89.76 93.27 3.51 Dos 92.71 95.49 2.78 U2R 87.8 92.53 4.73 R2L 87.48 90.85 3.37 Normal 92.12 93.25 1.13 Average value 89.97 93.07 3.10
From Table 4, the feature selection greatly reduced run-time network intrusion detection model. It indicates that the network through ACO feature selection can be achieved by a number of key features, which eliminate unwanted features, reduce the number of SVM input dimension and computing time, speed up the detection speed. Network feature selection to meet real-time requirements can be more network intrusion detection.
Table 4. Comparison Running Time (ms) before and after Feature Selection
Intrusion type Original features After selection feature Reduction values Probe 32.00 23.88 8.12 DoS 23.51 17.99 5.52 U2R 7.78 4.99 2.79 R2L 5.27 3.84 1.43 Normal 10.55 6.89 3.66
Network intrusion performance comparison before and after feature weighting
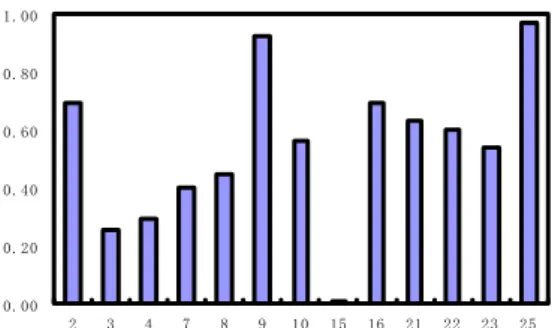
Firstly, use information gain method to calculate the weight of each feature, the results shown in Figure 3. And then deal with the weight of the feature and build weighted support vector machine classifier network intrusion, get test results are shown in Table 5.
0 0.1 0.2 0.3 0.4 0.5 0.6 0.7 0.8 0.9 1 2 4 9 21 29 32 33 34 35 权值 特征编号 Weight
The feature serial number
(a) The Probe feature subset weight distribution
0 0.2 0.4 0.6 0.8 1 2 3 7 9 16 20 27 32 37 40 权值 特征编号 Weight
The feature serial number
(b) The DoS feature subset weight distribution
0 0.2 0.4 0.6 0.8 1 2 4 9 20 31 21 29 32 33 34 35 权值 特征编号 Weight
The feature serial number
(c) The U2R feature subset weight distribution
0.00 0.20 0.40 0.60 0.80 1.00 1 2 3 4 6 7 9 11 16 20 21 23 27 权值 特征编号 Weight
The feature serial number
0.00 0.20 0.40 0.60 0.80 1.00 2 3 4 7 8 9 10 15 16 21 22 23 25 权值 特征编号 Weight
The feature serial number
(e) The Normal feature subset weight distribution
Figure 2. All Kinds of Invasion of the Feature Subset of Weight Distribution
From Table 5, under the same experimental conditions, the network intrusion detection methods ACO-FS-SVM, both in terms of time efficiency or network intrusion detection rates are higher than the original SVM method. Intrusion detection reached for Normal of 99.13%, which was mainly due to the increased value of the classification affect more significant characteristic quantities. The original in the network data samples near the classification surface is misclassified been corrected, and the original classified correct network data sample basically did not happen change. Therefore, by the weighting network intrusion of all kinds of intrusion detection accuracy have varying degrees increase.
Table 5. The Intrusion Detection Rate(%) Comparison before and after Weighting invasion type Before weighting (ACO- SVM) after weighting (ACO-FS-SVM) increasing value probe 93.27 98.46 5.19 Dos 95.49 97.09 1.6 U2R 92.53 98.68 6.15 R2L 90.85 98.56 7.71 Normal 93.25 99.13 5.88 average value 93.07 98.38 5.30
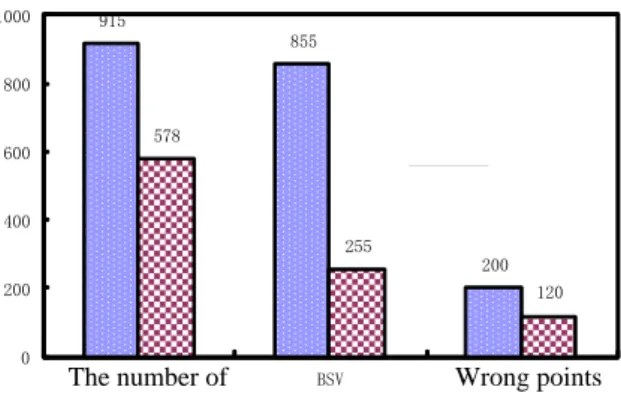
Because support vector (SV) can fully characterize the training dataset, the division of the set of SV equivalent to the division of the entire training data set. In order to further illustrate the effectiveness and advantages of ACO-FS-SVM, further comparative analysis of support vector set before and after the feature weighting, the results shown in Figure 3.
915 855 200 578 255 120 0 200 400 600 800 1000 支持向量数 BSV 错分样本数 加权前 加权后 The number of support vector Wrong points sample number
Figure 3. Support Vector Set Comparison before and after Feature Weighted
Figure 3 shows that after weighting, the total number of support vectors dropped from 915 to 578. It indicates that ACO-FS-SVM generalization is better, border support vector (bounded support vector, BSV) number dropped from 855 to 255, decreased by70.17%. Wrong points sample also declined dramatically. The result showed that before weighting, the data samples at the network boundary hyperplane are many. By weighting processing, significantly reducing the data samples in the classification of these networks polygon boundaries. It indicates that ACO -FS-SVM on feature weighted, can increase network intrusion detection.
5. Conclusion
For today's complex network robustness evaluation model only consider the robustness of the network topology and the defect of local effect of the failed node, so this paper proposes complex network function evaluation algorithm based on node efficiency. The algorithm overall consider the global influence of node failure, and use the efficiency of the node on network to define the load of each node, Limit load and failure model, with the rate of striking the ultimate failure nodes on network to measure the functionality of the network, the result of robustness experiment proofs: the algorithm is suitable for assessing the robustness of large-scale and small-world network function, the complexity of algorithm time is O (n2).
Acknowledgements
This work was supported by .Hunan Province Natural Science Foundation Project No. 14JJ2124.
References
[1] Andrew R,Peters G P, Lennox J. Approximation and regional aggregation in multi-regional input-output analysis for national carbon footprint accounting . Economic Systems Research, 2009, 21 (3): 311-335.
[2] Boyd J P,Fitzgerald W J,Mahutga M C,Smith D A. Computing continuous core/periphery structures for social relations data with MINRES/SVD, Social Networks, 2010, 32 (2): 125-137.
[3] Dietzenbacher E. More on Multipliers. Journal of Regional Science, 2005, 45 (2): 421-426,
[4] Holub H W,Schnabl H. Qualitative input-output analysis and structural information. Economic Modelling, 2012, 2(1): 67-73.
[5] Holub H W? Tappeiner G. A general qualitative technique for the comparison of economic structures. Quality & Quantity, 2010, 22 (3): 293-310.
[6] Kranich J. Agglomeration, vertical specialization, and the strength of industrial linkages. Papers in Regional Science, 2011, 90 (1): 159-178.
[7] Muhammad J. Mirza, Nadeem Anjum. Association of Moving Objects Across Visual Sensor Networks. Journal of Multimedia, Vol 7, No 1 (2012) pp. 2-8
[8] Phakpoom T. Clustering and Industrial Development: Evidence from Thailand. Nagoya University, 2011.
[9] Kwak S J,Yoo S H,Chang J I. The role of the maritime industry in the Korean national economy: an input-output analysis. Marine Policy, 2011, 29(4): 371-383.
[10]Labaj M. Qualitative input-output analysis and national innovation system in Slovakia. International Journal of Transitions and Innovation Systems, 2011, 1 (2): 105-116.
[11]Lahr M L,Mesnard L D. Biproportional Techniques in Input-Output Analysis: Table Updating and Structural Analysis. Economic Systems Research, 2009, 16 (2): 115-134.
[12]Lee S,Yooka S H,Kimb Y. Centrality measure of complex networks using biased random walks. The European Physical Journal, 2010, 68 (2): 277-281.
[13]Midmore P,Munday M,Roberts A. Assessing industry linkages using regional input-output tables. Regional Studies, 2006, 40 (3): 329-343.
[14]Muniz A S G,Raya A M,Carvajal C R. Core periphery valued models in input-output field: A scope from network theory. Regional Science, 2011, 90 (1): 111-121.
[15]OosterhavenJ, Cardenoso F E. A new method to estimate input-output tables by means of structural lags,tested on Spanish regions. Papers in Regional Science, 2011, 90 (4): 829-844.
[16]Roepke H,Adams D,Wiseman R. A new approach to the identification of industrial complexes using input-output data. Journal of Regional Science, 2000, 14 (1): 15-29
[17]S. Li, Y. Geng, J. He, K. Pahlavan,Analysis of Three-dimensional Maximum Likelihood Algorithm for Capsule Endoscopy Localization, 2012 5th International Conference on Biomedical Engineering and Informatics (BMEI), Chongqing, China Oct. 2012 (page 721-725)
[18]Y. Geng, J. He, H. Deng and K. Pahlavan, Modeling the Effect of Human Body on TOA Ranging for Indoor Human Tracking with Wrist Mounted Sensor, 16th International Symposium on Wireless Personal Multimedia Communications (WPMC), Atlantic City, NJ, Jun. 2013.
[19]San C J R,Biezma M V. The mining industry in the European Union: Analysis of inter-industry linkages using input-output analysis. Resources Policy, 2006, 31(1):1-6.
[20]Sanchez C J , Duarte R . Production Chains and Linkage Indicators. Economic Systems Research, 2003, 15 (4): 481-494.
Authors
Wang Xingzhu, male, was born in 1974, in Hunan province. He is an associate professor in Furong College Hunan, University of Arts and Science. His Main research area is network security.