Introduction
The increased demands for DNA sequencing services and greater volume of data have created a need for software designed to support sequencing activities and applications. Commercial data management systems, such as the Finch-Server (Geospiza Inc., Seattle, WA), provide laboratories with robust data processing and quality analysis tools designed specifically to support DNA sequencing. Even laboratories new to sequencing can implement these systems quickly to analyze projects and identify problem areas.
Data management systems offer a variety of benefits. Two immediate benefits are a decrease in cost and a shorter time to complete sequencing projects. Small increases in quality or read length can have a large impact on the number of sequencing reactions required to complete a project. Because the overall cost of a sequencing project is determined primarily by the number of reads, project costs are lowered when data management tools are used to detect and correct problems in a timely fashion. A later benefit to researchers is the ability to link sequence data to sample history. It is important to know, for example, if a sequence was obtained from a cloned DNA fragment or from a clinical sample that might contain a heterogeneous mixture of sequences.
Finch-Servers were designed to solve common problems and meet the data management requirements shared by many laboratories. This approach benefits customers because multiple users participate in the design, review, and testing process. Additional benefits include a shorter time frame from purchase to use and a more robust and adaptable system,
10
Geospiza’s Finch-Server: A
Complete Data Management
System for DNA Sequencing
Sandra Porter, Joe Slagel, and Todd Smith
Geospiza, Inc., Seattle, WA
DNA Sequencing: Optimizing the Process and Analysis Edited by Jan Kieleczawa
unlike custom systems that require a long development process and sig-nificant time investment on the part of the laboratory.
This chapter describes the software requirements of different types of sequencing laboratories and discusses how Finch-Servers help those laboratories meet their needs.
The Geospiza Finch-Server
A Finch-Server is a Web application with selected components of the Finch-Suite and a relational database management system (RDBMS), either Oracle (Redwood Shores, CA) or Solid (Mountain View, CA), installed on a computer with a UNIX or Linux operating system. Techni-cians and researchers use Web browsers such as Internet Explorer or Netscape to interact with the Finch-Server through a local intranet, or, in the case of geographically dispersed sites, over a secure Internet connec-tion. Finch-Servers operate either as stand-alone systems or within a dis-tributed computing environment.
Finch-Systems are Finch-Servers designed for different types of labo-ratories and different data processing requirements. Each Finch-System includes a Finch-Server along with selected components of the Finch-Suite, a set of integrated software modules designed to support data management and analysis. These include the: Sequencing Request Manager, Instrument Manager, Chromatogram Manager, Assembly Manager, Data Repository Manager, and Basic Local Alignment Sequence Tool (BLAST) Manager. Components of the Finch-Suite are organized within the Finch Core DNA Sequencing System (Figure 10.1), and the Finch Assembly and BLAST Systems (Figure 10.2). The Complete Finch DNA Sequencing System contains all of the Finch-Suite components.
Many laboratories need to store large numbers of data files and sequence assemblies. Customers have reported storing well over half a million chromatogram files in the Finch-Server and generating sequence assemblies from over 60,000 reads. These systems also provide a way for researchers to maintain their original, unprocessed data files, thus making it possible to apply new base-calling technology or other analysis tools to older data and data from varied sources. Storage media can be added to accommodate an increasing quantity of data over time. The Finch-Server, therefore, is able to provide a robust, scalable system, for storing chromatogram files, sequence assemblies, sequence databases, and BLAST results.
Much of the data stored in the Finch-Server are presented in tables that can be sorted by column. For example, one can easily sort reads by the number of vector clones by selecting the appropriate column heading. Customized data views also can be generated using data browsers that
quickly extract selected information. A laboratory manager might use the data browser to view all the sequencing runs performed with a certain instrument. A researcher setting up an assembly might select all of the reads from a genomic library that match E. coli and use the move icon to transfer them to a “trash” folder, thus keeping E. coli sequences out of the assembly.
Further, Finch-Servers store information in a relational database man-agement system, allowing users to obtain selected information in response to an SQL (Structured Query Language) statement. The capac-ity to perform customized queries using SQL and obtain customized reports and information is a powerful tool for additional research, process management, and project oversight.
Data Management for Core Facilities
Managing Sequencing RequestsCore laboratories in academic institutions and biotechnology companies have a variety of general and customized requirements that software systems must be able to meet. First, the laboratory’s customers need a con-venient method for submitting work requests. This is accomplished in the Finch-Server through Web forms that allow customers to make requests using their own desktop computers. Core lab customers use the Finch-Sequencing Request Manager to enter experimental information for experiments performed on different scales. This information is stored in the database, allowing retrieval at a later date. Web forms, designed to accommodate tubes, 96- or 384-well plates, or batch modes, simplify data entry and sample naming (Figure 10.1A). A configurable, automated naming system assigns unique names to each sample. For example, samples that are used for sequence assembly must be named in a certain way to be compatible with the Phrap assembly program (6). The Sequenc-ing Request Manager helps customers name samples appropriately with a minimal amount of extra work.
Sample Tracking
Service laboratories also require the ability to track samples through each stage of the sequencing process. Not only can laboratory personnel deter-mine where samples are located in a queue, the Finch-Server allows cus-tomers to monitor the status of their own samples over the Internet, saving time spent on the phone. At the end of the sequencing process, the Finch-Server simplifies data delivery. Customers can either view (and store) their data in the Finch-Server or download the data to their desktop computer.
Finch
(a) (b)
(g)
(c)
(e)
(d)
(f)
Figure 10.1.
The Finch Core DNA
Sequencing System.
(a)
A
web page fr
om the Finch-Sequencing Request Manager
. Part of the
form for submitting a r
equest to sequence samples fr
om a 96 well plate is shown. Single wells can be selected, or multiple well
s,
chosen by selecting column or r
o
w headings. (b) The Finch-Chr
omatogram Manager Folder Report. This r
eport summarizes quality
and selected statistics for all the r
eads in an individual folder
, including the number of sequences that match vector sequence
s,
E.
coli
, or other selected sequences. (c) The Chr
omatogram Details r eport, also fr om the Chr omatogram Manager . Quality scor es, fr om Phr ed, ar
e shown for each base in the r
ead, along with the sequence and other information. Links ar
e available for viewing the
trace
file (d) and/or downloading the data. (d)
A
chr
omatogram trace file together with a plot of Phr
ed quality scor
es. (e) The
Sequenc-ing Run Details r
eport fr
om the Finch-Instr
ument Manager
. The r
ead length (darker color) and sequence quality (light color) ar
e
shown on the y axis and the individual capillaries and/or lanes, on the x axis. The r
egularly r
epeating blocks of poor quality
samples
(indicated by a dark color) r
esult fr
om a plugged fang in the sequencing instr
ument. (f) The Instr
ument Capillary Usage r
eport.
A
verage sequence quality is r
epr
esented by colors ranging fr
om bright gr
een (best) to black (poor). Run dates ar
e shown at the
top,
fr
om right to left. Pr
oblem capillaries (or samples) ar
e shown by the black boxes in the first two columns. (g) The Finch Cor
e D
NA
Sequencing System overview
. Laboratories submit r
equests using the Sequencing Request Manager
. The lab uses the Instr
ument
Manager to set up sample sheets and downloads them to the sequencing instr
ument. Data ar
e loaded into the Chr
omatogram Manager
and the customers get the r
esults.
Security
Core facilities often have clients from different laboratories, making it important to control access to data. Customers, on the other hand, want to share data with collaborators and other members of their laboratory, yet simultaneously prevent data access by competitors. These require-ments are further complicated by the needs of the core facility. Personnel in the core facility must be able to view all of the data in order to monitor the quality of the laboratory’s work. This problem is solved in the Finch-Server with a user hierarchy that allows administrators and technicians wider access than the facility’s customers and assigns researchers to spe-cific lab groups. All researchers within a lab group are able to view data belonging to that group but are prevented from viewing data owned by others. Only the facility administrator can add or delete researchers from a lab group by the facility director. As a result, researchers can share data through the Web in a protected manner with their collaborators and selected colleagues, while laboratory personnel can monitor data quality without compromising proprietary information.
Preparation of Sample Sheets and Managing Instrument-Related Data After a customer has submitted a work request to a service laboratory, the laboratory needs to review requests and organize workflow. Technicians use the Finch Instrument Manager to create sample sheets in the Finch-Server by combining samples from different work requests to produce the optimum number of samples for each sequencing instrument. Finch-Servers support all of the widely used sequencing instruments, including those from ABI instruments (Applied Biosystems, Foster City, CA), the MegaBACE (Amersham, Piscataway, NJ), the Beckman CEQ2000 (Beckman, Fullerton, CA), and others. Laboratory technicians download sample sheets to their sequencing instrument and complete the sequenc-ing run. Instrument-related service information and serial numbers also can be stored in the Instrument Manager.
Management of Chromatogram Files and Quality Control
The Finch Chromatogram Manager provides a useful tool for storing sequences and chromatogram-related information. Chromatogram files from a completed sequencing run are uploaded and stored in the Chromatogram Manager. The Chromatogram Manager also can be used to store individual files or packages of related chromatogram files that have been downloaded from public or private databases through the Internet.
Chromatogram file data are checked by the Finch-Server during the upload process to prevent accidental loading of duplicate
chromatograms. This feature allowed one customer to diagnose an unsus-pected problem in their instrument software. The instrument software apparently created two files with different file names but identical chro-matogram data. This bug was confirmed when the customer checked with the instrument vendor. Once in the Finch-Server, the chromatogram files enter a data processing pipeline. Some of the steps in this pipeline include: base-calling, quality measurement, and quality trimming with either Phred (3–6), TraceTuner (Paracel, Inc.), or the KB base caller (Applied Biosystems); identification of vector sequences with Cross Match (6); and the generation of graphical reports that summarize run information and statistics for sets of sequences (examples are shown in Figure 10.1b–d). Data quality analysis can be customized using pipelines to select the base-caller depending on the sequencing instrument, or laboratory.
Sequencing Instrument Performance
Instrument reports provide feedback to laboratories about the status of each run and the performance of each sequencing instrument. Blocked liquid transfer devices or problem capillaries can be quickly identified by viewing graphical reports (Figure 10.1, e, f). The ability to monitor cap-illary performance for changes in data quality over time helps laborato-ries determine when instruments require service. Service information and identification numbers are easily stored in the Finch-Server, providing a means to quickly view the service and repair history for any sequencing instrument.
Billing
Shared facilities need to monitor use and bill customers accordingly, in a timely fashion. Billing numbers can be stored in the Finch-Server when work requests are submitted. Structured Query Language (SQL) state-ments can be used in conjunction with billing numbers or other identifi-cation, to generate reports that define how resources are used, the amount of work performed, who requested the work, and the request date. These reports can be generated automatically, through custom services, and delivered to accounting departments.
Data Management for Large-Scale Sequencing
Laboratories engaged in genomic and production sequencing need addi-tional features in a data management system. Production sequencing,
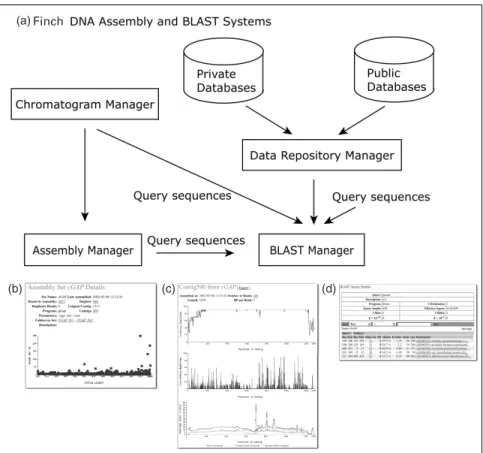
expressed sequence tags (ESTs) clustering, single-nucleotide polymor-phism (SNP) discovery, and genomic sequencing require the ability to assemble sequences; set up, maintain, and update sequence databases; pipelines can be designed specifically for automated data processing, fil-tering, and BLAST searches (1). These additional requirements can be met by stand-alone Finch systems, such as the Finch Assembly System and/or the Finch BLAST System; or with the Complete Finch DNA Sequencing System, which includes all of the components of the core system in addi-tion to the Finch-Assembly Manager, the Finch-Data Repository Manager, and the Finch-BLAST Manager. An overview of these components is shown in Figure 10.2.
DNA Sequence Assembly
The Finch-Assembly Manager works with the Chromatogram Manager to assemble sets of reads into longer, contiguous sequences. Folders with specific sets of reads are created and organized in the Chromatogram Manager. To assemble sequences, one chooses the appropriate folder and assembly program, and presses a button to start the assembly. The Assem-bly Manager provides different options for sequence assemAssem-bly, including Phrap (http://www.phrap.org; Green, International Human Genome Sequencing Consortium, 2001), a parallel version, SPS-Phrap (Southwest Parallel Software, Albuquerque, NM, USA), or both.
The Finch-Server’s Relational Database Management System (RDBMS) stores all the parameters and details of the assembly, making it easy to repeat the assembly later with new or additional data. Sequence assemblies also can be treated as a type of experiment and performed with sets of sequences and different parameters. Becuase all of the assembly results and conditions are stored in the RDBMS, the optimum parameters are easily located for later work.
Phrap assembles reads by comparing pairs of sequences, locating overlapping regions, and using quality information from the base-caller to help reconstruct the original sequence. The assembly can be improved by incorporating additional information about each read. For example, Phrap qualities—those used to build the final contig—incorporate infor-mation about the relative orientation of each read, and the sequencing chemistry. If a base has been confirmed by an alternate method (sequenc-ing the opposite strand or us(sequenc-ing a different type of chemistry), Phrap assigns a higher quality value to the base at that position. The highest quality bases are used to build a mosaic, which represents the sequence of the contig.
Information from each assembly is provided in tables and graphical reports. Tables include information about the number of reads in each contig, the location where each read aligns, and links to the read sequence,
Finch (a)
(b) (c) (d)
Figure 10.2. The Finch-Assembly and BLAST Systems. (a) The
Finch-Assembly Manager uses read data, stored in the Chromatogram Manager, to set up sequence assemblies. The Finch-Data Repository Manager maintains current versions of public and private sequence databases. BLAST searches of selected databases are conducted with the Finch-BLAST Manager. Query sequences can be pasted in a form, uploaded from a file, or selected from either the Chromatogram Manager or the Assembly Manager. Data processing pipelines can be set up to perform queries in an automated fashion. (b) The Assembly Set Details report from the Assembly Manager. This report provides information from the assembly along with a graph showing the number of reads per kilobase (y axis) for differ-ent length contigs (x axis). (c) A contig report from the Assembly Manager shows the Phrap quality across the length of the contig (top), sequence discrepancies as a function of quality (middle), and the number of sequences mapping to each part of the contig (bottom). (d) A screenshot from the BLAST Manager shows BLAST parameters and a table with the results.
quality values, and trace file. Chimera reports are provided to help diag-nose experimental artifacts. If further information is needed, say the locations of potential deletion clones, the Phrap output file can be downloaded for viewing.
Figure 10.2 b and c show two of the Assembly Manager’s graphical reports. For this experiment, reads from several ESTs were obtained from the Washington University Genome Center (St. Louis, MO), stored in the Chromatogram Manager, and assembled with the Assembly Manager. A graph of the assembly results (Figure 10.2b) shows the number of reads per kb (y axis) versus the contig length (x axis). Because the reads used in this assembly were obtained from ESTs, sequences with a large number of reads/kb were likely to represent highly expressed genes, repetitive sequences, mitochondrial sequences, or ribosomal RNA. If these results were obtained from assembling reads from a genomic sequencing project, a large number of reads/kb might help flag problem contigs and find assembly problems due to repetitive sequences.
Graphical reports also provide an overview of the Phrap quality values for each contig, the coverage depth, and positions with discrepant bases. High-quality sequence discrepancies are a strong indicator of potential polymorphisms and valuable in SNP discovery (2).
Maintaining Updated Sequence Databases
Many companies and sequencing centers have found it helpful to main-tain local copies of sequence databases. Not only can the searches be faster when using local resources, data are protected because the searches are performed in a secure environment. Researchers don’t have to take risks with valuable information by sending proprietary sequences over the Internet. Further, local searches allow one to search proprietary or custom databases that aren’t available over the Internet.
To meet this need, Geospiza developed the Finch BLAST System (Figure 10.2), which allows researchers to maintain up-to-date versions of any sequence database and use BLAST as a search tool. The content in public and private sequence databases changes on a daily basis, making it difficult for companies and research institutions to keep local versions current. The Finch-Data Repository Manager operates through a command line interface and updates local copies of databases on a regular schedule. Users specify which sequence data to retrieve from remote or local sites and designate where the files should be stored. When new sequences are retrieved, databases are automatically updated and log files are generated. E-mail reports instantly notify users that updates have occurred. This system also enables researchers to maintain multiple data-bases and multiple versions of each database.
The Finch-BLAST Manager
The Finch-BLAST Manager is used to perform BLAST searches of either nucleotide or protein sequence databases (Figure 10.2d). Researchers can search one or more databases, concurrently, with single or multiple sequences. Several of the BLAST programs are available in the BLAST Manager, including blastn, blastp, blastx, tblastx, and tblastn. The BLAST manager stores the search results and parameters, thus allowing compar-isons to be made between database searches at different points of time.
Data processing pipelines can be employed by users to assemble reads stored in the Chromatogram Manager, and automated BLAST searches of selected databases performed with assembled sequences or individual reads. For example, a BLAST search can be carried out whenever updates occur in a specific database. BLAST can be employed also for quality control. In one example, a batch of clinical samples from polymerase chain reaction (PCR) assays was mixed up by a commercial sequencing lab. The problem was uncovered by constructing a custom database of the expected PCR products and comparing the reads with the expected prod-ucts using BLAST.
Filters also are available in the BLAST Manager that allow users to mask low complexity sequences that might obscure search results. Repeti-tive sequences can be masked by adding RepeatMasker (Geospiza, Inc., Seattle, WA, USA) to the system. The addition of filters permits users to set up powerful screening systems designed to enhance data mining, genome sequencing, SNP discovery, or other applications.
Data Management Over the Internet: iFinch
iFinch is a Finch-Server designed for individual researchers and/or smaller laboratories with short term sequencing projects. Subscriptions to iFinch allow small laboratories immediate access to integrated data man-agement tools without making a long-term investment. Unlike other Finch-Servers, Geospiza acts as the system administrator for iFinch, ensuring for example, that data are backed up on a regular basis, hard-ware is kept up to date, and that the system runs smoothly. Remote access allows laboratories to store data off-site, securely, minimizing the risk of data loss.
References
1. Altschul, S.F., Madden, T.L., Schäffer, A.A., et al. 1997. Gapped BLAST and PSI-BLAST: a new generation of protein database search programs. Nucleic Acids Res 25: 3389–3402.
2. Clifford R., Edmonson, M., Hu, Y., et al. 2000. Expression-based genetic/ physical maps of single-nucleotide polymorphisms identified by the cancer genome anatomy project. Genome Res 8: 1259–1265.
3. Ewing, B., and Green, P. 1998. Base-calling of automated sequencer traces using Phred. II. Error probabilities. Genome Res 8: 186–194.
4. Ewing, B., Hillier, L., Wendl, M.C., and Green, P. 1998. Base-calling of auto-mated sequencer traces using Phred. I. Accuracy assessment. Genome Res 8: 175–185.
5. Green, E. 2001. Strategies for the systematic sequencing of complex genomes. Nature Rev Genet 2: 573–583.
6. International Human Genome Sequencing Consortium. 2001. Initial sequenc-ing and analysis of the human genome. Nature 409: 813–958.