inspection
.
White Rose Research Online URL for this paper:
http://eprints.whiterose.ac.uk/128371/
Article:
Pajouh, H.H., Dehghantanha, A. orcid.org/0000-0002-9294-7554, Khayami, R. et al. (1
more author) (2017) Intelligent OS X malware threat detection with code inspection.
Journal of Computer Virology and Hacking Techniques. ISSN 2274-2042
https://doi.org/10.1007/s11416-017-0307-5
promoting access to
White Rose research papers
[email protected] http://eprints.whiterose.ac.uk/
DOI 10.1007/s11416-017-0307-5 O R I G I NA L PA P E R
Intelligent OS X malware threat detection with code inspection
Hamed Haddad Pajouh1 · Ali Dehghantanha2 · Raouf Khayami1 ·Kim-Kwang Raymond Choo3,4
Received: 31 July 2017 / Accepted: 27 September 2017 © The Author(s) 2017. This article is an open access publication
Abstract With the increasing market share of Mac OS X operating system, there is a corresponding increase in the number of malicious programs (malware) designed to exploit vulnerabilities on Mac OS X platforms. However, existing manual and heuristic OS X malware detection techniques are not capable of coping with such a high rate of malware. While machine learning techniques offer promising results in automated detection of Windows and Android malware, there have been limited efforts in extending them to OS X malware detection. In this paper, we propose a supervised machine learning model. The model applies kernel base Sup-port Vector Machine and a novel weighting measure based on application library calls to detect OS X malware. For training and evaluating the model, a dataset with a combination of 152 malware and 450 benign were created. Using common super-vised Machine Learning algorithm on the dataset, we obtain
B
Ali Dehghantanha[email protected] Hamed Haddad Pajouh [email protected] Raouf Khayami [email protected] Kim-Kwang Raymond Choo [email protected]
1 Department of Computer Engineering and Information,
Technology, Shiraz University of Technology, Shiraz, Iran
2 School of Computing, Science and Engineering, University of
Salford, Salford, UK
3 Department of Information Systems and Cyber Security, The
University of Texas at San Antonio, San Antonio, TX 78249, USA
4 School of Information Technology and Mathematical
Sciences, University of South Australia, Adelaide, SA 5095, Australia
over 91% detection accuracy with 3.9% false alarm rate. We also utilize Synthetic Minority Over-sampling Technique (SMOTE) to create three synthetic datasets with different dis-tributions based on the refined version of collected dataset to investigate impact of different sample sizes on accuracy of malware detection. Using SMOTE datasets we could achieve over 96% detection accuracy and false alarm of less than 4%. All malware classification experiments are tested using cross validation technique. Our results reflect that increasing sam-ple size in synthetic datasets has direct positive effect on detection accuracy while increases false alarm rate in com-pare to the original dataset.
Keywords OS X malware detection·RBF–SVM·Mach-O· Supervised classification·Cyber threat intelligence
1 Introduction
Malicious softwares (malware) are a serious threat to the security of computing systems [1,2]. Kaspersky and Labs alone detected more than 121,262,075 unique malware in 2015 [3] while Panda Labs predicted that half of security issues are directly related to malware infections [4], McAffe reported a rise of 744% OS X malware over 2015 in 2016 [5]. The increasing Mac OS X market size (second after Microsoft Windows [6] and its fast adoption rate motivate cyber threat actors to shift their focus to developing OS X malware. The “myth” that OS X is a more secure system only further increases malware success rate. For example, OS X Flashback Trojan successfully infected over 700,000 machines in 2012 [7].
Security researchers have developed a wide range of anti-malware tools and anti-malware detection techniques in their battle against the ever increasing malware and potentially
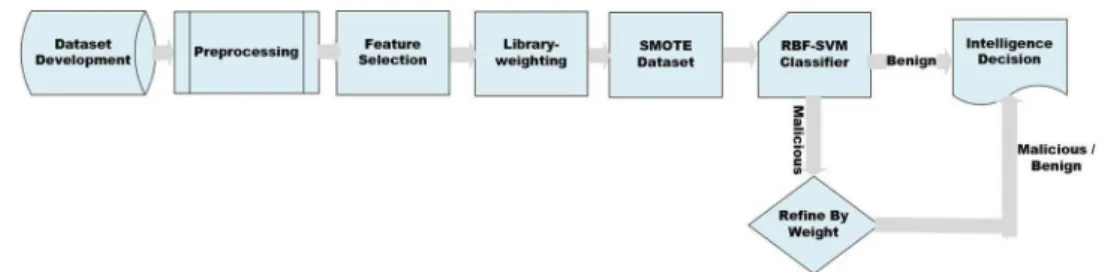
Fig. 1 Research methodology
malicious programs, including approaches based on super-vised and unsupersuper-vised machine learning techniques for malware detection [7]. In approaches using supervised tech-niques, tagged datasets of malicious and benign programs are required for training. Approaches using unsupervised tech-niques generally do not require the separation of malware and goodware, and programs are generally classified based on observable similarities or differences [8].
While there have been promising results on the use of machine learning in Windows and Android malware detec-tion [9,10], there has been no prior work on using machine learning for OS X malware detection. This could be, per-haps, due to the lack of a suitable research dataset and the difficulties in collecting OS X malware.
In this paper, we propose a machine learning model to detect OS X malware based on the Radial Base Function (RBF) in the SVM technique. This provides us a novel mea-sure based on application’s library calling to detect malware from benign samples. We then propose a new weighting mea-sure for classifying OS X goodware and malware based on the frequency of library calling. This measure weights each library based on its frequency of occurrence in malware and benign applications.
These datasets are then evaluated using four main clas-sification techniques, namely: Nave Bayes, Bayesian Net, Multi Layer Perceptron (MLP), Decision Tree-J48, and Weighted Radial Basis Function Kernels-Based Support Vector Machine (Weighted-RBFSVM). The following per-formance indicators are used for evaluating the perper-formance of our machine learning classifiers:
True Positive (TP): shows the ratio of goodware classified as benign;
True Negative (TN): shows the ratio of malware correctly detected as malware;
False Positive (FP): shows that the ratio of malware files identified as benign; and
False Negative (FN): shows the ratio of goodware classified as malware.
Accuracy (ACC): measures the ratio that a classifier cor-rectly detected malware and benign samples (goodware), and is computed using following formula:
ACC= TP+TN
FN+TP+FP+TN (1)
The False Alarm Rate (FAR)is the rate that a classifier wrongly detected a goodware as malware and computed as:
FAR= FP
FP+TN (2)
Our research methodology is presented in Fig.1. The organization of this paper is as follows. Section 2 discusses related research, and Sect.3describes our dataset development. Sections4and5presents our malware classi-fication and a discussion of this work, respectively. Finally, we conclude in the last section.
2 Literature review
Machine learning techniques have been used for malware detection. Nauman et al. [11] used game-theoretic rough sets (GTRS) and information-theoretic rough sets (ITRS) to show that a three-way decision-making approach (acceptance, rejection and deferment) outperforms two-way (accept, reject) decision-making techniques in network flow analysis for Windows malware detection. Fattori et al. [12] devel-oped an unsupervised system-centric behavioral Windows malware detection model with reportedly 90% in accuracy. Their approach monitors interactions between applications and underlying Windows operating system for classifica-tion of malicious applicaclassifica-tions. Mohaisen et al. [13] proposed an unsupervised behavioral based (dynamic) Windows mal-ware classification technique by monitoring file system and memory interactions and achieved more than 98% preci-sion. Huda et al. [14] proposed a hybrid framework for malware detection based on programs interactions with Win-dows Application Program Interface (API) using Support Vector Machines (SVM) wrappers and statistical measures and obtained over 96% detection accuracy.
Nissim et al. [15] proposed an SVM-based Active Learn-ing framework to detect novel Windows malware usLearn-ing supervised learning with an average accuracy of 97%. Damodaran et al. [16] utilized Hidden Markov Models (HMMs) to trace APIs and Opcodes of Windows malware sequences and developed a fully dynamic approach for mal-ware detection based on API calls with over 90% accuracy. Mangialardo and Duarte [17] proposed a hybrid supervised
machine learning model using C5.0 and Random Forests (RF) algorithms with an accuracy of 93.00% for detecting Linux malware.
Due to the increasing use of smart devices such as Android and iOS devices, there has been a corresponding increase in the number of Android and iOS malware [18–20]. Suarez-Tangil et al. [21], for example, proposed an Android malware detection model. Yerima et al. [22] utilized ensemble learn-ing techniques for Android malware detection and reportedly had an accuracy rate between 97.33 and 99%, with a rela-tively low false alarm rate (less than 3%). Saracino et al. [23] designed a system called MADAM which is a host-based Android malware detection. The MADAM was evaluated using real world apps.
OS X malware has also been on the increase [24], but there is limited published research in OS X malware analysis and detection. For example, a small number of researchers have developed OS X malware and Rootkit detection tech-niques, and malware detectors by tracing suspicious activities in memory (like unwanted access, read, write and execute) [25–27]. However, applying machine learning to detect OS X malware is limited to the Walkup approach [28], which utilized Information Gain (IG) to select effective features for supervised classification of OS X malware. Hence, devel-opment of machine learning techniques for OS X malware detection is the gap that this paper seeks to contribute to.
3 Dataset development
As part of this research, we collected 152 malware samples from [29–31]. These samples were collected between Jan 2012 and June 2016 thus OS version which can run them are in following order: OS X 10.8 (Mountain Lion), 10.9 (Mavericks), 10.10(Yosemite) and 10.11(El Clapton). Dupli-cated samples were detected by performing a SHA-256 hash comparison and removed from the datasets. Known OS X malware such as WireLurker, MacVX, LaoShu, and Kitmos are among the malware in our dataset. Similar to previous datasets such as those of Masud et al. [32], in order to build a non-biased dataset for detecting malware as anomalous samples, we need at least 456 goodware (three times the number of malware, compared to the number of malware) in our datasets.
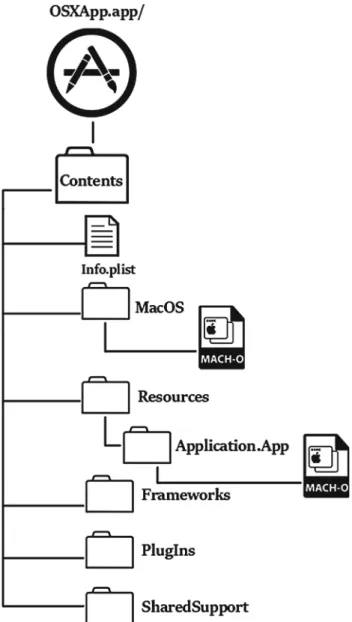
To start with how the dataset collected, we first presented an overall definition of each MacOS X application in Fig.2. As it can be seen if you extract each OS X application bundle you would usually encounter a directory, named Contents. This directory also consists files and some component as follows [33]:
Contents: This directory is main part of each application bundle and contains several directory and files which is intro-duce as follows:
Fig. 2 MacOS application bundle structure
info.plist: This fill consist the configuration information for the application. The Mac Operating System relies on the presence of info.plist to realize related information about the application and other relevant files.
MacOS: Consists the applications executable code file (Mach-O). Usually, this directory comes with only a binary file with the applications main entry point and constantly linked code.
Resources: Consists all resource files of the application i.e. picture, Audio, Video and etc.
Framework: Consists all private shared library of the appli-cation and the framework which used by executable code. PlugIns: Consists all loadable files and libraries which extend application features and capabilities.
SharedSupport: Consists all non-critical resources which not extend the application capabilities.
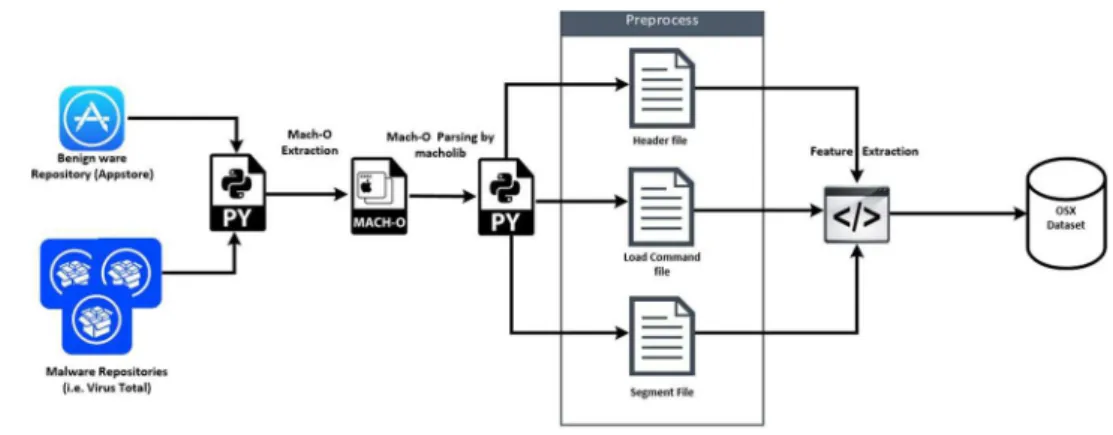
Fig. 3 The process of dataset development
Therefore, we randomly downloaded a total of 460 apps of top 100 apps listed in Utilities, Social Network, Weather, Video and Audio, Productivity, Health and Fitness and Net-work categories of the Apple App Store [34] as of Jun 2016. Dominance of benign samples in the collected dataset was due to obtain desirable results in False Alarm rate by training the classifier with more goodware and detect anomalies from them just like real world benchmark dataset on anomaly detection which provided in [35–37]. We then extracted the Mach-O binaries of all malware and bening-ware samples in the respective datasets manually. Mach-O binaries are the executable portion of an OS X applica-tion [38] and consist of three sections as follows (see also Fig.3):
1. Headercontains common information about the binary such as byte order (magic number), CPU type, and num-ber of load commands. Load Commands section contains information about the logical structure of an executable file and data stored in the virtual memory such as symbol table and dynamic symbol table.
2. Load Commands contains information about logical structure of an executable file and data stored in the vir-tual memory such as symbol table, dynamic symbol table, etc.
3. Segmentsis the biggest part of each Mach-O files which contains application code and data.
We wrote a Python script [39] to extract features from Mach-O files (Table 1). Our script parsed each Mach-O binary and created three separate output files as follows: Mach-O HD: This file contains all Mach-O Header infor-mation such as CPU type, number of commands, and size of commands.
Mach-O LC: This file includes all information about library import/export, symbol table and string functions.
Mach-O SG: This file provides the raw data of three Mach-O file sections (i.e. Data, Text and Segment) (Table1).
3.1 Data preprocessing
Similar to many other malware machine learning datasets, our datasets include several features with missing values; thus, we utilized K-Nearest Neighbor (KNN) imputation technique [40] for estimation of missing values. The impu-tation technique is performed in two steps, as follows:
• Utilizing Euclidean distance for computing distance between each missing value (i.e.xi) and all other samples
without a missing value to detect theK nearest samples. • Impute the missing value ofxiby computing the average
value of the K nearest samples.
Since extracted features values are in different ranges, a normalization technique is used to increase the SVM perfor-mance. As all extracted features are Integer values (except Library Name), Eq.3can be used to convert them to[0−1] interval.
Xn=
xi−min{featured}
ranged ,
ranged=max{featured} −min{featured} (3) In Eq.3,xNandxidenote the respective normalized value
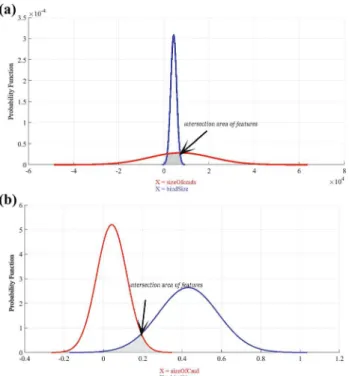
and raw extracted value of the feature indth dimension. Fig-ure 4 shows the overlap of the collected datasets between two features vectors which belong to malicious and benign class before and after preprocessing. It is clear that there are minimal overlaps and the class borders are more distinct.
3.1.1 Feature selection
Feature selection techniques are used to find the most rel-evant attributes for tion. At this stage, the three common feature selection technique (Information Gain, Chi-Square and Principal Component analysis) for malware detection based on code inspection Shabtai et al. [41,42] were applied. Information Gain (IG) [43] is a technique used to evalu-ate attributes to find an optimum separation in classification,
Table 1 OS X dataset features
Feature name Descriptiona Value type File
1. ncmds Number of commands of each sample Integer Mach-O HD
2. sizeofcmds Size of commands of each sample Integer Mach-O HD
3. noloadcmd Number of commands which sample will loaded during execution Integer Mach-O LC 4. rebase_size Define size of the rebase information Integer Mach-O LC 5. bind_size Define size of the information which will be bind during execution Integer Mach-O LC 6. lazy_bind_size Define size of the information which will be bind during execution Integer Mach-O LC 7. export_size Define the size of the lazy binding information Integer Mach-O LC 8. nsyms Define the number of symbol table entries Integer Mach-O LC
9. strsize Define string table size in bytes Integer Mach-O LC
10. LoadDYLIB Define number of DYLIB which called and load for executing of malware Integer Mach-O LC
11. DYLIBnames Define names of loaded DYLIB Nominal Mach-O LC
12. Segments Number of total segments which consist in each sample Integer Mach-O SG 13. SectionsTEXT Number text segments which consist in each sample Integer Mach-O SG 14. SectionsData Number data segments which consist in each sample Integer Mach-O SG
aFeature descriptions are adopted from apple developer guidelines (Mach-O programming topics) [38]
Fig. 4 aProbability density function (PDF) of sizeOfcmds and bind-Size features before pre-processingbprobability density function (PDF) of sizeOfcmds and bindSize features after pre-processing
based on mutual dependencies of labels and attributes. Chi-square measures the lack of independence between attributes [44]. Principal Component Analysis (PCA) can be used to perform feature selection and extraction. We also used PCA as a feature selection mechanism to select the most infor-mative features for classification. After the feature selection methods were used to calculate the relevant scores, features with the highest scores will be considered.
Suppose we have m class labels (for binary classification
m =2),cclass andt be the number of attribute dimension to be evaluated, the IG scores can be obtained using Eq. (4) as follows: G(t)= − m i=1 Pr(ci)logPr(ci)+Pr(t) = m i=1 Pr(ci|t)logPr(ci|t)+Pr(t¯) = m i=1 Pr(ci|¯t)logPr(ci|¯t)+IG =G(t)−G(ti) (4)
Chi-Square method calculates theχavg2 (t) (see Eq.5) score function for attributes as per equation, whereNis the sample size,Ais the frequency of co-occurrence oftandctogether,
B is the frequency of occurrence oft without c,C is the timeschappens withoutt, and Dis the frequency without the occurrence of t or c. χ2(t,c)= N×(AD−CB) 2 ((A+C)×(B+D)×(A+B)×(C+D)) (5) χavg2 (t)=Pr(ci)χ2(t,ci) (6)
These feature selection methods provided us a sequence of effective features after applying them on the collected datasets based on their parameters (see Tables2and3).
Table 2 Selected features from the three different techniques Method Selected features
Info-gain 4, 3, 1, 5, 2, 10, 6, 7, 9, 13, 8,12, 11
χ2 4, 5, 3, 1, 2, 10, 6, 9, 7, 8, 13,12, 11
PCA 4, 5, 3, 1, 2, 10, 6, 9, 7, 8, 13,12, 11
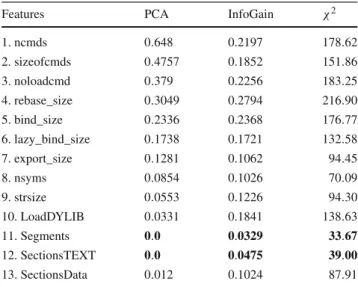
Table 3 Features obtained values from ranker search method to select appropriate feature
Features PCA InfoGain χ2
1. ncmds 0.648 0.2197 178.62 2. sizeofcmds 0.4757 0.1852 151.86 3. noloadcmd 0.379 0.2256 183.25 4. rebase_size 0.3049 0.2794 216.90 5. bind_size 0.2336 0.2368 176.77 6. lazy_bind_size 0.1738 0.1721 132.58 7. export_size 0.1281 0.1062 94.45 8. nsyms 0.0854 0.1026 70.09 9. strsize 0.0553 0.1226 94.30 10. LoadDYLIB 0.0331 0.1841 138.63 11. Segments 0.0 0.0329 33.67 12. SectionsTEXT 0.0 0.0475 39.00 13. SectionsData 0.012 0.1024 87.91 3.2 Library weighting
One of the extracted features is system libraries, which are called by an application. In this phase, the probability of call-ing each and every system libraries is calculated. For each system library, two indicators are calculated. First, the overall occurrence probability of the library in the dataset. Second, the occurrence probability of the library in each of the mal-ware or goodmal-ware classes. Then, the sample weight (SW) of each library is calculated for both malign and benign classes as per Eqs. (7) and (8).
SWi|m = n [j=1]freq(libj|m)i n [v=1]libv|m (7)
Table 4 Applied collected and synthetic datasets distribution Dataset Benign Malicious Total record Original dataset 460 152 612 2x_SMOTE 920 304 1224 3x_SMOTE 1380 456 1836 5x_SMOTE 2300 760 3060 SWi|b= n [j=1]freq(libj|b)i n [v=1]libv|b (8)
In the above equations,SWi|m,brepresents ith sample weight
for each class (malign or benign) and freq(libj|m)i shows
that the occurrence number of jth library (lib) called byith application in malign (m) or benign (b) class (i.e. libv|m means jth library in malign class). After these two mea-sures are calculated, we use them as the new features for classification.
3.3 SMOTE dataset development
Synthetic Minority Over-sampling Technique (SMOTE) [45] is a supervised re-sampling technique to balance minority classes. SMOTE is using K-Nearest Neighbors (KNN) algo-rithm to find the best location in each dimension to generate synthetic samples (see Fig. 5). We used SMOTE to create three datasets of double size, triple size and quintuple size of original dataset all in the same proportion with the orig-inal dataset (see Table4). We believe our collected datasets pave the way for future research in application of machine learning in OS X malware detection.
4 OS X malware classification
Five main supervised classification techniques, Nave Bayes, Bayesian Net, Multi Layer Perceptron (MLP), Decision Tree-J48, and Weighted Radial Basis Function Kernels-Based Support Vector Machine (Weighted- RBFSVM), are
Fig. 5 SMOTE technique uses KNN to generate synthetic sample
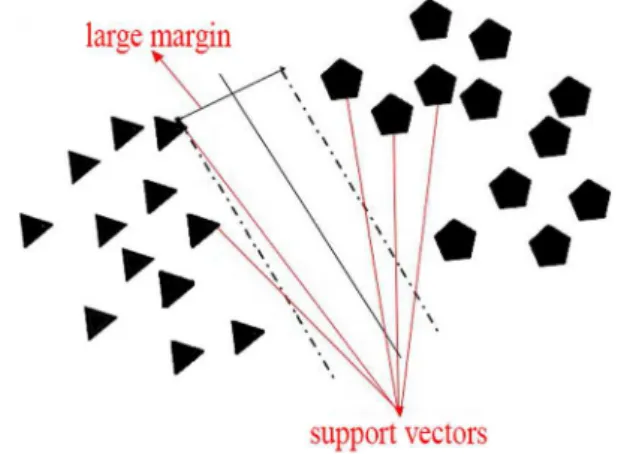
Fig. 6 Support vectors and maximizing margin
then evaluated using our datasets. The main classification task of the proposed methodology is developed using SVM.
The machine learning algorithm in [46] separates data into N-dimensions with different categories in each hyperplane. Then, the dimension with the largest margin will be used for classification. The given training data samples are paired and labeled as (X,Y), where X is the dataset feature vector (which contains features asx1,x2,x3,xn) and Y that
repre-sents labels (malicious or benign) for X features.
Both X and Y are fed as inputs to the SVM classifier. SVM is the used to maximize the margin between given classes and obtain best classification result. The boundary of margin
Fig. 8 Accuracy and false alarm rates among original dataset and syn-thetic dataset
function is defined by support vectors data samples. This margin is calculated from candidate support vectors which are those nearest to the optimized margin (the largest margin that separated two types of data) see Fig.6.
The problem of maximizing margin in SVM can be solved using Quadratic Programming (QP) as shown in Eq. (9).
Minimize:W(α)= − l k=1 αk+ 1 2 l k=1 l p=1 γkγpαkαpk(χk, χp) subject to: ∀k:0≤αk ≤C and l k=1 αkγk =0 (9) Fig. 7 Added
library-weighting features and corresponding support vectors
Table 5 Supervised classification results by cross-validation
Classifier Dataset Accuracy False alarm
Nave bayes Original_row 51 36.3
Bayesian net Original_row 82.35 19.78
MLP Original_row 81.37 7.8
Decision tree-48 Original_row 88.07 8
Weighted-linear Original_row 89 4.1
Weighted-sigmoid Original_row 85.95 3.9
Weighted-polynomial Original_row 87.95 3.0
Table 6 Supervised classification results by cross-validation Classifier Dataset Accuracy False alarm Nave Bayes SMOTE_2X 54.33 43.15 Nave Bayes SMOTE_3X 55.35 44.72 Nave Bayes SMOTE_5X 54.71 4.87 Bayesian net SMOTE_2X 87.55 13.84 Bayesian net SMOTE_3X 86.88 14.89 Bayesian net SMOTE_5X 84.72 18.84
MLP SMOTE_2X 85.62 7.3
MLP SMOTE_3X 88.15 6.68
MLP SMOTE_5X 89.02 5.1
Decision tree-J48 SMOTE_2X 92.82 7.1 Decision tree-J48 SMOTE_3X 95.75 4.28 Decision tree-J48 SMOTE_5X 96.62 4 Weighted-RBFSVM Original 91 3.9
In the above equation,l denotes the number of training objects,αk the vector of l variables in which segment αk
belongs to the training sample of xk, and C is the
mar-gin parameter which controls effects of noise and outliers within the training set. Samples in training set with αks
of greater than zero are the support vector objects. Others with αk value of zero are considered non-support vector
objects; thus, they are not consider in calculation of margin function.
For better separation, data points in the SVM kernel func-tion are used ask(xk,xp)in the QP equation (see Eq. 9).
Kernel functions map training data into higher dimensions to find a separating hyper plane with a maximum margin [47].
There are some common kernel functions such as Linear, Polynomial and RBF and Sigmoid Kernel for SVM classifier. In this research, due to the proximity of data (see Fig.4), RBF kernel function [48] is utilized (see Eq.10).
k(χk, χp)=exp(−γ||χk−χp||2) (10)
Although SVM is a promising supervised classifier, it has its own drawbacks. SVM technique performance and accu-racy rely heavily on the training data complexity, structure and size [49]. In our research, the size of training dataset is suitable for SVM classification and there are not too many features. Moreover, our dataset is normalized which reduces the complexity of the training set.
5 Findings and discussion
Using the library-weighting measure, we created two new features, namely: w-b (library-weight-benign) and lib-w-m (library-weight-malware), to increase the accuracy of classification (see Fig. 7). Table 5 presents the evaluation results of Nave Bayes, Bayesian Net, MLP, Decision Tree-J48, and Weighted- RBFSVM on the original dataset with tenfold Cross Validation (CV) technique. Due to data nor-malization and well-separated features (shown in Fig. 7), it is clear that the weighted-RBFSVM offers the high-est accuracy (91%) and lowhigh-est false alarm rate (3.9%) (Table6).
Table6shows results of evaluating Nave Bayes, Bayesian Net, MLP, Decision Tree-J48, and Weighted- RBFSVM against our three SMOTE datasets using tenfold Cross Val-idation (CV) technique. While accuracy is increased in all cases and we have received much higher accuracy (i.e. 96.62% detection rate of Decision Tree-J48 on SMOTE_5X); the false alarm rate is not reduced and more training time is required due to the bigger size of datasets [50]. In Addition, the complexity of classification technique had reduction due to two new added features(lib-w-b, lib-w-m). For instance J48 classification complexity before adding the two new fea-tures was 65 nodes and 35 leaves but after providing the new features reduced to 55 nodes and 33 leaves receptively.
Figure 9 depicts the frequency of occurrence of every library calls in the original dataset.
Figure8 depicts accuracy and false alarm rate for orig-inal and SMOTE datasets. While SMOTE datasets are
Fig. 9 Percentage of library intersection in the collated dataset
Fig. 10 KS density function for segments
Fig. 11 KS density function for SectionsData
significantly bigger in compare with the original dataset, the proposed model obtained lower false alarm in the original dataset with almost same accuracy of SMOTE datasets.
A comparison of low ranked features (i.e. Segments, SectionsTEXT, SectionsData) using Kernel Smooth (KS) density estimation shows a significant overlap between low ranked features of malware and benign applications (see Fig.10); hence, these features are not suitable for classi-fication. The experiments on KS density estimation also suggested that data and text sections had the most over-laps in comparison to other extracted features—see Figs.11 and12. According to Fig. 13, the KS density estimation library-weighting provides a distinction between malware and benign samples, since these two curves (malware and benign) are almost orthonormal as the peak of one curve is the opposite trend of the other. Therefore, it can be said that this feature is highly appropriate for classification.
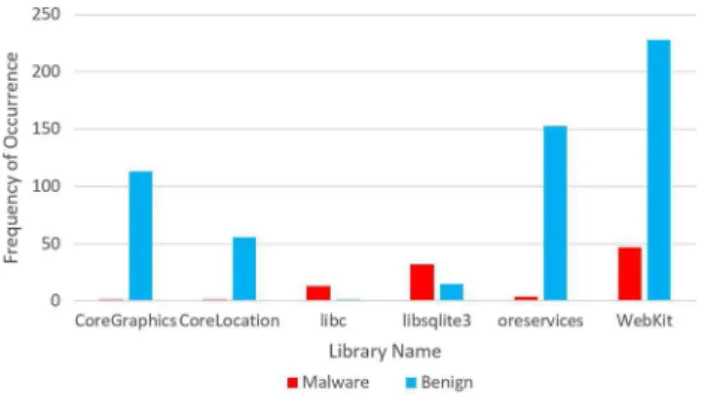
As shown in Fig.14CoreGraphics, CoreLocation, Ore-services and Webkit libraries were called a lot more in benign applications while libc and libsqlite3 were called significantly more by malware. Statistical analysis of the library calls revealed that applications that call audio and video related libraries (AudioToolbox and CoreGraphics) are
Fig. 12 KS density function for SectionsTEXT
Fig. 13 KS density function for lib-weighting
Fig. 14 Application call library statistics for malign and benign appli-cations
mostly benign while most malicious apps more frequently call system libraries (i.e. libSystem) and Sqlite libraries.
6 Conclusion and future work
In this paper, we developed four OS X malware datasets and a novel measure based on library calls for classification of OS X malware and benign application. We have obtained accu-racy of 91% and the false alarm rate of 3.9% using weighted RBF–SVM algorithm against our original dataset. Moreover,
using Decision Tree- J48 we obtained 96.62% accuracy using SMOTE_5X dataset with slightly higher false alarm (4%). Moreover the synthetic datasets are generated using SMOTE technique and assessed them by same supervised algorithm. This experiment is conducted to show effect of number of sample size on detection accuracy. Our results indicate that increasing sample size may increase detection accuracy but adversely affect the false alarm rate. OS X malware detec-tion and analysis utilising dynamic analysis techniques is a potential future work of this research. Extending classifi-cation using other techniques such as Fuzzy classificlassifi-cation, applying deep learning for OS X malware detectionm and using a combination of our suggested features for OSX mal-ware detection are interesting future works of this study.
Acknowledgements We thank VirusTotal for providing us a private API key to access their data for constructing our dataset. This work is partially supported by the European Council International Incoming Fellowship (FP7-PEOPLE-2013-IIF) grant.
Open Access This article is distributed under the terms of the Creative Commons Attribution 4.0 International License (http://creativecomm ons.org/licenses/by/4.0/), which permits unrestricted use, distribution, and reproduction in any medium, provided you give appropriate credit to the original author(s) and the source, provide a link to the Creative Commons license, and indicate if changes were made.
References
1. Daryabar, F., Dehghantanha, A., Udzir, N.I.: Investigation of bypassing malware defences and malware detections. In: 2011 7th International Conference on Information Assurance and Security (IAS), p. 1738 (2011)
2. Bisio, F., Gastaldo, P., Meda, C, Nasta, S., Zunino, R.: Machine learning-based system for detecting unseen malicious software. In: Gloria A.D. (eds) Applications in Electronics Pervading Industry, Environment and Society [Internet], p. 915. Springer International Publishing (2016) [cited 2016 Nov 28]. (Lecture Notes in Electri-cal Engineering). http://link.springer.com/chapter/10.1007/978-3-319-20227-3_2
3. Kaspersky Lab: Overall statistics for 2015 [Internet]. Kasper-sky Lab, Russia (2016).https://securelist.com/files/2015/12/KSB_ 2015_Statistics_FINAL_EN.pdf
4. Panda Lab: Pandalabs annual report 2015 [Internet], p. 30. (2016) [cited 2016 Nov 30]. Report No.: 4.http://www.pandasecurity. com/mediacenter/src/uploads/2014/07/Pandalabs-2015-anual-EN.pdf
5. Beek, C., Frosst, D., Greve, P., Gund, Y., Moreno, F., Peterson, E., Schmugar, C., Simon, R., Sommer, D., Sun, B., Tiwari, R., Weafer, V.: McAfee Labs Threats Report [Internet], p. 49. McAfee Lab (April 2017).https://www.mcafee.com/us/resources/reports/ rp-quarterly-threats-mar-2017.pdf
6. Stack Overflow Developer Survey 2016 Results [Internet]. Stack Overflow. [cited 2016 Nov 28].http://stackoverflow.com/research/ developer-survey-2016
7. Aquilino, B.I.: FLASHBACK OS X MALWARE. In: Pro-ceedings of Virus Bulletin Conference [Internet], p. 102114. (2012) [cited 2017 Apr 7].https://pdfs.semanticscholar.org/6b7b/ d026676c5e30b42b40f50ed8076b81eb2764.pdf
8. Gardiner, J., Nagaraja, S.: On the security of machine learning in malware C&C detection: a survey. ACM Comput. Surv.49(3), 1–39 (2016)
9. Sun, M., Li, X., Lui, J.C.S., Ma, R.T.B., Liang, Z.: Monet: a user-oriented behavior-based malware variants detection system for android. IEEE Trans. Inf. Forensics Secur.12(5), 110312 (2017) 10. Nissim, N., Cohen, A., Elovici, Y.: ALDOCX: detection of unknown malicious microsoft office documents using designated active learning methods based on new structural feature extrac-tion methodology. IEEE Trans. Inf. Forensics Secur.12(3), 63146 (2017)
11. Nauman, M., Azam, N., Yao, J.: A three-way decision making approach to malware analysis using probabilistic rough sets. Inf. Sci.20(374), 193209 (2016)
12. Fattori, A., Lanzi, A., Balzarotti, D., Kirda, E.: Hypervisor-based malware protection with accessminer. Comput. Secur.52, 3350 (2015)
13. Mohaisen, A., Alrawi, O., Mohaisen, M.: AMAL: high-fidelity, behavior-based automated malware analysis and classification. Comput. Secur.52, 25166 (2015)
14. Huda, S., Abawajy, J., Alazab, M., Abdollalihian, M., Islam, R., Yearwood, J.: Hybrids of support vector machine wrapper and filter based framework for malware detection. Future Gener. Comput. Syst.55, 37690 (2016)
15. Nissim, N., Moskovitch, R., Rokach, L., Elovici, Y.: Novel active learning methods for enhanced PC malware detection in windows OS. Expert Syst. Appl.41(13), 584357 (2014)
16. Damodaran, A., Troia, F.D., Visaggio, C.A., Austin, T.H., Stamp, M.A.: Comparison of static, dynamic, and hybrid analysis for mal-ware detection. J. Comput. Virol. Hacking Tech. [Internet]. 29 December 2015 [cited 2016 Oct 4]. http://link.springer.com/10. 1007/s11416-015-0261-z
17. Mangialardo, R.J., Duarte, J.C.: Integrating static and dynamic malware analysis using machine learning. IEEE Lat. Am. Trans.
13(9), 30807 (2015)
18. Shaerpour, K., Dehghantanha, A., Mahmod, R.: Trends in android malware detection. J. Digit. Forensics Secur. Law. 8(3), 2140 (2013)
19. Faruki, P., Bharmal, A., Laxmi, V., Ganmoor, V., Gaur, M.S., Conti, M., et al.: Android security: a survey of issues, malware penetration, and defenses. IEEE Commun. Surv. Tutor.17(2), 998–1022 (2015) 20. Feizollah, A., Anuar, N.B., Salleh, R., Wahab, A.W.A.: A review on feature selection in mobile malware detection. Digit. Investig.
13, 2237 (2015)
21. Suarez-Tangil, G., Tapiador, J.E., Lombardi, F., Pietro, R.D.: ALTERDROID: differential fault analysis of obfuscated smart-phone malware. IEEE Trans. Mob. Comput.15(4), 789802 (2016) 22. Yerima, S.Y., Sezer, S., Muttik, I.: High accuracy android mal-ware detection using ensemble learning. IET Inf. Secur.9(6), 31320 (2015)
23. Saracino, A., Sgandurra, D., Dini, G., Martinelli, F.: Madam: Effec-tive and efficient behavior-based android malware detection and prevention. IEEE Trans. Dependable Secure Comput. (2016) 24. Brien, D.O.: The apple threat landscape [Internet], p. 31. Symantec
2016 Feb. (SECURITY RESPONSE). Report No.: 1.02.https:// www.symantec.com/content/dam/symantec/docs/security-center/ white-papers/apple-threat-landscape-16-en.pdf
25. Europe key target for cybercrime. Comput Fraud Secur.2011(1), 3, 20 (2011)
26. Richard III, G.G., Case, A.: In lieu of swap: analyzing compressed RAM in Mac OS X and Linux. Digit. Investig. 11(2), S3–S12 (2014)
27. Case, A., Richard, G.G.: Advancing Mac OS X rootkit detection. Digit. Investig.14, S25–S33 (2015)
28. Walkup E.: Mac malware detection via static file struc-ture analysis. Standford [Internet] (2014) [cited 2017 Mar
28]. http://cs229.stanford.edu/proj2014/Elizabeth%20Walkup,% 20MacMalware.pdf
29. VirusTotal-Free online virus, malware and URL scanner [Internet]. [cited 2016 Nov 28].https://www.virustotal.com/
30. Objective-see [Internet]: Objective-See. [cited 2016 Nov 28].
https://objective-see.com
31. Contagio Malware Dump: Mila. http://contagiodump.blogspot. com/. Accessed 28 Jun 2016
32. Masud, M.M., Khan, L., Thuraisingham, B.: A hybrid model to detect malicious executables. In: 2007 IEEE International Confer-ence on Communications, 14438 (2007)
33. [Internet]. [cited 2017 Sep 13]. https://developer.apple.com/ library/content/documentation/CoreFoundation/Conceptual/ CFBundles/BundleTypes/BundleTypes.html#apple_ref/doc/uid/ 10000123i-CH101-SW1
34. Mac App Store Downloads on iTunes [Internet]. [cited 2016 Nov 28].https://itunes.apple.com/us/genre/mac/id39?mt=12
35. KDD Cup 1999 Data: 2000 [Online]. http://kdd.ics.uci.edu/ databases/kddcup99/kddcup99.html. Accessed 17 Sept 2017 36. Garcia, S., Grill, M., Stiborek, J., Zunino, A.: An empirical
com-parison of botnet detection methods. Comput. Secur.45, 100–123 (2014)
37. Song, J., Takakura, H., Okabe, Y., Eto, M., Inoue, D., Nakao, K.: Statistical analysis of honeypot data and building of Kyoto 2006+ dataset for NIDS evaluation. In: Proceedings of the First Workshop on Building Analysis Datasets and Gathering Experience Returns for Security (2011)
38. Executing Mach-O Files [Internet]. [cited 2017 May 13].
https://developer.apple.com/library/content/documentation/ DeveloperTools/Conceptual/MachOTopics/1-Articles/executing_ files.html#apple_ref/doc/uid/TP40001829-SW1
39. HNSX/OSXMalware [Internet]. GitHub. [cited 2017 Apr 25].
https://github.com/HNSX/OSXMalware
40. Hastie, T., Tibshirani, R., Sherlock, G., Eisen, M., Brown, P., Bot-stein, D.: Imputing Missing Data for Gene Expression Arrays. Stanford University Statistics Department Technical Report (1999)
41. Shabtai, A., Kanonov, U., Elovici, Y., Glezer, C., Weiss, Y.: Andromaly: a behavioral malware detection framework for android devices. J. Intell. Inf. Syst.38(1), 16190 (2012)
42. Shabtai, A., Fledel, Y., Elovici, Y.: Automated static code analysis for classifying android applications using machine learning. In: Computational Intelligence and Security (CIS), 2010 International Conference on IEEE, pp. 329-333 (2010)
43. Joachims, T.: Text categorization with support vector machines: learning with many relevant features. In: European Conference on Machine Learning, pp. 137–142 (1998)
44. Zhu, Z., Ong, Y.-S., Dash, M.: Wrapperfilter feature selection algo-rithm using a memetic framework. IEEE Trans. Syst. Man. Cybern. Part B Cybern.37(1), 706 (2007)
45. Chawla, N.V., Bowyer, K.W., Hall, L.O., Kegelmeyer, W.P.: SMOTE: synthetic minority over-sampling technique. J. Artif. Intell. Res.16, 321357 (2002)
46. The Nature of Statistical Learning Theory | Vladimir Vapnik | Springer [Internet]. [cited 2016 Dec 17].http://www.springer.com/ gp/book/9780387987804
47. Scholkopf, B., Smola, A.J.: Learning with Kernels: Support Vector Machines, Regularization, Optimization, and Beyond. MIT Press, Cambridge (2001)
48. Shashua, A.: Introduction to machine learning: class notes 67577. ArXiv PreprintarXiv:0904.3664[Internet]. 2009 [cited 2016 Dec 17].arXiv:0904.3664
49. Burges, C.J.: A tutorial on support vector machines for pattern recognition. Data Min. Knowl. Discov.2(2), 121167 (1998) 50. Kavzoglu, T., Colkesen, I.: The effects of training set size for
performance of support vector machines and decision trees. In: Pro-ceeding of the 10th International Symposium on Spatial Accuracy Assessment in Natural Resources and Environmental Sciences, p. 1013 (July 2012)