Development of an optimized methodology for tensile testing of carbon steels in hydrogen environment
118
0
0
Full text
(2) Dolors Baró Mariné, Catedràtica de Física Aplicada del Departament de Física de la Universitat Autònoma de Barcelona.. FA CONSTAR:. Que ha fet el seguiment mitjançant tutories del treball de final de carrera concloent a la titulació d’ Enginyeria de Materials titulat “Development of an optimized methodology for tensile testing of Carbon steels in hydrogen environment” de l’alumne Pau Cuadros Fernandez.. Al mateix temps considerem que és apte i autoritzem la seva presentació i posterior defensa.. I per què així consti, signem el present escrit.. M. D. Baró Bellaterra, 18 de Juny de 2009.
(3) OCAS NV John Kennedylaan 3 B-9060 Zelzate Tel : + 32 9 345 12 11 Fax : + 32 9 345 12 04 www.ocas.be Zelzate, June 16th 2009. CERTIFICATION FOR PROJECT PRESENTATION AND DEFENCE. Pau Cuadros has been working in OCAS on the project “Development of an optimized methodology for tensile testing of carbon steels in hydrogen environment”. He was closely followed up and supervised, and meetings on a regular basis showed that he was progressing very well with this project. I consider that Pau is suitable and well prepared and I hereby authorize his presentation and subsequent defence.. Lode Duprez Program Manager Metal Processing R&D Portfolio. OCAS NV OnderzoeksCentrum voor Aanwending van Staal (Research Centre for the Application of Steel) Registered Office: John Kennedylaan 3, B-9060 Zelzate, Belgium – VAT BE 0444 177 945 – Trade Register Gent 161 759 Bank Account (Fortis) 290-0030977-55 IBAN BE 2900 0309 7755 – BIC GEBABEBB.
(4) ACKNOWLEDGEMENTS. This work has been done with the collaboration of all the people of the Steel Researcher Center in Gent, OCAS, especially Lode Duprez from the Substracts and Metallic Coatings Development Departament who was in continuous dedication and Frank Rootsaert from the Physical Testing and Application Departament for the lessons on the Tensile Machine. I have to be agreed with Ma Dolors Baró who gave me the opportunity to realize this work in OCAS.. The project is dedicated to my family, especially my parents, my brother and who were together with me during this internship.. Pau Cuadros Fernandez, 2009.
(5) Development of an optimized methodology for tensile testing of Carbon steels in Hydrogen environment. MEMORY INDEX 1. INTRODUCTION…………………………………………………………………. 2. LITERATURE REVIEW…………………………………………………………. 2.2. Hydrogen Embrittlement………………………………………………… 2.3. Material Description……………………………………………………… 3. EXPERIMENTAL…………………………………………………………………. 3.1. Materials…………………………………………………………………... 3.2. Equipments & Techniques………………………………………………. 4. H-CHARGING & SOLUBILITY………………………………………………….. 4.1. Sample geometry………………………………………………………… 4.2. Charging methods……………………………………………………….. 4.3. Electrolyte solutions……………………………………………………… 4.4. Results and conclusion………………………………………………….. 5. DEVELOPMENT OF A TENSILE TESTING METHODOLOGY…………….. 5.1. Standard Tensile Testing………………………………………………... 5.2. SSRT: Slow Strain Rate Testing……………………………………….. 5.3. Incremental Step Loading Technique………………………………….. 5.4. Constant Load Testing…………………………………………………... 6. EFFECT OF MICROSTRUCTURE ON HYDROGEN EMBRITTELEMENT. 6.1. FB450……………………………………………………………………… 6.2. S700MC…………………………………………………………………… 6.3. DP600……………………………………………………………………… 6.4. DP980……………………………………………………………………… 6.5. DP1200……………………………………………………………………. 6.6. Overlay all materials & discussion……………………………………… 7. FRACTURE MECHANISMS STUDY…………………………………………... 7.1. Tensile Testing……………………………………………………………. 7.2. Sample preparation………………………………………………………. 7.3. SEM analysis……………………………………………………………… 7.4. EBSD analysis……………………………………………………………. 7.5. Discussion……………………………………………………………….… 8. CONCLUSIONS AND SUGGESTIONS FOR FUTURE WORKS..…………. 9. BIBLIOGRAPHIC REFERENCES………………………………………………. 3 5 5 5 8 8 15 22 22 23 27 28 36 36 36 42 47 55 55 58 60 63 65 68 71 71 73 74 79 84 85 87.
(6) Development of an optimized methodology for tensile testing of Carbon steels in Hydrogen environment. APPENDICE INDEX. 1. 2. 3. 4.. OPTICAL MICROSCOPE IMAGES………………………………………... II SEM IMAGES………………………………………………………………… VII EDX MAPPING………………………………………………………………. XV EBSD IMAGES………………………………………………………………. XVI.
(7) MEMORY.
(8) Development of an optimized methodology for tensile testing of Carbon steels in Hydrogen environment. 1. INTRODUCTION Hydrogen Embrittlement (HE) can be defined as a loss of mechanical properties, in particular ductility, due to the presence of hydrogen and stress. A significant decrease of ductility and/or fracture strength is typical features of HE. Another illustration of the detrimental effect of H is the delayed fracture phenomena. Understanding the fundamentals of HE is a key issue for numerous future material developments. The major aim of this study was to obtain an optimized tensile testing methodology with in-situ H-charging to reveal the HE in various high strength steels. This study has been done in OCAS, the research centre of ArcelorMittal for non-automotive product development, which is located in Gent, Belgium. The various goals of this study were, in chronological order: First, to define the most appropriate experimental parameters for Hcharging: o Sample geometry o Electrochemical charging conditions: . Type of electrolyte. . Galvanostatic or potentiostatic methods. . Current density. . Effect of steel type. The amount of hydrogen (ppm) introduced into the steel will influence the mechanical results. Secondly, to define the most appropriate tensile test type that allows to differentiate C-steels in their sensitivity to H-embrittlement: o SSRT “Slow Strain Rate Testing” : . Effect of pre-charging time. . Effect of strain rate 3.
(9) Development of an optimized methodology for tensile testing of Carbon steels in Hydrogen environment. o Incremental Step Loading: o Constant Load Testing For the first two parts of the research, a long variety of steels was studied (depending on specific internal project requests). Finally, fundamental material knowledge was generated by characterizing a systematic set of steel grades in their sensitivity to hydrogen. There, two steel families were investigated: . Dual Phase steels,. having a predominantly ferrite-. martensite structure. (DP600 / DP980 / DP1200) . Bainitic containing steels of various strength levels. (S700MC / FB450). Afterwards, fracture surface analysis was done by means of SEM and crack propagation was studied by mean of EBSD technique.. 4.
(10) Development of an optimized methodology for tensile testing of Carbon steels in Hydrogen environment. 2 LITERATURE REVIEW 2.1 Hydrogen Embrittlement Hydrogen can enter into the material during manufacturing, e.g. welding, casting, annealing, and during service, e.g. when subjected to wet environments with simultaneous corrosion. In solid solution hydrogen at low concentration in the material does not affect the mechanical properties significantly except during the application of load. As a consequence of mechanical loading dislocations are generated with possibility of becoming hydrogen traps. There are different forms of degradation, one of which is the weakening of the material due to hydrogen. The impact or degradation due to hydrogen may vary with composition, microstructure, and applied stress levels of the material in service in solution. The presence of hydrogen traps in the material influence the degree to which the material can suffer. The latter is an important aspect that must be considered for the design of components. To understand the mechanisms of HE is necessary to evaluate via experiments the diffusion, the solubility (determinate by an H-analyzer) and hydrogen traps characteristic of the material.. 2.2 Material Description This study is focused on carbon steels materials with different microstructures. The American Iron and Steel Institute (AISI) define carbon steel as follows: •. when no minimum content is specified or required for chromium, cobalt, columbium [niobium], molybdenum, nickel, titanium, tungsten, vanadium or zirconium, or any other element to be added to obtain a desired alloying effect;. •. when the specified minimum for copper does not exceed 0.40 per cent;. •. when the maximum content specified for any of the following elements does not exceed the percentages noted: manganese 1.65, silicon 0.60, and copper 0.60. 5.
(11) Development of an optimized methodology for tensile testing of Carbon steels in Hydrogen environment. Steels can be classified by a variety of different systems depending on: •. The composition, such as carbon, low-alloy or stainless steel;. •. The manufacturing methods, such as open hearth, basic oxygen process, or electric furnace methods;. •. The finishing method, such as hot rolling or cold rolling;. •. The product form, such as bar plate, sheet, strip, tubing or structural shape;. •. The deoxidation practice, such as killed, semi-killed, capped or rimmed steel. •. The microstructure, such as ferritic, pearlitic and martensitic. •. The required strength level, as specified in ASTM standards. •. The heat treatment, such as annealing, quenching and tempering, and thermomechanical processing. •. Quality descriptors, such as forging quality and commercial quality.. For the better understanding of different steel microstructures formation, Dual Phase and TRIP steels have been explained: Dual-phase steel (DPA) is a high-strength steel that has a ferrite and martensitic microstructure. DPA starts as a low or medium carbon steel and is quenched from above A1 but below A3 on a continuous cooling transformation diagram. This results in a soft microstructure; with a ferritic matrix containing islands of martensite in the secondary phase (martensite increases the tensile strength). TRIP steel is a high-strength steel, stands for "transformation induced plasticity." TRIP steel has a triple phase microstructure consisting of ferrite, bainite, and retained austenite. During plastic deformation and straining, the metastable austenite phase is transformed into martensite. This transformation allows for enhanced strength and ductility. The graph 1 shows the curve TTT (Temperature-Time-Transformation) for DP and TRIP steels and give an idea to how obtain them and which alloys modify the curves in time-temperature.. 6.
(12) Development of an optimized methodology for tensile testing of Carbon steels in Hydrogen environment. Graph 1: Influence of alloying elements on TTT behavior. 7.
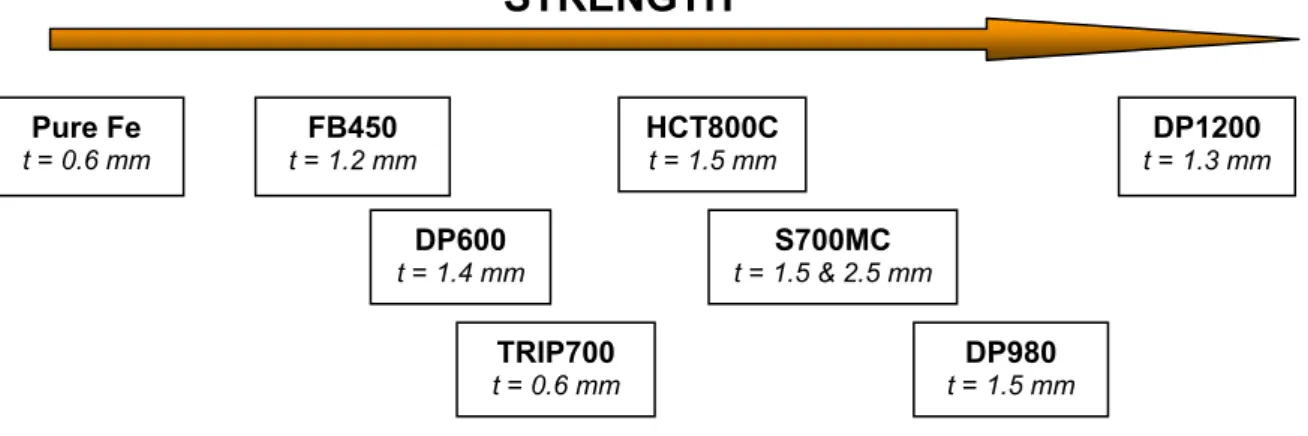
(13) Development of an optimized methodology for tensile testing of Carbon steels in Hydrogen environment. 3 EXPERIMENTAL 3.1 Materials The materials used throughout this study are shown on the following table 1. STRENGTH Pure Fe. FB450. HCT800C. DP1200. t = 0.6 mm. t = 1.2 mm. t = 1.5 mm. t = 1.3 mm. DP600. S700MC. t = 1.4 mm. t = 1.5 & 2.5 mm. TRIP700. DP980. t = 0.6 mm. t = 1.5 mm. Table1: Strength distribution and thickness of the materials. -. PURE Fe. o Chemical composition C. Si. Mn. P. S. Al. Cr. Ni. Mo. Cu. N. Ti. V. Nb. 0.0015. 0. 0.0003. 0.0017. 0.0003. 0.0019. 0.0001. 0. 0. 0.0007. 0. 0.0002. 0. 0. Table 2: Chemical composition in Wt% of the Pure Fe. o Microstructure. Fig.1: Pure Fe after salt bath at 750 °C during 30 seconds. 8.
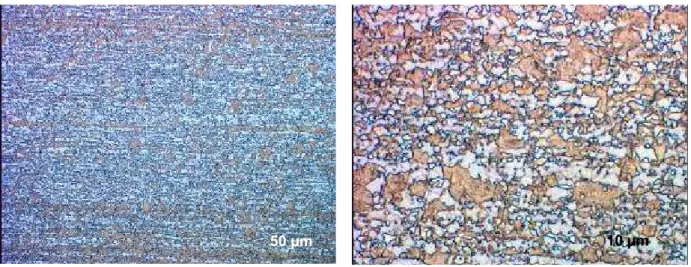
(14) Development of an optimized methodology for tensile testing of Carbon steels in Hydrogen environment. -. HCT800C. o Chemical composition C. Si. Mn. Al. OTHERS:. ~0.1. ~0.15. ~2.2. ~0.05. Nb. Table 3: Chemical composition in Wt% of HCT800C. o Microstructure The blue to grey colored areas is the ferritic fraction. The small white phase distinguishes the high carbon martensitic structure whilst the brown one is characterized as low carbon martensitic phase.. 10 µm. 50 µm Fig. 2: Microstructure of HCT800C (Le Pera etching). o Mechanical properties. Direction Longitudinal. Rp 0.2. Rm. Au. A80. MPa. MPa. %. %. 715. 892. 8.1. 14.6. Table 4: Mechanical properties HCT800C. 9.
(15) Development of an optimized methodology for tensile testing of Carbon steels in Hydrogen environment. -. TRIP700. o Chemical composition C. Si. Mn. Al. OTHERS:. ~0.15. ~0.4. ~1.5. ~1.5. V. Table 5: Chemical composition in Wt% of TRIP700. o Microstructure The blue to grey colored areas is the ferritic fraction. The small white phase distinguishes retained austenite whilst the brown one is characterized as low carbon martensitic phase. The small dark brown grains are specified as bainitic phase.. Fig. 3: Optical microstructures of the TRIP700. o Mechanical properties. Direction Longitudinal. Rp 0.2. Rm. Au. A80. MPa. MPa. %. %. 478. 705. 23.5. 31.6. Table 6: Mechanical properties of TRIP700. -. S700MC o Chemical composition C. Si. Mn. Al. OTHERS:. ~0.05. ~0.2. ~1.7. ~0.05. Ti, Mo, Nb. Table 7: Chemical composition in Wt% of the S700MC. 10.
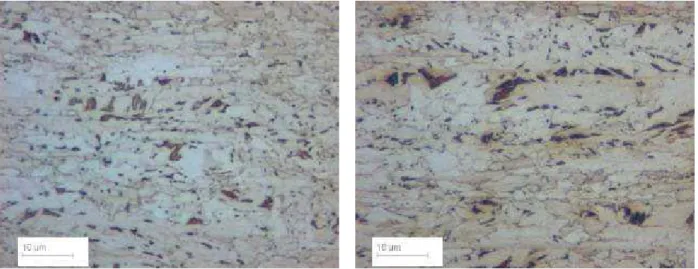
(16) Development of an optimized methodology for tensile testing of Carbon steels in Hydrogen environment. o Microstructure Next to bainite the sample contained mainly Ti & Nb-rich precipitates (Ti,Nb,Si,O; Ti,Nb,C,N and Nb,Ti,C). The precipitates had a very varying shape (round, oval, angular or irregular) and covered a whole range of dimensions (20 – 550 nm).. Fig. 4: Microstructure of S700MC. o Mechanical properties. Direction. Rp 0.2. Rm. Au. A80. MPa. MPa. %. %. 782. 819. 9. 18. Longitudinal. Table 8: Mechanical properties of TRIP700. -. DP600. o Chemical composition C. Si. Mn. Al. OTHERS:. ~0.07. ~0.13. ~1.4. ~0.05. Cr. Table 9: Chemical composition in Wt% of DP600. 11.
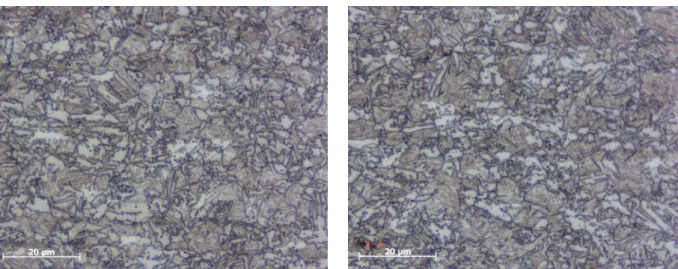
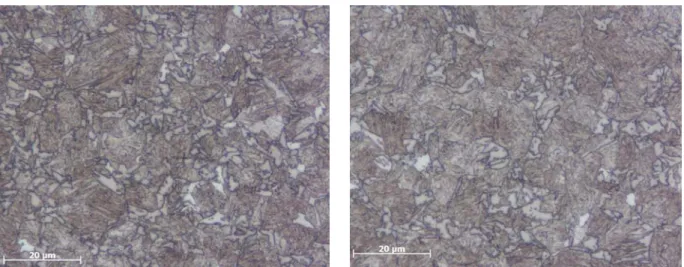
(17) Development of an optimized methodology for tensile testing of Carbon steels in Hydrogen environment. o Microstructure The smaller dark brown grains characterize the Martensite, the rest distinguishes the ferrite phase.. Fig. 5: Microstructure of the DP600 material.. o Mechanical properties Direction. Rp 0.2. Rm. Au. A80. MPa. MPa. %. %. 402. 648. 15.4. 26.1. Longitudinal. Table 10: Mechanical properties of DP600. -. DP980 o Chemical composition C. Si. Mn. Al. OTHERS:. ~0.14. ~0.20. ~1.9. ~0.030. Cr. Table 11: Chemical composition in Wt% of DP980. o Microstructure Consists on low carbon martensitic and bainitic microstructure.. Fig. 6: Microstructure of the DP980 material. Etched with Le Pera 20 seconds. 12.
(18) Development of an optimized methodology for tensile testing of Carbon steels in Hydrogen environment. o Mechanical properties. Direction. Rp 0.2. Rm. Au. A50. MPa. MPa. %. %. 687. 966. 8.5. 14.7. Longitudinal. Table 12: Mechanical properties of DP980. -. DP1200 o Chemical composition C. Si. Mn. Al. OTHERS:. ~0.15. ~0.20. ~1.9. ~0.03. Cr. Table 13: Chemical composition in Wt% of DP1200. o Microstructure Consists in a mainly martensite with a small fraction of ferrite microstructure.. Fig. 7: Microstructure of the DP1200 material. Etched with Le Pera 20 seconds. o Mechanical properties. Direction Longitudinal. Rp 0.2. Rm. Au. A50. MPa. MPa. %. %. 969. 1212. 4.5. 7.8. Table 13: Mechanical properties of DP1200. 13.
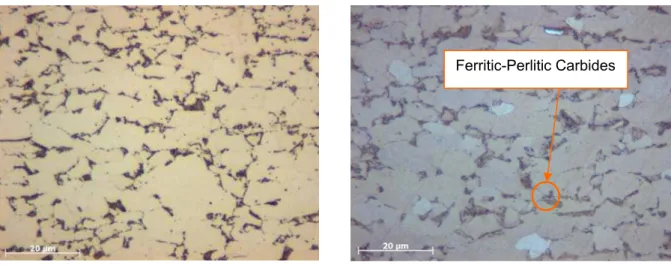
(19) Development of an optimized methodology for tensile testing of Carbon steels in Hydrogen environment. -. FB450. o Chemical composition C. Si. Mn. Al. OTHERS. ~0.07. ~0.13. ~1.00. ~0.07. Ti, Nb, Mo. Table 14: Chemical composition in Wt% of FB450. o Microstructure The FB450 has a ferritic-bainitic microstructure around the 11 %.. Ferritic-Perlitic Carbides. Fig. 8: Microstructure FB450 Ferrite-bainite. o Mechanical properties. Direction Longitudinal. Rp 0.2. Rm. Au. A80. MPa. MPa. %. %. 360. 485. 16.6. 24.3. Table 15: Mechanical properties of FB450. 14.
(20) Development of an optimized methodology for tensile testing of Carbon steels in Hydrogen environment. 3.2 Equipments & techniques 3.2.1. H-MAT. The Hydrogen content of solid materials can be determined with the computer controlled analyzer system H-mat 2500. A. wide. range. of. different. materials such as steel, iron, nonferrous metals, alloys, ceramics, glass, semiconductor materials, special. materials,. powdered. metals and inorganic compounds can. be. analyzer. examined to. with. determine. this their. Hydrogen content. The Hydrogen concentration is determined using the carrier gas procedure. Nitrogen or Argon with 99.995 % purity is used as. Fig.9: H-mat 2500. carrier gas. The samples are heated in a graphite crucible in the pulse furnace. During this melt extraction Hydrogen and Carbon Monoxide are released from the sample and taken up by the carrier gas flow. On passing the dust trap, oxidising agent and a molecular sieve, coarse particles are removed from the carrier gas and CO2 as well as H2O are retained. The thermal conductivity measuring cell of the H-mat 2500 operates as Hydrogen detector. Thermistors in a bridge circuit measure the thermal conductivity of the carrier gas flow and of a reference gas flow. A change of the thermal conductivity of the carrier gas flow due to the released Hydrogen produces a measurement signal on comparing the two gas flows. The magnitude of this signal is proportional to the Hydrogen content of the particular sample. The central processing unit calculates the Hydrogen content to an accuracy of 0.01 ppm and displays the result digitally on the screen.. 15.
(21) Development of an optimized methodology for tensile testing of Carbon steels in Hydrogen environment. 3.2.1.1 Reagent tubes This reagent tubes (Fig.10 (b)) are filled with various chemicals to stop "impurities" such as water vapor and CO in the gas flow. The tubes 1 and 3 are used as a molecular sieve, the tube 2 is filled with Schuetze reagent for COoxidation, activated charcoal and glass wool.. 1. Fig.10 (a): H-Mat. 2. 3. Fig.10 (b): Reagent tubes. The left molecular sieve (number 1 in Fig.10 (b)) is used to reference the N2 to purify CO2 and water vapor. The test stream from the furnace contains nitrogen, hydrogen, CO and CO2. This stream is purified in a first tube number 2, where the Schuetze reagent to keep the moisture and CO turnover in CO2. All the CO2 will then be recorded by the right molecular sieve (number 3 in Fig.10 (b)), and the measuring current only consists of nitrogen and hydrogen.. 3.2.1.2 Thermal conductor sensor The operation of this sensor is based on the thermal conductivity of gases and is used as a detector of hydrogen. The upper meter indicates the bridge power again in our equivalent to 8.5 mA. The bottom meter gives us the change in voltage caused by a variation in the temperature of the gases entering the test cell. 16.
(22) Development of an optimized methodology for tensile testing of Carbon steels in Hydrogen environment. The reference flow incorporates nitrogen, while the measuring current is a mixture of nitrogen and hydrogen. The more hydrogen the test current contains, the greater the difference in temperature between the reference flow and the flow measurement because of the large difference in thermal conductivity between hydrogen and nitrogen. This temperature difference is reflected in a change of voltage, reflecting the amount of hydrogen (ppm) can be determined.. 3.2.1.3 Oven The oven is the bottom of the cup holder in each analysis a new crucible of graphite inserted. Before we begin an analysis, the device is calibrated by using empty cups and reference materials. After sufficiently calibrated, a material inserted with a certain amount of hydrogen. The oven of the H-mat ensures that the material is in the melt state at a temperature between 1000 ° C and 2500 ° C. When the material is melted, the hydrogen desorption is detected. A pump is used to ensure a vacuum above the melt. The amount of dissolved hydrogen in the melt is proportional to the square of the partial pressure of hydrogen. In this partial vacuum pressure to zero and thus the amount of dissolved hydrogen.. Fig. 11: H-Mat Oven. 17.
(23) Development of an optimized methodology for tensile testing of Carbon steels in Hydrogen environment. 3.2.2. Universal Testing Machine INSTRON 5500R. Features: •. 250:1 force measurement range (i.e. use the load cell to down to 0.4% of full capacity with no loss of accuracy). •. Load accuracy of +/-0.5% of indicated load. •. 500 Hz synchronous data acquisition rate for all channels. •. Hardware control panel operator convenience. •. Automatic transducer recognition for load cells and extensometers. •. Bluehill® compatibility. •. Extra height and width options available. •. Second test space option. •. Library of ASTM and ISO test methods. •. Full CE compliance. 2. for. software. MODEL 5500R •. 50 kN (11,250 lbf) capacity. •. 0.001-500 mm/min (0.00004 – 20 in/min) speed range. Fig.12: Universal Testing Machine INSTRON 5500R. 18.
(24) Development of an optimized methodology for tensile testing of Carbon steels in Hydrogen environment. 3.2.3. Scanning Electron Microscope, JEOL JSM-700F. The JSM-7001F, Thermal Field Emission SEM, is a platform for demanding analytical applications as well as those requiring high resolution and ease-ofuse. The JSM-7001F has a large, 5-axis, fully eucentric, motorized, automated specimen stage, a one-action specimen exchange airlock, small probe diameter even at large probe current and low voltage, and expandability with geometry for EDS, WDS, EBSP, and CL. The specimen chamber handles specimens up to 200mm in diameter.. The JSM-7001F SEM also supports full integration of EDS, WDS, e-beam lithography, and an image database. Stage automation is standard with a 5-axis computer control of X, Y, Z Tilt and eucentric rotation.. 3.2.4. EBSD Technique. Electron backscatter diffraction (EBSD) [12] is a technique for obtaining crystallographic information from samples in the scanning electron microscope. In EBSD a beam of electrons is directed onto a tilted crystalline sample in a scanning electron microscope (SEM). The electrons undergo various interactions with the atoms in the crystal lattice and some of the electrons emerge from the sample. If a fluorescent phosphor screen is placed close to the 19.
(25) Development of an optimized methodology for tensile testing of Carbon steels in Hydrogen environment. sample a pattern is formed on the screen because the intensity of the emerging electrons varies slightly with direction. This pattern is called a diffraction pattern and its appearance is very striking. Unfortunately, there is no simple analogy in the everyday world for the physical phenomena of diffraction that causes the patterns. The symmetry and appearance of the pattern is related intimately to the crystal structure at the point where the beam meets the sample. If the crystal rotates (in other words its orientation changes) the diffraction pattern will be seen to move. If a different type of material is placed under the beam, the diffraction pattern will change completely. So the diffraction pattern can be used to measure crystal orientations and to identify materials.. Fig 13: View showing tilted sample and phosphor screen in SEM chamber.. Fig 14: Electron backscattering diffraction pattern from nickel. Microstructural analysis with EBSD Microstructure is important because it determines many of the physical properties of materials. For example, grain size can influence tensile strength and the properties of grain boundaries can determine the way in which materials fracture. Optical microscopy and scanning electron microscopy are both used to examine microstructure. Polishing and chemical etching can reveal the positions of grains and grain boundaries. However, these techniques may not reveal all the grains. This is where EBSD comes in - it measures crystal orientation and so must be able to show unambiguously the position of all grains and grain boundaries. 20.
(26) Development of an optimized methodology for tensile testing of Carbon steels in Hydrogen environment. Fig.15: A scanning electron micrograph of the microstructure of a steel sample. Fig.16: crystal orientation map from the same sample. Similar orientations are in similar colors. EBSD is used to form crystal orientation maps by scanning the electron beam over the sample and measuring the orientation from the diffraction pattern at each point. In a crystal orientation map points with similar crystal orientations are shown in similar colors. In these maps a grain is a region of the sample where the crystal orientation is the same within a certain orientation angle tolerance. The maps can be processed to show with certainty the position of all the grains and grain boundaries. EBSD is unique in that it provides a link between microstructure and crystallography. It complements conventional analysis techniques by providing definitive information about the crystal orientations present in the sample.. 21.
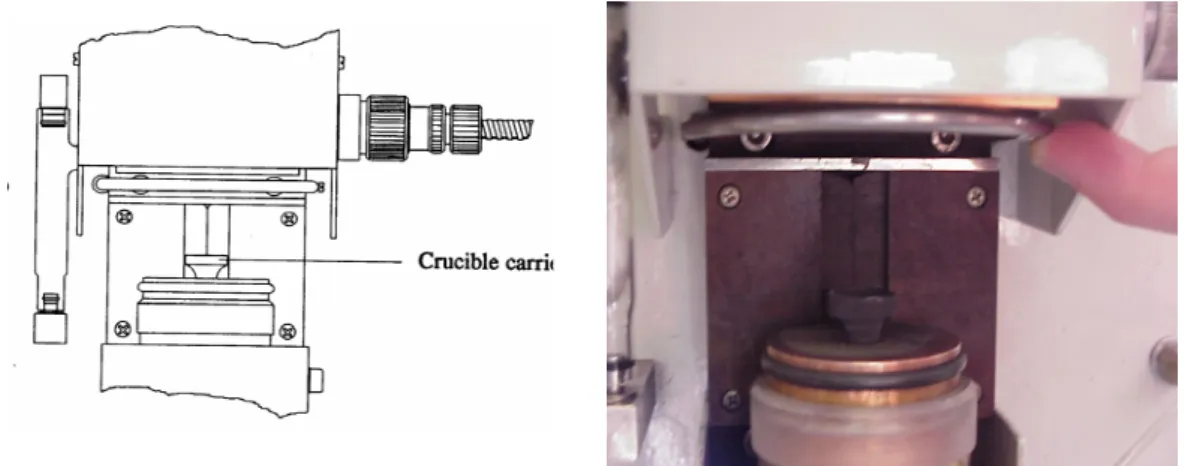
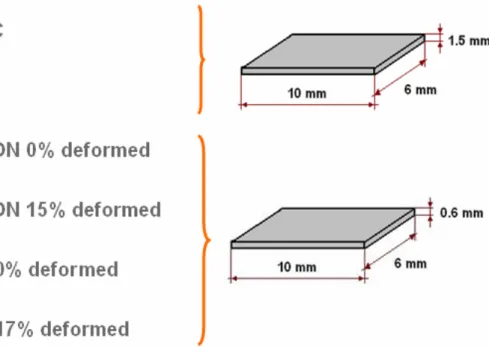
(27) Development of an optimized methodology for tensile testing of Carbon steels in Hydrogen environment. 4 H-CHARGING & SOLUBILITY This chapter is divided in four points, i.e. the sample geometry, the charging method, the type of electrolyte and the optimal charging parameters.. 4.1 Sample geometry The sample geometries used for determinate the total H-content is as follows:. The samples dimensions are specifically (6x10) mm2 to allow easy introduction inside the graphite capsules (fig. 17), used for to measure the total hydrogen content (H-ppm) in the materials with the H-mat machine.. SAMPLE. FURNACE. Ø = 11.20 mm Height = 14.20 mm Fig. 17: Graphite Capsule. Fig. 18: Graphite Capsule holder. 22. Fig. 19: H-mat furnace Schema.
(28) Development of an optimized methodology for tensile testing of Carbon steels in Hydrogen environment. The geometry of the samples for the tensile testing are explained in the respective chapter of tensile testing (5.2).. 4.2 Charging methods As the intention is to charge a steel substrate (sample) with hydrogen, and for that a high surface coverage of the substrate with Hads (1) is needed; (1). H+ + e- → Hads X. (2). Hads + Hads → H2. Therefore H2 (2) recombination has to be prevented. Second reaction step has to be blocked as it causes a bubble wall on the sample surface preventing the hydrogen entry into the material and as more H2, less H available for entry. This can be done by adding a “poison” for the recombination reaction to the electrolyte: e.g. Arsenic, Thiourea [4] To charge the materials with hydrogen three methods have been applied: i.. Chemical method. The chemical method involves immersing the sample in a glass recipient filled with HCl 37% for specifies times, causing a chemical redox reaction (3) on the surfaces of the sample. This reaction generates the hydrogen in the atomic form (Hads) (1) and also in gas state (H2) (5) [2]: (3). Fe + 2HCl → FeCl2 + H2. When two H+ ions collide at the surface of the steel electrode, an iron atom releases two electrons to the H+ ion. The iron atom enters the solution as an Fe2+ ion. The oxidation half-reaction is: (4). Fe(s) → Fe 2+ (aq) + 2e-. 23.
(29) Development of an optimized methodology for tensile testing of Carbon steels in Hydrogen environment. Each H+ from HCl solution captures one electron. These two ions form a Hydrogen molecule. The reduction half-reaction is: (5). 2H+ (aq) + 2e- → H2(g) Sample preparation for chemical method: •. Grinding the surfaces with grind paper P120. •. Cleaning with distilled water and acetone to have a surface free of oxide and dirt.. •. Hanging the samples on a metallic wire to avoid the contact with the bottom of the glass to have an homogeneous distribution. Fig. 20: Sample in HCl 37% solution. of the reaction on all surfaces. After the charging, the samples were cleaned again with distilled water and acetone to remove the rest of the HCl on the surfaces and dried with paper.. ii.. Galvanostatic method. The galvanostatic technique is the more common technique in which a constant cathodic current is maintained in the circuit containing the test specimen. The constant current produces an electrode potential that changes with time as the concentration of the environment changes as the result of precipitation of reaction products and gas evolution [3]. Sample preparation and montage done to implement the galvanostatic method: •. Grinding the samples surfaces with grind paper P120. •. Cleaning with distilled water and acetone to have a surface free of oxide and dirt. •. Welding the sample to a metallic wire. 24.
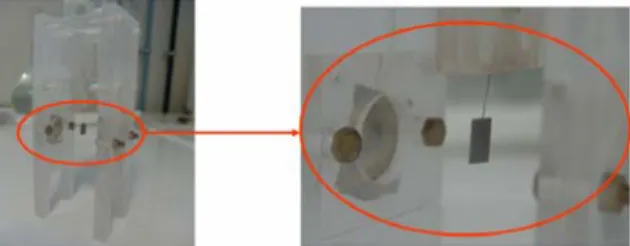
(30) Development of an optimized methodology for tensile testing of Carbon steels in Hydrogen environment. Fig. 21: Welded sample. •. Introducing the wire in the plastic holder and place it in the cell ensuring that the sample is located exactly between the two platinum anodes.. Fig. 22: Detail of the sample between the two platinum disks. •. Filling a glass recipient with the electrolyte until cover the sample and platinum disks.. Fig. 23: Overview of the cell ready. •. To realize the connections between the galvanostatic source and the cell:. Fig. 23a: Shows the cell connected to the. Fig. 23b: Working schema of the. galvanostatic source. galvanostatic method in the cell. 25.
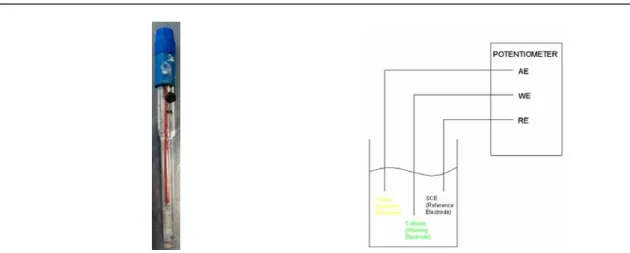
(31) Development of an optimized methodology for tensile testing of Carbon steels in Hydrogen environment. The two platinum disks located on the walls of the cell structure are acting as the anodes and the sample as the cathode. The cathode (sample) is connected to the ground or negative pole, and the anodes (Pt disks) are connected to the positive pole on the galvanostatic source. When switching on the power source, flow from the anode to the cathode. It generates redox reactions on the material and electrolyte solution causing oxidation on the anode electrode (6) and reduction on the cathode electrode (7) which induces the adsorption and absorption of Hydrogen into the material. (6). H2O → O 2+ and H+. (7). 2H+ + 2e- → H2(g). After the necessary time, the sample is cleaned with distilled water and acetone to remove the rest of electrolyte solution on the surfaces. (Sometimes is needed to grind the surface after charging to remove deposits from the surface). iii.. Potentiostatic method. The potentiostatic technique maintains the electrode potential of the test specimen constant versus a standard reference electrode. The current path is maintained in the circuit containing the tension test specimen and the counter electrode, but it is not kept constant. Instead, the current is allowed to float and become the dependent variable. With this technique it is imperative that a reference electrode be used in the electronic circuit for continuous monitoring of the electrode potential of the test specimen [3].. Sample preparation and montage done to implement the potentiostatic method: The sample preparation and the montage are exactly the same as for the galvanostatic method except for the reference electrode that must be used in potentiostatic method: •. To control the potential of corrosion a Saturated Calomel Electrode (SCE) with a reference voltage of +240 mV is used. 26.
(32) Development of an optimized methodology for tensile testing of Carbon steels in Hydrogen environment. Fig. 24a: SCE reference electrode. Fig. 24b: Schematic of the connections for potentiostatic method. After the charging, the sample is cleaned with distilled water and acetone to remove the rest of electrolyte solution on the surfaces.. 4.3 Electrolyte solutions The electrolyte is a medium that conducts an electric current when is dissolved in a solvent, usually water. Electrolytes are composed of positively charged species, i.e. “cations”, and negatively charged species, i.e. “anions”. For this study are needed electrolytes for the H+ cation formation to achieve the Hydrogen adsorption. Several types of compounds have been found to promote the entry of hydrogen into metals from both liquid and gaseous environments. The same types of compounds are known to poison catalysts for hydrogenation reactions in heterogeneous systems. Promoters and poisons show their full effect at relatively very low concentrations. Among the species found to promote hydrogen entry are [7]: 1) Certain compounds of the following elements: . Phosphorus, arsenic, and antimony belonging to the V-A periodic Group, sulfur, selenium, and tellurium belonging to the VI-A periodic Group.. 2) The following anions: . CN- (cyanide), CNS- (rhodanide), and I- (iodide). 27.
(33) Development of an optimized methodology for tensile testing of Carbon steels in Hydrogen environment. 3) The following compounds of carbon: . CS2 (carbon sulfide), CO (carbon monoxide), CON2H4 (urea), and CSN2H4 (thiourea).. Different electrolytes were used to see the effect on H-charging of the various steels. The electrolytes used among the study were: o 0.5 g As2O3 + 0.25 g HgCl2 + 60 ml H2SO4 / l H2O o 10 g CSN2H4 + 4 g NaOH / l H2O o 5 g CSN2H4 + 4 g NaOH / l H2O. [4]. [5] [5]. o 5 g CSN2H4+ 0.5 M H2SO4 / l H2O. [6]. o 1 g CSN2H4 + 0.5 M H2SO4 / l H2O. [6]. o 3.5 wt% NaCl in H2O [9]. 4.4 Results and discussion 4.4.1 Chemical method A. H-discharging charts: For the chemical charging method with HCL 37%, the effect of the discharging time was studied. The samples were charged during 10 and 30 minutes and, from 20 and 7200 seconds after charging, the H-content was analyzed with the H-mat. The procedure can be better understood seeing the following schematic graph:. Fig. 25: schematic discharging time curve. 28.
(34) Development of an optimized methodology for tensile testing of Carbon steels in Hydrogen environment. The blue points represent the samples without charge. Just after charging during 10 or 30 minutes, the H-content is represented with the orange points and with the passing time, the samples are diffusing out the hydrogen until reach the black points, where the H-content becomes almost constant, what means the material has discharged the most part of the hydrogen that was introduced, although part of it is trapped on the microstructure defects (dislocations, traps, etc). Each material will have a different curve permitting to identify the Hdischarging behavior e.g. which material adsorbs more hydrogen, which material diffuse faster and with which tendency, the effect of the microstructure, etc. The following graphs show the H-discharging curves for the different materials. OVERLAY 10' Charging in HCL 37% 12 HCT800C HCT800C UNCHARGED S700 MC S700MC UNCHARGED PURE IRON 0% PURE IRON 0% UNCHARGED PURE IRON 15% PURE IRON 15% UNCHARGED TRIP 700 0% TRIP 700 0% UNCHARGED TRIP 700 17% TRIP 700 17% UNCHARGED. 11 10. H - Content, ppm. 9 8 7 6 5 4 3 2 1 0 0. 500. 1000. 1500. 2000. 2500. 3000. 3500. 4000. 4500. 5000. 5500. 6000. 6500. 7000. Time, s Graph 2: Overlay of H-discharging time after 10 minutes ucharging on HCL 37%. 29. 7500.
(35) Development of an optimized methodology for tensile testing of Carbon steels in Hydrogen environment. OVERLAY 30' Charging in HCL 37%. 13. HCT800C HCT800C UNCHARGED S700 MC S700MC UNCHARGED PURE IRON 0% PURE IRON 0% UNCHARGED PURE IRON 15% PURE IRON 15% UNCHARGED TRIP 700 0% TRIP700 0% UNCHARGED TRIP 700 17% TRIP700 17% UNCHARGED. 12. H - Concentration, ppm. 11 10 9 8 7 6 5 4 3 2 1 0 0. 500. 1000. 1500. 2000. 2500. 3000. 3500. 4000. 4500. 5000. 5500. 6000. 6500. 7000. 7500. Time, s Graph 3: Overlay of H-discharging time after 30 minutes charging on HCL 37%. B. Effect of charging time: The differences between the two charging times (10 and 30 minutes) are not significant. Comparing the materials for each charging time, all of them (except pure Fe 15 % deformed) charging during 30 minutes are around 1 H-ppm higher than the ones 10 minutes charging. The different charging times in HCL 37% don’t have an essential influence on the H-discharging effect. C. Effect of the microstructure: The microstructure of the materials has a big influence on the H-diffusivity. The results can be seen on the previous graphs where each material has a different H-content after being charging in the same conditions and times. TRIP700 and PURE FE are the ones who have the highest and lower Hcontent, respectively, and it could be due to the microstructure. The solubility of hydrogen in iron depends on the crystalline structure, and changes as the result of phase transitions. Hydrogen has a higher solubility in γ-Fe than in α–Fe.. 30.
(36) Development of an optimized methodology for tensile testing of Carbon steels in Hydrogen environment. The ferritic microstructure (α) has the property of the low solubility and fast diffusion property for hydrogen. The austenitic microstructure (γ) has the opposite property, high solubility and slow diffusion. TRIP700 0% deformed contains a ferritic, retained austenitic (γ) and bainitic microstructure being the answer why is charging more than Pure Fe, that has an α–Fe matrix. Another reason why TRIP700 is higher in H-content is because the grain boundaries, dislocations and phases boundaries retains the hydrogen and provoke a diminution of the H-diffusion. D. Effect of the deformation: When the TRIP700 is deformed (to 17% for this study), the retained austenite becomes martensite (α ‘) staying the bainitic and ferritic phases. Also, to deform the material generates dislocations into the material that are traps for the hydrogen. With the Pure Fe happen the same, when is deformed (to15% for this study) generates H-traps. This is the reason why the curves of the deformed TRIP and Pure FE materials are higher than the non-deformed, the hydrogen can be adsorbed in more quantity and diffuse less because the traps generated during the deformation process. The chemical method advantages/disadvantages are: Advantages: -. possible to H-charging easily on the samples Disadvantages:. -. is not possible to control the amount of the entering H-ppm. -. the reactions occurring during H-charging between the steel and HCL causes an important decompounding of the material.. Basically for these two reasons, this method was not chosen for the future tensile testing.. 4.4.2 Potentiostatic & galvanostatic method For the potentiostatic and galvanostatic method, S700 MC steel was used using two different electrolytes. 31.
(37) Development of an optimized methodology for tensile testing of Carbon steels in Hydrogen environment. For potentiostatically charging curves (Graph 4a & 4c) there are just two voltage points represented, at -0.6mV and -1.2 mV (the reason is because on the references confines this voltage rang for hydrogen charging [8-9]). The correlation between these two voltages with a current value on the galvanostatic method is 0.1 and 1 mA/cm2 for -0.6 and -1.2 mV respectively. S700 MC. S700 MC. Charging 1 hour in "35g NaCl / I H2O" on POTENTIOSTAT. Charging 1 hour in "35g NaCl / I H2O" on POWER SOURCE 7. 7.00 S700 MC Uncharged. 6.50 6.00. 6. S700 MC Charged NaCl. H-concentration, ppm. 5.50. H-concentration, ppm. S700 MC Charged NaCl. 6.5. 5.00 4.50 4.00 3.50 3.00 2.50 2.00 1.50 1.00. S700 MC Uncharged. 5.5 5 4.5 4 3.5 3 2.5 2 1.5 1 0.5. 0.50. 0. 0.00 0. 0.2. 0.4. 0.6. 0.8. 1. 1.2. 1.4. 1.6. 1.8. 2. 2.2. 0. 2.4. 2. 4. 6. 8. Voltage, - mV. 10 12 14 16 18 20 22 24 26 28 30 32 34 36 38 40 42 44 46 48 50 52 54 56. Current Density, mA/cm 2. Graph 4a: S700 MC charged Vs SCE potentiostatically with “3.5 wt% NaCl” solution. Graph 4b: S700 MC charged galvanostatically with “3.5 wt% NaCl” solution. S700 MC. S700 MC. Charging 1 hour in "10g Thiourea + 4g NaOH / I H2O" on POTENTIOSTAT. Charging 1 hour in "10g Thiourea + 4g NaOH / I H2O" on galvanostatic source 7 6.5. 7 6.5. 6. S700 MC Charged. H-concentration, ppm. H-concentration, ppm. 6 5.5. S700 MC Uncharged. 5 4.5 4 3.5 3 2.5 2 1.5. 5.5 5 4.5 4 3.5 3 2.5 2 1.5. 1. 1. 0.5. 0.5. 0. S700 MC Charged. S700 MC Uncharged. 0 0. 0.1. 0.2. 0.3. 0.4. 0.5. 0.6. 0.7. 0.8. 0.9. 1. 1.1. 1.2. 1.3. 1.4. 1.5. 1.6. 0. 2. 4. 6. 8. Voltage, - mV. Current Density, mA/cm 2. Graph 4c: S700 MC charged potentiostatically with “10g Thiourea + 4g NaOH” solution. Graph 4d: S700 MC charged galvanostatically “10g Thiourea + 4g NaOH” solution. S700MC. Graph 4a & 4b show the results. H-charging in 35g NaCl / l H2O. of H-charging in 35g NaCl / l. 3.50 3.25 3.00 2.75. H content, ppm. 2.50. MINIMUM VOLTAGE/CURRENT APPLIED. H2O. MAXIMUM VOLTAGE/CURRENT APPLIED. 3.17. AVERAGE UNCHARGED SAMPLES. 2.25. 2.32. 2.00 1.75. 2.260. 1.986. 1.50 -1.2 mV. 1.25 1.00. 10 12 14 16 18 20 22 24 26 28 30 32 34 36 38 40 42 44 46 48 50 52 54 56. 50mA/cm 2. applying. potentiostatic and galvanostatic methods. When is applied the lowest or highest current/voltage. 0.8 mA/cm2. value (depending of the method). 1.470. 0.75. solution,. -0.6 mV. the H-content doesn’t changes in. 0.50 0.25 0.00. Uncharged. Potentiostatic. Galvanostatic. excess (Graph 5), what means this electrolyte is not valid to. Graph 5: Comparison of the H content for each charging method. reach the aim of the study. therefore is not going to be used on the future tensile testing. 32.
(38) Development of an optimized methodology for tensile testing of Carbon steels in Hydrogen environment. Graph 4b & 4d shows. S700MC. the results for the 10g. H-charging in 10g thiourea + 4g NaOH / l H2O 6.50. Thiourea + 4g NaOH /. 6.00 MINIMUM VOLTAGE/CURRENT APPLIED. 6.040. 5.50 MAXIMUM VOLTAGE/CURRENT APPLIED 5.00. AVERAGE UNCHARGED SAMPLES. H content, ppm. 4.50. 50 mA/cm2. 4.00 3.50. l H2O solution. This time the material is being. 3.760. higher. H-. As. the. charged.. 3.00 2.50. -1.2 mV. 2.00. 2.240. 1.50. 1.470. 1.00. 0.8 mA/cm2. 1.010. 0.50. -0.6 mV. 0.00. UNCHARGED. POTENTIOSTATIC. GALVANOSTATIC. Graph 6: Comparison of the H content for each charging method. maximum. voltage. applicable. with. potentiostatic method corresponded around to 3 ppm of charged hydrogen,. and. the. galvanostatic method was selected for the future tensile tests. Indeed, The Graph 6 gives an easy way to understand how different are acting the two different electrolytes. galvanostatic method gives more charging options (from 2 to 6 H-ppm). Once the optimal method is known for use on future experiments, TRIP700 (0% deformed) steel was tested with different electrolytes for obtain the optimal one which gives more options on the H-charging.. TRIP700 0% Pre-charging 1 hour in differents electrolytes 26. Uncharged Electrolyte 1 (0.5 g As2O3 + 0.25 g HgCl2 + 60 ml H2SO4 / l H2O) Electrolyte 2 (5g Thiourea + 4g NaOH) Electrolyte 3 (10g Thiourea + 4g NaOH) Electrolyte 4 (1g Thiourea + 0.5M H2SO4) Electrolyte 5 (5g Thiourea + 0.5M H2SO4). 24 22. H-content, ppm. 20 18 16 14 12 10 8 6 4 2 0 0. 2. 4. 6. 8 10 12 14 16 18 20 22 24 26 28 30 32 34 36 38 40 42 44 46 48 50 52 54 56. Current Density, mA/cm 2 Graph 7: Overlay of H-concentration Vs current applied for TRIP700 in different electrolytes. 33.
(39) Development of an optimized methodology for tensile testing of Carbon steels in Hydrogen environment. Must be taken into account these different electrolytes were prepared and tested in a chronologic order during this study. It means for some tensile testing in the following chapters, will be used different electrolytes that, maybe, weren’t the optimal in each case. The previous chart (Graph 7) shows the H-charging effect on TRIP700 steel with five different electrolytes. All of them are commented in chronologic order of using as follows : -. “0.5g As2O3 +25g HgCl2 + 60 ml H2SO4” electrolyte was the one in use before start this study, but for healthy reasons has been searched for new ones on different bibliographies.. -. were used the “thiourea + NaOH” electrolytes that in comparison with the first one, the H-content was much more lower allowing a maximum Hconcentration value of 4 H-ppm either varying the amount of thiourea per liter of solution.. -. For last, were tested the “thiourea + H2SO4” electrolytes, reaching values of H-content around the first electrolyte.. On the following graph (Graph 8), is shown, in a form of comparison, the Hcontent for 3 different applied current densities with the five different electrolytes for the same material: TRIP700 0% H-content Vs different electrolites 26 24 22 20. H-content, ppm. 18. 5g THIOUREA + 4g NaOH / l H2O 10g THIOUREA + 4g NaOH / l H2O 1 g Thiourea + 0.5 M H2SO4 / l H2O 5 g Thiourea + 0.5 M H2SO4 / l H2O 0.5 g As2O3 + 0.25 g HgCl2 + 60 ml H2SO4 / l H2O. 16 14 12 10 8 6 4 2 0 0.8 mA/cm2. 20 mA/cm2. 50 mA/cm2. Current density, mA/cm2. Graph 8: Overlay of H-concentration Vs current applied for TRIP700 in different electrolytes. 34.
(40) Development of an optimized methodology for tensile testing of Carbon steels in Hydrogen environment. Doesn’t give more information than the previous curves graph, but let more clear how the two electrolytes with NaOH are the ones that are charging lower, reaching a maximum value of 4 H-ppm when, for the same current density (50mA/cm2), and replacing the 4g NaOH for 28ml (0.5M) of H2SO4 is reached 21 H-ppm. The arsenic containing electrolyte is comparable with the 5g Thiourea + sulfuric acid due to the closed values reached. For that reason, was replaced the arsenic electrolyte for that one for future works.. 35.
(41) Development of an optimized methodology for tensile testing of Carbon steels in Hydrogen environment. 5 DEVELOPMENT OF A TENSILE TESTING METHODOLOGY This chapter will explain the different types of tensile testing on various steels and the methodology followed for each one to observe the effects of hydrogen on mechanical properties when stress is applied. Depends on the test type applied, different samples geometries and preparation were used and will be defined in their respective test type chapter.. 5.1 Standard Tensile Testing in air The standard tensile testing provides information on the strength and ductility of the materials under uniaxial tensile stress in air. This test was done on the reference samples (without H-charging process applied) to compare with the hydrogen charged ones. The tests were done according to the guidelines of the “Tension Testing of Metallic Materials” standard [10]. In the following chapters, the references curves are represented together with the H-charged samples curves to facilitate the comparison.. 5.2 SSRT: Slow Strain Rate Testing Slow strain rate testing, also known as constant extension rate testing (CERT), is a slight modification of the standard tension test. A more detailed description of this test method is given in ASTM G129 [11]. The benefit of SSRT testing is that it produces a result in a reasonably short time depending on strain rate. It also reduces incubation time to the onset of cracking in susceptible materials. The material used for the SSRT was S700 MC and the sample dimensions were in mm:. 36.
(42) Development of an optimized methodology for tensile testing of Carbon steels in Hydrogen environment. Fig. 26: S700MC sample dimensions for tensile testing. A. sample preparation: . The edges of all the samples tested in the electrolytic cell were rounded with an special equipment in order to avoid defects in the corners which could help the crack initiation (Fig. 27a). . The radius has a value of approximately 0.2mm. . The decrement of cross sectional area has not been considered due to its small value.. Fig. 27a: Rounding a sample’s edges. . Fig. 27b: Detail from the rounded edges. The samples were polished with grind paper P120, cleaned with distilled water and acetone to obtain a homogenous surface without surface contaminants.. Fig. 28: Grinding a sample. . To allow electrochemical charging with H, a glass cell was mounted on the tensile machine around the sample. This cell contains two platinum 37.
(43) Development of an optimized methodology for tensile testing of Carbon steels in Hydrogen environment. flat electrodes which act as anode; the tensile sample acts as cathode. (Fig. 29) . Charging solution: 10g Thiourea + 4g NaOH / L H2O It was decided to test the samples with a hydrogen concentration of around 3.5 ppm. To determine the current density, the graph shown in graph 4d was used. From this graph, it is clear that the current density of 4 mA/cm2 must be applied. The corresponding total current was calculated as Fig. 29: Electrolytic cell. follows:. 4. mA × 65.50cm 2 = 262mA 2 cm. = The sample surface in contact with the electrolyte Fig. 30: The orange lines delimit the surface in contact with the electrolyte.. To introduce 3.5 H-ppm is needed to apply 262mA on the tensile sample. B. Testing procedure: The purpose of these tests was: -. to evaluate the effect of different pre-charging times. -. to evaluate the effect of different strain rate Due to the impossibility of using an extensometer inside the electrolytic. cell, a reference sample (tested in air applied on it) was used to measure the strain as a function of the crosshead displacement. (Fig. 31). 38.
(44) Development of an optimized methodology for tensile testing of Carbon steels in Hydrogen environment. Fig. 31: Extensometer-Crosshead relation for S700MC. C. Strain rate effect: A reference sample was tested at 5mm/min in air using an extensometer. Subsequently the co-relation was made between the extensometer and crosshead displacement (Fig. 31) to recalculate the tensile data obtained for the charged samples. 6 samples were tested with the same pre-charging conditions: -. 1 hour pre-charging + continued charging during the test.. -. Electrolyte: “10g Thiourea + 4g NaOH / L H2O “. 6 strain rates were tested 0.1, 0.5, 2.5, 12.5, 60 and 100 mm/min. The following graph shows the results obtained:. 39.
(45) Development of an optimized methodology for tensile testing of Carbon steels in Hydrogen environment. DIFFERENT STRAIN RATE S700MC 1h Pre-charged in "10g Thiourea + 4g NaOH/L H2O" at 4 mA/cm2 (3,5 H-ppm) 1000 900 800 700. Stress, MPa. 600 500. Reference uncharged (5mm/min) 400. 0.1 mm/min 0.5 mm/min. 300. 2.5 mm/min 200. 12.5 mm/min 60 mm/min. 100. 100 mm/min. 0 0. 2. 4. 6. 8. 10. 12. 14. 16. 18. 20. Extensometer STRAIN , %. Graph 9: S700MC different strain rate “Stress-Strain”. The curves (Graph 9) illustrate a reduced ductility for the slowest strain rates. This confirms that lower strain rates allow the entry the maximum amount of hydrogen into the material due to the longer testing time for low strain rates and. Apparently, seems correct to conclude that the H-charging time has a significantly effect on the results (Graph 10), but this will be detailed on the following sub-chapter “D. Effect of pre-charging time” . DIFFERENT STRAIN RATE S700MC 1h Pre-charged in "10g Thiourea + 4g NaOH/L H2O". 1000 900 800 700. Stress, MPa. 600 REFERENCE (5 mm/min). 500. 0.1 mm/min 400. 0.5 mm/min. 300. 2.5 mm/min 12.5 mm/min. 200. 60 mm/min 100 100 mm/min 0 0. 500. 1000. 1500. 2000. 2500. 3000. 3500. 4000. 4500. 5000. Time, sec. Graph 10: S700MC different strain rate “Stress-Time”. 40. 5500. 6000. 6500. 7000.
(46) Development of an optimized methodology for tensile testing of Carbon steels in Hydrogen environment. D. Effect of pre-charging time: A reference sample was tested in air at 0.1 m/min. This strain rate was then applied for all tests with in-situ charging. The time of pre-charging was varied: 0.5, 1, 2, 5 and 6 hours. The electrolyte used was again “10g Thiourea + 4g NaOH / L H2O”. The following graph shows the results obtained: Effect of pre-charging time S700MC 2. Pre-Charging in "10g Thiourea + 4g NaOH/L H2O" at 4 mA/cm and tested at 0.1 mm/min 1000 900 800 700. Stress, MPa. 600 500 Reference (non-charged) 400. 30 ' 1h. 300. 2h 200. 5h 8h. 100 0 0. 2. 4. 6. 8. 10. 12. 14. 16. 18. Extensometer* STRAIN, %. Graph 11: S700MC different pre-charging times “stress-strain”. The results show no clear effect of the pre-charging time on the rupture strain: The rupture strain points for the different pre-charging times are not the expected ones. The samples that were pre-charged longer times, were expected to break at lower strain values, more brittle than the ones pre-charged for shorter times. It means that the reference sample tested in air, which had no H-charging, should have the highest rupture strain value, and decreasing on the strain axis direction followed by the one pre-charged 30’, after 1 hour , 2h, 5h and arriving to the most brittle sample: the one pre-charged 8 hours. The curves obtained didn’t show that expected behavior, all the samples have broken at the same strain level of 11 ~ 12 % meaning the pre-charging time doesn’t influence on the losing of ductility of the material.. 41.
(47) Development of an optimized methodology for tensile testing of Carbon steels in Hydrogen environment. CONCLUSION SSRT: -. This method of testing reveals hydrogen effect on the results. -. Contradiction on the H-charging time influence: o for different strain rates, the time has a notable influence on the losing ductility. o for the same strain rate but different pre-charging times doesn’t have almost any influence.. 5.3 Incremental Step Loading Technique This method is extracted from the standard test method “Measurement of Hydrogen Embrittlement Threshold in Steel by Incremental Step Loading Technique” [8] and establishes a procedure to measure the susceptibility of steel to a time-delayed failure by hydrogen. It does so by measuring the threshold for the onset of subcritical crack growth using standard fracture mechanics specimens or irregular-shaped specimens such as notched round bars. The applied stress-time curve is shown in the graph 12 and is explained further.. Fig. 32: Notch detail of a S700MC round sample. This method measures the load necessary to initiate a subcritical crack in the steel at progressively decreasing loading rates. The test is performed in a controlled environment, to measure the effect of hydrogen introduced into the steel as a result of external sources of hydrogen. The material used for this test was S700MC and the sample dimensions are (mm): 42.
(48) Development of an optimized methodology for tensile testing of Carbon steels in Hydrogen environment. Fig. 33: S700MC round notched sample dimensions for tensile testing. The heads of the sample are threaded to add an extension on each head, which allows to fix the samples on the gripping devices of the tensile machine.. Apparatus: -. Testing Machine: Universal Testing Machine INSTRON 5500R {A1.2}. -. Test environment: 10g Thiourea + 4g NaOH / L H2O (~3.5 ppm of charged H). -. Galvanostatic control: The intensity to apply to the electrolyte can be controlled directly from the power source without needing a reference electrode. Depending the current applied is entering different amount of hydrogen into the steel, ranging from 0.0 to 4.0 A.. It was decided to test the samples with a hydrogen concentration of 3.5 ppm, which means the current density of 4 mA/cm2 must be applied. The total applied current was calculated as follows (taking into account the contact area between sample and electrolyte): Sample preparation: -. The samples were cleaned with distilled water and acetone. -. The extensions were mounted on the samples.. -. The sample was introduced into the electrolytic cell which was then filled with the electrolyte.. -. Pre-charging during 1 hour before the start of the test and in-situ charging during the test. 43.
(49) Development of an optimized methodology for tensile testing of Carbon steels in Hydrogen environment. 4 mA/cm2 x 35 cm2 = 140 mA. Fig 34:: The orange lines delimit the surface in contact with the electrolyte.. To introduce 3.5 H-ppm is needed to apply 140 mA on the tensile sample. Testing procedure : -. A reference test (ASTM E-8) to rupture was done to establish the maximum fracture load (Pc) in air.. -. Another sample Pi1 was tested with H-charging by applying an stepwise load increments under displacement control in tension, programmed to attain Pc.. -. Another sample was tested using stepwise load increments to attain Pc at a slower loading rate, by using the same load increment and doubling the time increment. This load sequence will establish the value designated as Pi2.. -. Subsequent specimens are tested at progressively decreasing loading rates to attain Pc. This testing sequence will continue until a significant drop in load is detected that will establish the value designated as e.g. Pi3. It is suggested that with the subsequents tests the time increment is doubled, only for stress values in excess of 0.5Pi. The procedure shall be continued until an invariant value (Pth) is obtained.. Fig. 35: Schematic of suggested protocol for a step loading profile to determine threshold. 44.
(50) Development of an optimized methodology for tensile testing of Carbon steels in Hydrogen environment. To program these steps, the following step profile was applied: Test Number of Steps (± 5% Accuracy) / % Pc/ Time increment (h). •. For specimen #1 : –. •. 20 / 5 / 1 = 20 steps / 5% Pc/ 1 hour. For specimen #2: –. 20 / 5 / 2 = 20 steps / 5% Pc/ 2 hours. … Results The reference sample gives a value of maximum tensile stress of 820 MPa (on the notched geometry). After that it is possible to program the rest of steps: Step 1: Each step must be 5 % of the maximum stress of the reference, which means 820 MPa x 0.05 = 41 MPa. 20/41/1 = 20 steps of 41 MPa increasing remaining at constant load during 1 hour between each step. Step 2: The same stepwise increase but remaining 2 hours between two increments. Step 3: The same stepwise but remaining 4 hours between two increments. Step 4: was applied a different increasing mode: (7/41/4) + (13/41/8).. Graph 12: Incremental steps loading for S700MC round notched samples pre-charging 1 hour in 10g Thiourea + 4g NaOH / l H2O and during the test.. 45.
(51) Development of an optimized methodology for tensile testing of Carbon steels in Hydrogen environment. A tendency might be observed in the curves, although there’s a significant scatter, the trendline associated to the breaking points gives us an approximation of the threshold stress for the material S700MC, which is around 450 MPa. In the following picture is shown the broken samples, permit to see that all of them have broken on the notch:. Fig. 29: S700MC notched round broken samples for incremental steps loading. CONCLUSION ISLT: •. + As is an standardized test, the acceptance is correct. •. + Seems a powerful test for future studies.. •. - Extensive sample preparation to fabric the round bars and the notch.. •. - Is Needed a minimum thickness of material, not possible for flat plates. •. - Potentiostatic procedure is not straightforward. 5.4 Constant Load Testing For this test type, instead of keeping a constant crosshead velocity (mm/min) during the test, a fixed tensile stress (MPa) must be applied to the samples. The aim of this paragraph was twofold. On the one hand, to develop a useful methodology to do this type of testing (e.g. notches with different profiles can be introduced); On the other hand, to evaluate the effect of microstructure and strength level on the H-embrittlement of carbon steel. The first step was to evaluate some results of constant load testing done prior to this study began to have an idea of the things that should be modified: -. The materials tested in 2008 were: S700MC, DP1000, DP600, FB450 46.
(52) Development of an optimized methodology for tensile testing of Carbon steels in Hydrogen environment. -. The charging parameters were: 10 mA/cm2 in “0.5 g As2O3 + 0.25g HgCl2 + 60 ml H2SO4 / l H2O” electrolyte. (without pre-charging time), introducing around 13 ppm of hydrogen (Graph 7).. 900. 800. 700. Constant Load (MPa). 600. 500. 400. 300. 200 S700MC DP600 FB450 DP1000 Log. (S700MC) Log. (FB450) L (DP600). 100. 0 0. 2000. 4000. 6000. 8000. 10000. 12000. 14000. Rupture Time (sec). Graph 13: Constant load testing for non-notched samples. (2008 results, cfr. J. Galan. Lopez). As shown on the graph, a threshold value could be observed for each material below which no fracture occurred. However, some scatter exists on the data points, and when observing the broken samples after the tests (Fig. 30), it is possible to see that all the samples are broken at different sites.. Fig. 30: Images of broken samples (2008 results, cfr. J. Galan Lopez). 47.
(53) Development of an optimized methodology for tensile testing of Carbon steels in Hydrogen environment. To decrease the scatter a notch was introduced on the samples to force the crack initiation on it. Two different materials (F6 and F7) high-strength martensitic steels were notched to reach the objective.. Fig 31: F6 & F7 rectangular notched sample dimensions for constant load testing (mm). With the H-mat the approximate amount of hydrogen was checked for various current densities: Applying 1 mA/cm2 on the. F6 Precharging 10' in "10g Thiourea + 4g NaOH / I H2O" on Galvanostatic method. 11. sample. 10. inside. a. “10g. H-concentration, ppm. 9. Thiourea + 4g NaOH / L H2O”. 8 7. electrolyte introduced over 6. 6 5 4. ppm of hydrogen into the. 3 2. F6 Charged. material. Samples were pre-. F6 Uncharged. 1 0 0. 0.5. 1. 1.5. 2. 2.5. 3. 3.5. 4. 4.5. Current Density, mA/cm. 5. 5.5. 6. 6.5. 2. Graph 14: F steel H-concentration Vs Current density. 7. charged 30 minutes before the. start. of. the. testing.. Constant loads were applied. The sample preparation before testing was the same as for the previous samples. After all testing, only 2 samples were found to be broken at the notch; the others were broken at different locations outside the notch. Therefore, the curves were recalculated changing the values of the notched sections to the real broken sections. The curves are shown in the Graph 15:. 48.
(54) Development of an optimized methodology for tensile testing of Carbon steels in Hydrogen environment. Graph 15: Constant load curves for F6 and F7 steels based on the broken section. A slightly different sensitivity can be seen between both materials, where F7 brakes slightly faster than F6 for identical boding conditions. Extra testing with lower constant loads, would allow revealing the threshold stress value. However, no more samples were available. The next step was introduced another kind of notch that would concentrate the stress even more. The same rectangular constant load samples that were used for the previous study were notched as shown below:. Fig. 32: rectangular notched sample dimensions for constant load testing (mm). Fig. 33. Notched samples. Fig. 34: Detail of the notch.. 49.
(55) Development of an optimized methodology for tensile testing of Carbon steels in Hydrogen environment. 6 EFFECT OF MICROSTRUCTURE ON HYDROGEN EMBRITTLEMENT The materials were the same as for the previous study, adding one more grade: FB450, S700MC, DP600, DP980 and DP1200. The sample preparation was the same as for the previous testing (SSRT) except for the DP1200 that had a Zn coating which was removed with a grinder in order to avoid any effect on the hydrogen absorption. The thickness reduction due to this grinding process was approximate Fig 35: DP1200 sample with Zn coating removed.. by 20μm (10μm each side).. The charging conditions were: -. Current density applied: 10 mA/cm2 ≈ 10 H-ppm introducing.. -. For a surface in contact with the electrolyte of 38.38 cm2 x 10 mA/cm2 ≈ 768 mA. -. Electrolyte used: 1g Thiourea + 28 ml H2SO4 / L H2O. -. Precharging time: 15 minutes Some of these samples were tested charged and in air in a constant load. test to observe if were breaking on the notch, and proceed with this geometry in affirmative case. All of them did and. Then, as the first aim of this chapter was reached, the next objective was testing the materials to obtain an approximation of the threshold stress level and observe the different sensitivities due to the H-effect. PROCEDURE: Before starting the constant load tests, reference slow strain rate tests were done in air at 5 mm/min to determinate the mechanical properties on the notched samples. The strain data was obtained directly from an extensometer without recalculate any curve. 50.
(56) Development of an optimized methodology for tensile testing of Carbon steels in Hydrogen environment. The stresses were calculates on the smaller surface of the sample, by reason of is the surface with higher stress concentrate: As is shown on the Fig. 36, the forces applied are vertically opposites generating stress on the sample.. σ=. The. F [N ] S mm 2. [. stress. can. be. defined. as:. ]. The stress will increase when the surface decrease. Therefore, for the study, the stresses were calculated using the critical surface (Sc) of the notch where will be the maximum stress concentrate.. Fig. 36: Tensile sample section 1400. S700MC reference. 1300. FB450 reference. 1200. DP1200 reference 1100. DP980 reference DP600 reference. Tensile Stress, MPa. 1000 900 800 700 600 500 400 300 200 100 0 0. 0.5. 1. 1.5. 2. 2.5. 3. 3.5. 4. 4.5. 5. 5.5. 6. Extensometer Strain, %. Graph 16: Reference curves and offset yield strength.. MATERIAL Rp0.2 (MPa) FB450. 430. S700MC. 960. DP600. 345. DP1200. 1200. DP980. 870. Table 16: Yield S. 51. 6.5. 7. 7.5. 8. 8.5.
(57) Development of an optimized methodology for tensile testing of Carbon steels in Hydrogen environment. Once the Rp0.2 was known, the materials were tested at constant load. For each material the following stress levels were tested: 350 400 420 425 437 450 463 475 485 500. FB450 (MPa). S700MC (MPa). 400 450 500 550 600 650 675 700* 750 800. DP600 (MPa). 400 425 437 450 463 475 485 500. 100 200 300 400 500 600 700* 800. D1200 (MPa). 200 220 275 350 450 500 550 600 650 700 750 800. DP980 (MPa). * Some extra-tests were done at these stress levels, stopping the tests after different times before rupture. The aim was to analyze the microstructure and the crack propagation with SEM / EBSD. As indicated before, inside the electrolytic cell it is not possible to use an extensometer, and hence just the crosshead displacement is measured. For this reason, again, the co-relations were made between the crosshead displacement and extensometer strain on reference samples of each material. In the following graph there’s an example for DP600 steel (the rest materials can be found on the appendix): Crosshead-Extensometer relation: Part I. Extensometer displacement, mm. Displacement relation. 4 3.5 3. 0.16 y = 0.1089x + 0.0008 R2 = 0.9057. 0.14 0.12 0.1 0.08 0.06 0.04 0.02 0 0. 0.1. 0.2. 0.3. 0.4. 0.5. 0.6. CH displacem ent, m m. 2.5 2. Part II. 1.5 1 0.5 0 0. 0.5. 1. 1.5. 2. 2.5. 3. 3.5. 4. 4.5. 5. 5.5. 6. 6.5. Extensometer displacement, mm. Extensom eter displacem ent, m m. 4.5. 0.2 0.18. 4 3.5 y = 0.0231x2 + 0.4089x - 0.1691 R2 = 0.9986. 3 2.5 2 1.5 1 0.5 0 0.5. CH displacement, mm. 1. 1.5. 2. 2.5. 3. 3.5. 4. 4.5. CH displacem ent, m m. Fig 37: Example of Crosshead-Extensometer relation.. The following graph shows, as a general example, a typical creep curve graph that on the following constant load results will be obtained: 52. 5. 5.5. 6. 6.5.
(58) Development of an optimized methodology for tensile testing of Carbon steels in Hydrogen environment. Fig 38: Stages in a typical creep curve. Creep in metals is defined as time dependent plastic deformation at constant stress (or load). The form of a typical creep curve of strain versus time is shown in Fig 38. The slope of this curve is the creep rate dt/dε. The curve may show the instantaneous elastic and plastic strain that occurs as the load is applied, followed by the plastic strain which occurs over time. Three stages to the creep curve may be identified: Primary creep: in which the creep resistance increases with strain leading to a decreasing creep strain rate. Secondary (Steady State) creep: in which there is a balance between work hardening and recovery processes, leading to a minimum constant creep rate. Tertiary creep: in which there is an accelerating creep rate due to the accumulating damage, which leads to creep rupture.. 53.
(59) Development of an optimized methodology for tensile testing of Carbon steels in Hydrogen environment. 6.1 FB450 Graphs 17 to 20 summarize the results of the constant load tests for F450: Stress Vs Strain: FB4500 Constant Load Testing 2. 15' Precharging in "1g Thiourea + 28ml H 2SO4" at 10 mA/cm 575 550 525 500 475 450. CL 450 MPa in AIR (test stopped after 60 min). 350 325 300 275 250 225 200 175 150 125 100. FB450 Ref. 75 50 25 0 0. 0,5. 1. 1,5. 2. 2,5. 3. 3,5. 4. 4,5. 5. 5,5. 6. 6,5. 7. 7,5. 8. 8,5. Extensometer (recalculated) Strain, %. Graph 17: Stress Vs Strain for FB450 steel.. Stress Vs Time: FB450 Constant Load Testing 15' Precharging in "1g Thiourea + 28ml H2SO4/l H2O" at 10 mA/cm2 550 525. CL 450 Mpa in Air. Stoped after 60 min testing. 500 475 450 425 400 375 Tensile Stress, MPa. Tensile Stress, MPa. 425 400 375. 350 325 300. Broken in 2300 min. 275 250. Did not break. 225 200 175 150 125 100 75 50 25 0 0. 5. 10. 15. 20. 25. 30. 35. 40. 45. 50. 55. 60. 65. 70. Time, min. Graph 18: Stress Vs time for FB450 steel. .. 54. 75. 80. 85. 90. 95. 100.
(60) Development of an optimized methodology for tensile testing of Carbon steels in Hydrogen environment. Creep: FB450 Constant Load Testing 15' Precharging in" 1g Thiourea + 28 ml H2SO4" at 10 mA/cm2 3.5. FB450_350 MPa FB450_400 MPa FB450_500 MPa FB450_450 MPa FB450_425 MPa FB450_475 MPa FB450_ 450 MPa AIR FB450_437 MPa FB450_463 MPa FB450_485 MPa FB450_420 MPa. y = 2.4543x + 1.0058 -> α = 67.8 °. 3. y = 0.0343x + 1.5175 -> α = 2 °. 2.5. Strain (%). y = 0.0067x + 0.5368 -> α = 3.8*10-1 ° 2. y = 0.0034x + 1.59 -> α = 1.9*10-1 °. 1.5. y = 0.0016x + 0.3916 -> α = 9.2*10-2 °. y = 0.0002x + 0.1885 -> α = 11*10-3 °. y = 0.2809x + 0.4512 > α = 15.7 °. 1. y = 0.0089x + 0.3237 -> α = 5*10-1 ° y = 0.0001x + 0.1732 -> α = 5.7*10-3 °. y = 0.0008x + 0.2608 -> α = 4.5*10-2 °. 0.5 y = 0.0004x + 0.2324 -> α = 2.3*10-3 °. 0 0. 5. 10. 15. 20. 25. 30. 35. 40. 45. 50. 55. 60. 65. Time, min. Graph 19: Strain vs time for FB450 steel.. Creep Vs Stress: FB450 Constant Load Testing 2. 15' Precharging in" 1g Thiourea + 28 ml H2SO4" at 10 mA/cm. 0,04 0,035. FB450 FB450 AIR. Slope, (%ε / min). 0,03 0,025 0,02 0,015 0,01. Yield Strength. 0,005 0 300. 320. 340. 360. 380. 400. 420. 440. 460. Tensile Stress, MPa Graph 20: Slope Vs Stress for FB450 steel. .. 55. 480. 500. 520. 70.
Figure
+7
Related documents