A L
E T T E R S
J
O U R N A L
E
X P LO R I N G
T H E
F
R O N T I E R S O F
P
H Y S I C S
OFFPRINT
Crossover from endogenous to exogenous
activity in opensource software development
S. Valverde
EPL,
77
(2007) 20002
Please visit the new website
www.epljournal.org
The 15 December issue not only closed the final volume of 2006 but also ended the first chapter in the life ofEurophysics Letters. This stepping stone leads towards a newEPLembarking on its second youth.
For twenty years,Europhysics Letters has been published under the partnership of three learned societies: the refereeing procedure was handled by the Editorial Office representing the European Physical Society while the production was handled jointly by the Societ`a Italiana di Fisica (SIF) and EDP Sciences for the Soci´et´e+ Fran¸caise de Physique.
Starting from 2007, the UK Institute of Physics (IOP), as one of the four major owners, will take an active role in the publication ofEPL. The partners will work closely to offer highly efficient services to readers, authors, co-editors and referees in addition to providing high dissemination of top quality papers.
Our vision forEPLis to develop into a leading journal for physics letters throughout the globe, to offer rapid publication of ground-breaking physics results from the international community, and to ensure the broadest coverage of physics research.
In order to realize this vision and continue providing the best possible service to customers, numerous changes are to be introduced from January 2007:
– Europhysics Letterswill be rebranded asEPLto reflect the international research published in the journal and its global readership
– a new cover design will be introduced featuring images taken from recent journal articles, which will change with each volume
– the size of the printed issues will increase to A4 and, to accommodate this change, articles will now appear in two-column rather than single-column format; the length of articles will be limited to six journal pages – new macros have been designed by SIFto help prepare manuscripts in the newEPLformat (these macros
are available athttps://www.epletters.net)
– an article numbering system will be introduced, which means that articles can be published on-line faster than ever before and will be fully citable as soon as they appear on-line
– the submissions and peer-review process for articles will continue to be administered by the Editorial Of-fice and the copy-editing, production of proofs and offprints, and formatting will still be undertaken by SIF. However, starting from Vol.77,EPLwill become available on a new website (http://www.epljournal.org) hosted by IOP Publishing. Printing and distribution of the printed copy will remain with EDP Sciences – work is progressing towards making the first ten years ofEurophysics Letters (1986-1995) available as a
comprehensive history of the journal
– all articles published since 1996 will be available on-line to subscribers
The latest published articles will continue to be freely available to everybody for 30 days from their on-line publication date.
We invite you to visit the new website regularly (http://www.epljournal.org) to stay up-to-date with the journal’s latest developments and to read the most recent articles. Please remember to use the on-line submission system for your subsequent best papers!
If you have comments or questions about changes taking place in 2007, please e-mail us at [email protected] or [email protected].
With our best wishes for 2007!
TheEPLManagement Committee: Denis J´erome (Editor-in-Chief) Graeme Watt (Executive Editor) Yoanne Sobieski (Staff Editor) Paola Marangon (Production Editor) Agn`es Henri (Production Editor)
January 2007
EPL,77(2007) 20002 www.epljournal.org
doi:10.1209/0295-5075/77/20002
Crossover from endogenous to exogenous activity in open-source
software development
S. Valverde
Complex Systems Lab (ICREA-UPF), Barcelona Biomedical ResearchPark (PRBB-GRIB) - Dr. Aiguader 88, 08003 Barcelona, Spain
received 21 September 2006; accepted in final form 14 November 2006 published online 9 January 2007
PACS 05.70.−Ln– Nonequilibrium and irreversible thermodynamics PACS 89.65.−s– Social and economic systems
PACS 05.10.−a– Computational methods in statistical physics and nonlinear dynamics
Abstract– We have investigated the origin of fluctuations in the aggregated behaviour of an open-source software community. In a recent series of papers (de MenezesM. A. andBarab´asiA.-L.,
Phys. Rev. Lett.,92(2004) 28701;93(2004) 68701;YookS. H. andde MenezesM. A.,Europhys. Lett.,72(2005) 541), de Menezes and co-workers have shown how to separate internal dynamics from external fluctuations by capturing the simultaneous activity of many system’s components. In spite of software development being a planned activity, the analysis of fluctuations reveals how external driving forces can be only observed at weekly and higher time scales. Hourly and higher change frequencies mostly relate to internal maintenance activities. There is a crossover from endogenous to exogenous activity depending on the average number of file changes. This new evidence suggests that software development is a non-homogeneous design activity where stronger efforts focus in a few project files. The crossover can be explained with a Langevin equation associated to the cascading process, where changes to any file trigger additional changes to its neighbours in the software network. In addition, analysis of fluctuations enables us to detect whether a software system can be decomposed into several subsystems with different development dynamics.
Copyright cEPLA, 2007
Multiple time series are available for complex systems whose dynamics is the outcome of a large number of agents interacting through a complex network. Recent measurements on the fluctuations at network nodes [1–4] indicate a power law scaling between the meanfi and the standard deviation σi=
(fi− fi) 2
of the time-dependent activityfi(t) of nodei= 1. . . N, that is,
σi∼ fi α
, (1)
where α is an exponent which can take the values between 1/2 and 1 [1]. It seems that real systems accept a classification in two different classes depending on the value of this exponent. Systems with internal (or endogenous) dynamics like the physical Internet and electronic circuits show the exponent α= 1/2. On the other hand, systems either involving human interactions (i.e., WWW, highway traffic) or strongly influenced by external forces (i.e., rivers) belong to the class defined by the universal exponent α= 1. Interestingly, some
systems display both types of behaviour when analysed at different scales of detail. For example, visits to web pages and routing of data packets in the Internet are dynamical processes with different origins [1]. The former process is driven by user’s demands while the latter accounts for a significant amount of internal activity even in the absence of human interaction (i.e., routing protocols).
Here, we introduce for the first time this theoretical framework to the analysis of human dynamics observed in open-source software development, which is an important activity with economical and social implications. Open-source software (OSS) [4] often requires the collective efforts of a large number of experienced programmers (also called developers or software engineers). How indi-vidual expertise and social organization combines to yield a complex and reliable software system is still largely unknown. Interestingly, many remarkable features of OSS cannot be detected in the activity of single program-mers [5]. This suggests that, in order to understand how OSS takes place, the activities of many developers must be studied simultaneously. A prerequisite to study processes 20002-p1
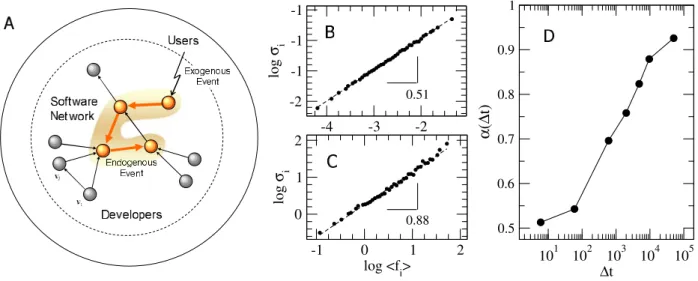
S. Valverde -4 -3 -2 -2 -1 -1 -1 log σ i -1 0 1 2 log <fi> 0 1 2 log σ i 101 102 103 104 105 ∆t 0.5 0.6 0.7 0.8 0.9 1 α ( ∆ t) 0.51 0.88
Fig. 1: (A) Schematic representation of an OSS community (see text). Scaling of fluctuationsσi∼ f∆t
i α with average change activity for the software project XFree86, measured at different time resolutions: (B) ∆t= 6 hours and (C) ∆t= 9600 hours. (D) shows the dependence of the exponentαwith the time window ∆t. Here, the exponentαgrows from 0.51 to 0.92.
of software change is to understand the social organization of OSS. These communities combine two groups of people in a hierarchical or onion-like structure: 1) an inner team of software developers that develop and maintain the source code files and 2) the potentially larger community of soft-ware users (see fig. 1A). This group of users triggers new development activities by issuing modification requests. In addition, every software change has a non-zero probability to inject new software defects, which in turn may trigger a cascade of repair changes [6].
We look at software development as a sequence of software change events. Previous studies on software maintenance dynamics proposed a classification of changes in categories associated to different project stages [7]. These studies reported the frequency of every type of change. However, the software database analyzed here (see below) does not indicate if a change addresses a user request or not. Instead, we suggest how the analysis of fluctuations can be used to obtain this information. We propose a new classification of software change as endo-genous or exoendo-genous depending on whether the change is independent of previous events or not. Because changes requested by users are independent of each other [7], we will refer to them as “exogenous”. On the other hand, cascades of correlated changes are “endogenous” (see fig. 1A). In a related paper, Sornette and co-authors make a distinction between endogenous and exogenous events in the context of book sales [8]. It was shown that exogenous and endogenous sales peaks have different relaxation dynamics.
Data. – Detailed activity registers of the OSS commu-nity reside in centralized source code repositories, like the Concurrent Version System (CVS) [9]. During the process of software change, developers access files to add, change
or remove one or more lines of source code. The CVS database tracks each file revision submitted by a devel-oper. The activity of many developers progresses in paral-lel with simultaneous changes to many files. However, the CVS system provides some mechanisms to ensure that any given file cannot be changed by more than one developer simultaneously. In addition, the CVS stores all source code files required to build the software system. We have shown this set of project files describes a complex network with an asymmetric scale-free architecture [10]. Following [10], we can reconstruct this software networkG= (V, E) from the collection of source code files, where each nodevi∈V represents a single source file and the link (vi, vj)∈E indi-cates a compile-time dependency between files vi and vj (see fig. 1A). It can be shown that the number of linksL(t) growths logarithmically with the number of nodesN(t) in the software network [10]. Our analysis combines struc-tural information provided by the software network with the time series of file changes stored in the CVS. We have validated our results with several software projects [11].
Analysis of fluctuations. – We have analysed the aggregated activity of software developers at different timescales. Given a fixed measurement time window ∆t, we measure development activity by looking at the dynam-ics of single file changes:
fi∆t(t) =
τ∈[t,t+∆t]
ci(τ) (2)
where ci(t) = 1, when file vi has been changed at time t andci(t) = 0, otherwise. Notice how eq. (2) corresponds to the coarse-graining of the time series of file change events. In the following, we will omit the subscript ∆t whenever the timescale is implicit. We also define global activity
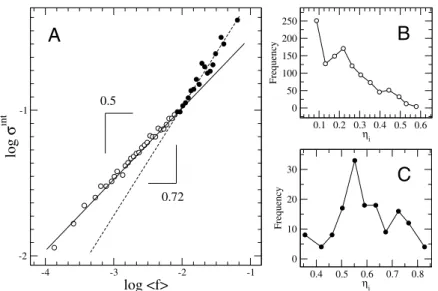
Crossover from endogenous to exogenous activity etc. -4 -3 -2 -1 log <f> -2 -1 log σ int 0.1 0.2 0.3 0.4 0.5 0.6 ηi 0 50 100 150 200 250 Frequency 0.4 0.5 0.6 0.7 0.8 ηi 0 10 20 30 Frequency 0.72 0.5
A
B
C
Fig. 2: (A) Crossover observed in the scaling of internal fluctuations with average flux, around 10−2, for the Apache project. In
(B) and (C) we show the binned distribution of ratios for the two project file subsetsf<10−2 (open circles) andf>10−2
(black circles), respectively. In all plots, ∆t= 10 hours.
F∆t(t) or the number of project changes at timet:
F∆t(t) = N i=1 f∆t i (t). (3)
In fig. 1D we display the scaling of fluctuations with the average activity (see eq. (1)) in a software project at different timescales. There is a dependence of the scaling exponent with the time window ∆t. The observed exponent is less than 1 for a wide range of timescales (see fig. 1B), thus suggesting and endogenous origin of development activity. On the other hand, the analysis of fluctuations in various OSS projects at monthly and large timescales yields an exponent closer to 1 (see fig. 1C). The external driving force becomes stronger when ∆t
increases. In the following, we further investigate the origin of fluctuations in software development dynamics with a more robust measure.
Crossover in internal dynamics. – We can
deter-mine if OSS dynamics has an endogenous or exoge-nous origin by separating internal and external contribu-tions [2]. We split the time series of individual file changes
fi(t) in two different components: i) internal fluctuations
fint(t) governed by local interaction rules and ii) external
fluctuations fext(t) caused by environmental variations,
that is
fi(t) =fint(t) +fext(t), (4)
where the external activityfext(t) represents the expected
fraction of changes shared by filevi:
fext i (t) =Ai N i=1 fi(t). (5)
Here Ai is file centrality [2], defined as the overall
fraction of changes received by the filevi:
Ai= T t=1fi(t) T t=1 N i=1fi(t) (6) and T is the timespan of software development. Notice that file centrality Ai is independent of the observation
window ∆t. By definition, external fluctuations always scale linearly with the average number of file changes,
σext∼ f. On the other hand, the exponent αgoverning
the scaling of internal fluctuations with average flux
σint∼ fα indicates if dynamics has an endogenous
(α= 0.5) or exogenous (α= 1) origin. Interestingly, we observe a crossover in the internal activity of open-source software development depending on the average number of file changes f (see fig. 2A). The crossover is less visible at large timescales ∆t.
The analysis of single node fluctuations provides addi-tional evidence for this crossover. The ratioηi=σexti /σiint
between external and internal fluctuations indicates wether node dynamics is external (ηi1) or internal
(ηi1). In order to characterize the system’s overall
behavior, we can compute the distribution of ratios
P(ηi) [2]. This measure was shown to be robust to
variations in the measurement time window ∆t. For example, fig. 2 displays the distribution of ratios P(ηi)
measured in two different subsets of files in the Apache project. On the one hand, we can see that P(ηi) is
peaked around 0.55 (see fig. 2C) for the subset of files with f>10−2. This suggests exogenous activity in a core set of project files (those depicted with black circles in figs. 2A and C). Moreover, P(ηi) is skewed towards
lower ratios (around 0.1) for project files withf<10−2 (white circles in figs. 2A and B). On the other hand, 20002-p3
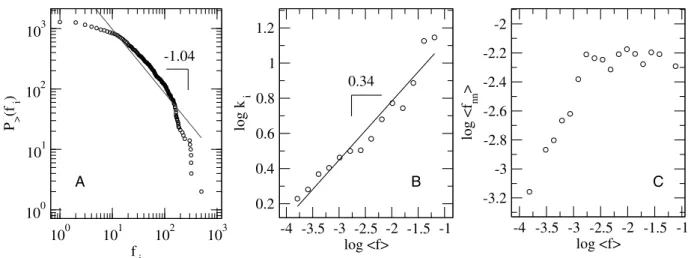
S. Valverde 100 101 102 103 f i 100 101 102 103 P > (f i ) -4 -3.5 -3 -2.5 -2 -1.5 -1 log <f> 0.2 0.4 0.6 0.8 1 1.2 log k i -4 -3.5 -3 -2.5 -2 -1.5 -1 log <f> -3.2 -3 -2.8 -2.6 -2.4 -2.2 -2 log <f nn > 0.34 -1.04 A B C
Fig. 3: Measuring internal propagation of changes in the Apache project. (A) The cumulative total activity distributionP>(fi) is broad scale. (B) Scaling of average activity/flux with node degree,ki∼ fβ, withβ≈0.34. (C) Average neighbors activity fnnscales with average node activity f< f0 and then saturates,fnn= const, once the crossover f0= 10−
2.5
is reached, f> f0. In order to reduce the noise, data have been logarithmically binned in (B) and (C) plots. The measurement window
is ∆t= 10 hours.
activities involving less changed files have an endogenous origin (see fig. 2B).
Propagation of changes. – Crossover in internal
fluctuations stems from the inhomogeneous nature of software development. A large development effort aims to a small number of core files, which change more frequently than other project files. In a related paper, network heterogeneity was shown to have an impact in the dynamics of diffusion processes [3]. When the diffusive process is multiplicative and the underlying topology is
intrinsically inhomogeneous, there is a crossover fromα=
0.5 toα= 1 in the scaling of fluctuations with the average
flux (eq. (1)). Such diffusive network processes can be modeled through the Langevin equation by a mean-field
approximation [3]. The change of mass at nodeiduring a
unit time interval is
fi(t+ 1) =fi(t) + ki j 1 kjηj(t)fj(t), (7)
where the second term represents the incoming mass from
the nearest neighbors and ηj(t) is a uniform random
variable (i.e., multiplicative noise term). Because we are
focusing in the internal diffusion process we do not take into account additional terms like outgoing mass and/or uncorrelated Gaussian noise. This type of diffusion processes display a characteristic scaling in the probability
distribution P(fi)∼f−1−µ
i [3]. The continuous
approxi-mation of the previous equation is
df dt ∼= ki j 1 kjηj(t)fj(t)∼=ki 1 knnηj(t)fj(t), (8)
where knn denotes the average degree of a node’s
nearest neighbors. Becauseηj(t) andfj(t) are independent
variables and assuming thatknnis a function ofk:
df
dt ∼=
k
knnηj fnn ≡J(k)fnn, (9)
where fnn indicates the average incoming mass in the
nearest neighbors of a node. For the Barab´asi-Albert
network [12], the numerical solution of the above equation
shows that fnn decreases as f increases and then
saturates to a constant value for f> f0 (see [3] for
details). The observed value of f0 indicates the crossover
between endogenous and exogenous dynamics.
Interestingly, model requirements (i.e., diffusion process
on a heterogeneous network) are met by software projects. Empirical studies of software maintenance reported that change propagation is a central feature of software main-tenance [13]. Propagation is necessary because there are dependencies between project files and developers must ensure that related files are changed in a consistent way.
Recall the software networkG captures these file
depen-dencies (see above). The software network displays a scale-free structure due to extensive reuse during software devel-opment [10].
Furthermore, our measurements on real OSS projects seem consistent with model predictions. We have observed that, for all software projects analyzed here, the
propa-bility distribution P>(fi) has a long tail. For example,
power law fitting for the Apache project predicts an
expo-nent −1−µ≈ −2.04 for the incoming flux distribution
(see fig. 3A, cumulative probability distribution is used to reduce the impact of noisy fluctuations). As hypo-thesized above, the plot in fig. 3B shows that key files having a large number of dependencies are changed more
frequently. We have checked thatknnis a function ofk
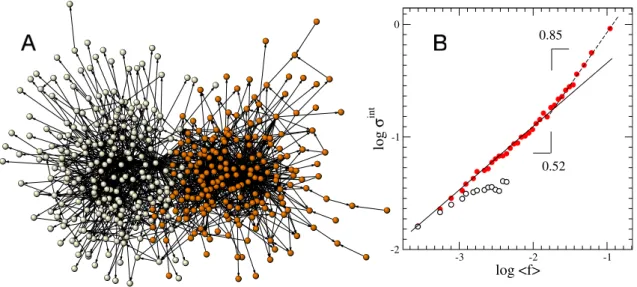
Crossover from endogenous to exogenous activity etc. -3 -2 -1 log <f> -2 -1 0 g ol σ t ni 0.85 0.52
Fig. 4: Scaling of internal fluctuations in different subsystems of the TortoiseCVS software project. (A) Modular organization of the corresponding software network, where node represents files and links depict dependencies. Nodes within the same subsystem
are displayed in the same colour. (B) Different scaling laws of internal subsystem fluctuations with average flux,σi∼ fiαint,
for the main application subsystem (black balls) and for the window subsystem (so-calledwxwin, white balls).
activity increases with average node activityfand it is approximately constant, fnn ≈const for f> f0 with
f0= 3.16×10⁻³. This value of f0 is consistent with the observation made in fig. 2A. In this case, eq. (9) predicts f ∼ kα withα= 1 to be compared with the measured
exponent 0.72 (see fig. 2A).
Different subsystems display different scaling
laws. –A practical application of fluctuation analysis is
the identification of files that change together [14]. This suggests a method for community detection based on indi-vidual node dynamics. In our context, we have observed that some subsystems are characterized by different scaling laws in their internal fluctuations with average activity. For example, fig. 4 summarizes the analysis of internal fluctuations in the software project TortoiseCVS. There are two clearly defined subsystems, the main appli-cation subsystem (dark balls) and the window library
wxwin (white balls), characterized by different change
dynamics (see fig. 4A). The crossover behaviour can be appreciated in the scaling of internal fluctuations for the main TortoiseCVS subsystem (the exponent for f> f0 is αint≈0.85, see fig. 4B). The main subsystem
concentrates the largest fraction of changes. On the other hand, the crossover is not observed in the scaling for
the wxwin subsystem (see fig. 4B), which is a utility
library imported from an external development team. The minimal amount of activity regarding the wxwin subsystem (sporadic changes in the library communicated by the external team and minor adjustments required by the main subsystem) suggests an explanation for the absence of a crossover.
In short, we have provided empirical and theoretical evidence for a well-defined crossover in the dynamics of
software change. This is the first reported example of such behaviour in a large-scale technological system. It shows that OSS systems exhibit some traits in common with other complex networks. The presence of crossover allows to distinguish between internal and external components of the dynamics and then provides a powerful approach to uncover the relative importance of exogenousvs. endo-geneous dynamics.
∗ ∗ ∗
The author dedicates this paper to his daugther Violeta. He thanks R.Sol´eand D.Challet. This work has been supported by the EU within the 6th Framework Program under contract 001907 (DELIS).
REFERENCES
[1] de Menezes M. A. and Barab´asi A.-L., Phys. Rev.
Lett.,92(2004) 28701.
[2] de Menezes M. A. and Barab´asi A.-L., Phys. Rev.
Lett.,93(2004) 68701.
[3] Yook S. H.andde Menezes M. A.,Europhys. Lett.,72
(2005) 541.
[4] Raymond E. S.,First Monday,3(1998) 3.
[5] Barab´asi A.-L.,Nature,435(2005) 207.
[6] Challet D. and Lombardoni A., Phys. Rev. E, 70
(2004) 046109.
[7] Burch E. and Hsiang-Jui Kungs, Proc. Int. Conf.
Softw. Maint. (ICSM-97)1997, pp. 40-47.
[8] Sornette D., Deschˆatres F., Gilbert T.andAgeon
Y.,Phys. Rev. Lett.,93(2004) 228701.
[9] Bar M. andFogel K.,Open Source Development with
CVS,third edition (Paraglyph Press) 2003.
S. Valverde
[10] Valverde S.andSol´e R. V.,Europhys. Lett.,72(2005) 858.
[11] XFree86 (http://www.xfree86.org), Apache (http:// www.apache.org), TortoiseCVS (http://www.
tortoisecvs.org).
[12] Barab´asi A.-L.andAlbert R.,Science,286(1999) 509. [13] Hassan A. E.and Holt R. C.,Proc. Int. Conf. Softw.
Maint. (ICSM-04)2004, pp. 284-293.
[14] Gall H., Hajek K.andJazayeri M.,Proc. Int. Conf. Softw. Maint. (ICSM-98)1998, pp. 190-198.