Hierarchical-temporal data visualization using a
Tree-ring Metaphor
Roberto Theron
Departamento de Inform´atica y Autom´atica Facultad de Ciencias - Universidad de Salamanca Plaza de la Merced s/n. 37008. Salamanca (Spain)
Abstract. This paper describes a novel and efficient visualization tech-nique intended for hierarchical-temporal data using a tree-ring like lay-out. Hierarchies with time appear in numerous fields such as genealogy, evolution taxonomies or time lines. In many cases, state-of-the-art sta-tic diagrams are produced in these fields. By using several information visualization strategies, such as focus + context, the tree-ring approach has the ability to visualize and navigate these, potentially complex, hier-archies trough time. This way a deeper insight into the problem at hand can be gained.
Key words:tree-ring layout, information visualization, focus + context
1
Introduction
In the last few years the visualization of hierarchical data has been subject of great interest in information visualization research. Hierarchies are often rep-resented as trees, i.e., a special kind of graph. Graphs are the fundamental structural representation of structured data [1], so the hierarchy visualization problem becomes a part of the graph visualization problem.
Hierarchies are used in many areas of application, including computer file systems, taxonomies, genealogy, phylogenesis, evolutionary trees, etc. The infor-mation visualization community has explored many different approaches focus-ing on navigation and interaction, that help to overcome some of the limitations present in graph drawing. For the later, the book of Battistaet al.[2] covers all the key aspects, while Hermanet al. provide an excellent survey of information visualization applied to graph visualization and interaction[1].
Although the visualization of hierarchies has been the recipient of an ex-tensive literature, very few works related to the visualization and exploration of hierarchical data sets that represent a temporal evolution have been done. Furthermore, in many situations visualizations should emphasize temporal rela-tionships and patterns. This paper presents Treevolution, a novel visualization tool that uses a tree-ring metaphor in combination with focus + context tech-niques, that can be useful for hierarchical-temporal data visualization.
The rest of this paper is organized as follows: next, a review of works related to hierarchical data and time visualization is presented. In Section 2 the tree-ring metaphor is explained. The third section is devoted to a case study: the visualization of the computer language history using Treevolution. To finalize, the main conclusions and future work are described.
1.1 Related work
Many display layout techniques has been developed for the visualization of hi-erarchical data set like Cone tree, Treemap[3], Hyperbolic tree[4], etc. Several works have dealt with focus + context techniques for visualizing and manip-ulating large hierarchies. We Yee et al. use the well known radial tree layout method[5][2], in which the focused node is placed in center of display, and all other nodes are rendered on appropriate circular level around that selected fo-cused node. Also this approach makes use of different animation techniques for supporting interactive exploration of the graph. In [6] a software framework for creating dynamic visualizations of both structured and unstructured data was developed.
An important aspect is how the process of determining the position and size of each visual object that is displayed in a presentation can automated. Effective layout is one of the most important aspects of creating an information presenta-tion, because that presentation it is intended to be viewed and manipulated by people. A survey of automated layout techniques for information presentations can be found in [7].
In [8] focus + context techniques were used to compare the structure of large phylogenetic trees. Munzner et al. present a new rectilinear focus + context technique for navigation that is well suited to the dynamic linking of side-by-side views while guaranteeing landmark visibility and constant frame rates.
Recently, Morriset al.[9] have dealt with the visualization of temporal hier-archies. In their work, documents from a research front are plotted by time along a horizontal track in the time line, with related research fronts being plotted in nearby tracks according to the hierarchical structure produced during clustering. In [10] tree-ring metaphors are introduced to enhance information content of focus areas in large time-line visualizations of objects that split or merge. The tree-ring representation shows the relative timing of splits and merges of each object. In the tree ring metaphor for splits and merges, radial distance indicates time with the birth at the center. At a given radial distance, pieces of arc represent descendent nodes in existence at that time. A node that neither splits nor merges is represented by a circle whose radius indicates the lifetime of the node.
Finally, it can be added that Treevolution was developed taking into account the Computational Information Design (CID) process proposed by Benjamin Fry [11]. CID brings together design, information, and computation with a focus on how they support one another as parts of a combined methodology for the exploration, analysis, and representation of complex data, and processing, his
Java-based software development environment aimed to simplify the construc-tion of graphically-oriented software.
2
The tree-ring metaphor
As stated above, Treevolution uses a tree-ring metaphor for the temporal hier-archy layout. The following definitions will be useful for the rest of the paper1:
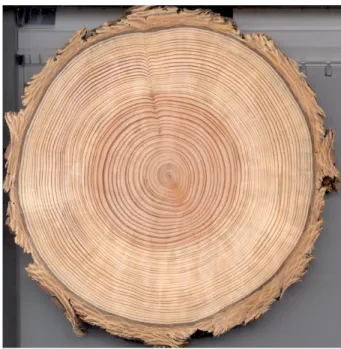
Fig. 1.Cross section of aPseudotsuga menziesiishowing almost perfect tree-rings
– Dendrochronologycan be defined asThe science that uses tree rings dated to their exact year of formation to analyze temporal and spatial patterns of processes in the physical and cultural sciences.
– tree ring: A layer of wood cells produced by a tree or shrub in one year, usually consisting of thin-walled cells formed early in the growing season (called earlywood) and thicker-walled cells produced later in the growing season (called latewood). The beginning of earlywood formation and the end of the latewood formation form one annual ring, which usually extends around the entire circumference of the tree.
1 The source of these elementary definitions, as well as figure 1, is the comprehensive
collection of information related to tree-rings available in Henri D. Grissino-Mayer’s Ultimate Tree-Ring Web Pages, http://web.utk.edu/ grissino/
– tree-ring chronology: A series of measured tree-ring properties, such as tree-ring width or maximum latewood density, that has been converted to dimensionless indices through the process of standardization. A tree-ring chronology therefore represents departures of growth for any one year com-pared to average growth. For example, an index of 0.75 (or 75) for a given year indicates growth below normal (indicated by 1.00, or 100).
Fig. 2.The tree-ring metaphor
This way, the idea behind the tree ring metaphor is to provide a way to visualize both timing and structure in a single diagram. In figure 1, a cross section of a tree can be seen. In it each tree-ring shows the annual growth; the with of the ring depends on how productive this year has been for the tree. In order to convey the hierarchical information, while keeping the time information, a modification of the radial layout [5] can be used: instead of placing nodes on concentric circles according to their depth in the tree, they are placed according to its temporal information.
Figure 2 shows a simple hierarchy with temporal information. In the tree-ring layout, node E is placed in the fourth circle because its time ist= 4; in this case the fact that it is a direct descendant of the root node (A) is not important for node placement. The hierarchy information is kept in the directed arc (from A to E), though.
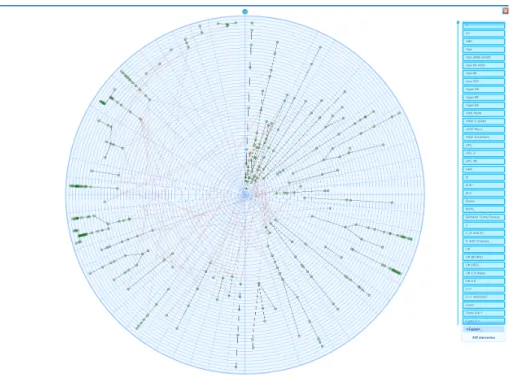
Also, notice that the hierarchy has been drawn occupying a circular sector. The free space could be used, in the case of having a more complex hierarchy, by
placing each subtree or family in an individual sector. This concept can be seen in figure 3. The picture shows how Treevolution, by using the tree-ring layout, visualize several subtrees of a complex temporal hierarchy.
Fig. 3.Default layout of a temporal hierarchy in Treevolution
In the following sections we will see how this simple idea can be further exploited by using different information visualization techniques.
3
Case study: browsing the computer languages history
with Treevolution
In order to describe the benefits of the Treevolution technique, the Computer languages history diagram2 will be studied.
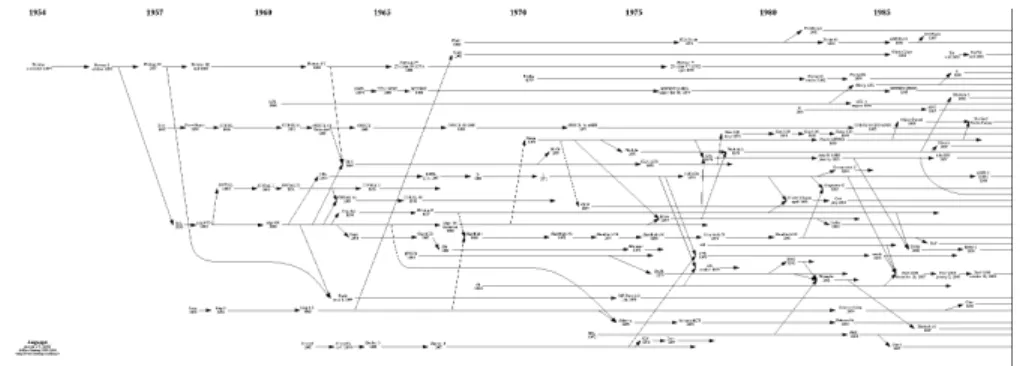
Figure 4 shows the evolution of computer languages from 1957, with the advent of FORTRAN, to the current releases of popular languages such as Java or C#. Actually, the picture only shows a small part of the history, from 1957 to 1989, because the diagram is intended to be either horizontally scrolled with an Internet browser or to exhibited on a wall. For our purposes, the part of the
2
Fig. 4.Partial diagram (1957-1989) of computing languages history
history is enough to understand that each family/tree run from left to right, as times does. With this diagram it is very difficult to form a mental map of the evolution, since all connections bettwen fathers and sons are mixed.
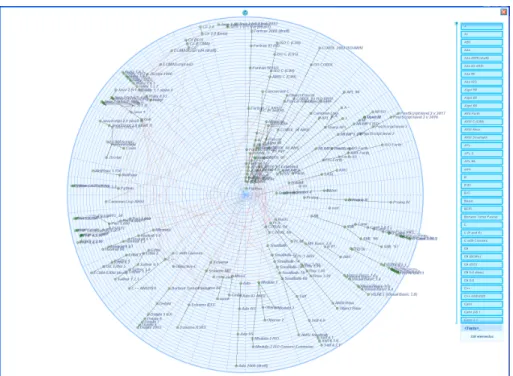
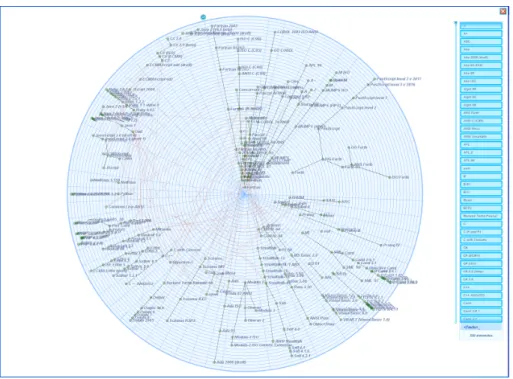
With Treevoltion the whole history (1957-2006) can be seen in a single and compact diagram. Actually, figure 3 showed the computer languages history in Treevolution. The same hierarchy, but this time all nodes are laveled, is shown in figure 5. Notice that light red edges depict the ancestors of nodes pertaining to other families.
Furthermore, the Levenez diagram suffers from the well-known problem of focus: as we scroll when we are following a particular time line, all contextual information is lost.
The trade-off between global views and visibility of details is a long-standing problem in visualizations of large data sets [1]. Traditional distortion techniques can be used to focus on detail in particular areas while keeping the context. In addition to the visualization technique, for an effective data exploration, it is nec-essary to use some interaction and distortion techniques. Interaction techniques allow the data analyst to directly interact with the visualizations and dynami-cally change the visualizations according to the exploration objectives[12]. This approach has been followed in two ways in Treevolution:
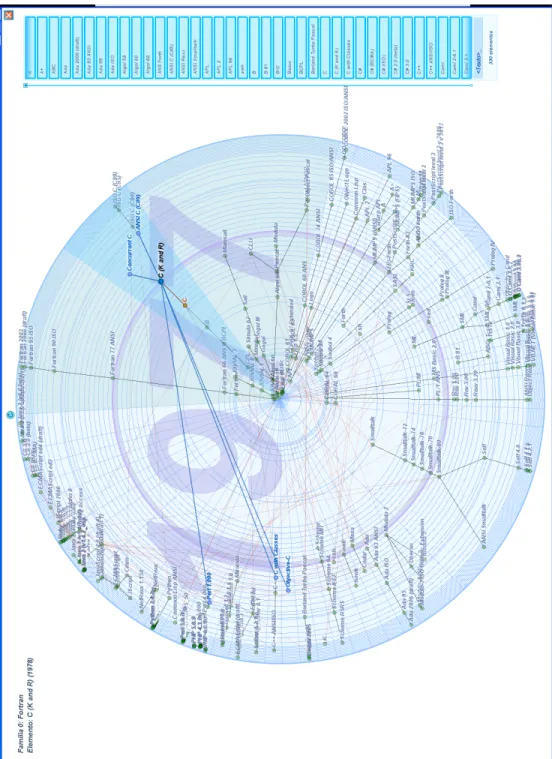
– Sector distortion. The angle of any sector can be interactively opened in order to have more space for the layout of a particular subtree (or computing language family in this example). As one sector is opened, the remaining sectors are proportionally closed. This can be seen in figure 6, where the PostScript sector (upper left quadrant) has been opened by the user in order to clearly see it hierarchy.
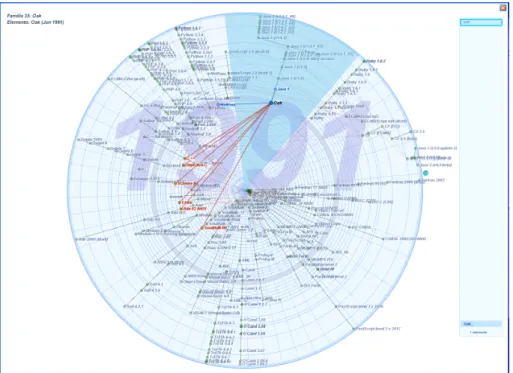
– Ring distortion. The width of any ring can be interactively increased in order to view more clearly that period of time. At this point, the tree-ring metaphor offers its best, since all rings cover the same amount of time, but the number of nodes within that period is variable (different growth index, in tree-ring chronology terms). This situation can be seen in figure 7, where
Fig. 5.Computer languages history, from 1957 to 2006, in Treevolution
years 2002 and 2003 were very productive, with several versions. This way, although all rings represent a year time, the width of the rings has been increased in order to clearly view the rapid evolution of Java during that years. Notice that inner years have their width decreased in order to make room for the productive years.
Finally, some more interactions ([12]) have been added in the Treevolution implementation. On the right hand size, an alphabetical browser of node labels permits to find a particular node whitin a complex hierarchy. Also, it is possible to filter the label browser with a word provided from the keyboard. This is what it was done in figure 7: Oak was typed so the node was selected. As a result, the node is highlited, its direct descendent is highlighetd in blue, and its ancestors are highlighted in red. The oak sector (family) and the ring (year) are shadowed and the particular time is shown in the background (1991).
Figure 8 shows a similar situation but for 1977’s Kernighan and Ritchie. Notice that a subfamily, C (K and R) is highlighted with a darker shadow than the whole family (Fortran). Also notice that the Smalltalk family has a wider sector. This way Treevolution can maintain several foci while maintaining the context.
Another important feauture of Treevolution is that the whole diagram can be rotated, in order to provide a way of avoiding the label cluttering that the
Fig. 6.The use is focused on the Postcript family (upper left quadrant)
automatic layout can produce. This a very important issue, since the design of an aesthetic label layout is an efficient way to increase the functionality (speeding up search tasks) of technical and scientific illustration [13]. The user only needs to drag the small round button that is located outside the circle. Notice the different locations of this button in figures 5 (default location), 6,7 and 8.
4
Conclusions
A novel method for the visualization and navigation of hierarchical-temporal data was presented. The tree-ring metaphor provides an elegant solution to this particular problem, while the focus + context interaction techniques have . The rotation of the tree-ring is a simple but very efficient way of label uncluttering. As case study, Treevolution was successfully applied to the popular history of computing languages, showing its potential for exploring the hierarchies and helping the user to gain a deeper understanding of the evolution and relationships among the different elements in the hierarchy. Future extensions will be providing multiple linked views of selected subtrees and test the technique with larger datasets.
Fig. 7.Full details of the evolution of the Java hierarchy
References
1. Herman, Melan¸con, G., Marshall, M.S.: Graph visualization and navigation in in-formation visualization: A survey. IEEE Transactions on Visualization and Com-puter Graphics6(2000) 24–43
2. Battista, G.D., Eades, P., Tamassia, R., Tollis, I.G.: Graph Drawing: Algorithms for the Visualization of Graphs. Prentince Hall, Upper Saddle River, N. J. (1999) 3. Shneiderman, B.: The eyes have it: A task by data type taxonomy for information visualizations. In: IEEE Visual Languages. Number UMCP-CSD CS-TR-3665, College Park, Maryland 20742, U.S.A. (1996) 336–343
4. Munzner, T., Burchard, P.: Visualizing the structure of the world wide web in 3d hyperbolic space. In: VRML ’95: Proceedings of the first symposium on Virtual reality modeling language, New York, NY, USA, ACM Press (1995) 33–38 5. Eades, P.: Drawing free trees. Bulletin of the Institute for Combinatorics and its
Applications5(1992) 10–36
6. Heer, J., Card, S.K., Landay, J.A.: prefuse: a toolkit for interactive information visualization. In: Proceedings of SIGCHI Human Factors in Computing Systems, New York, NY, USA, ACM Press (2005) 421–430
7. Lok, S., Feiner, S.: A survey of automated layout techniques for information pre-sentations. In: Proceedings of SmartGraphics 2001. (2001)
8. Munzner, T., Guimbretière, F., Tasiran, S., Zhang, L., Zhou, Y.: Treejux-taposer: scalable tree comparison using focus+context with guaranteed visibility. ACM Trans. Graph.22(2003) 453–462
9. Morris, S.A., Yen, G., Wu, Z., Asnake, B.: Time line visualization of research fronts. Journal of the American Society for Information Science and Technology 54(2003) 413–422
10. Robbins, K.A., Jeffery, C.L., Robbins, S.: Visualization of splitting and merging processes. Journal of Visual Languages and Computing11(2000) 593–614 11. Fry, B.: Computational Information Design. PhD thesis, MIT (2004)
12. Keim, D.A.: Information visualization and visual data mining. IEEE Transactions on Visualization and Computer Graphics8(2002) 1–8
13. Hartmann, K., G¨otzelmann, T., Ali, K., Strothotte, T.: Metrics for functional and aesthetic label layouts. Lecture Notes in Computer Sceinces, Smart Graphics: 5th International Symposium3638(2005) 115–127