Nijmegen
The following full text is a publisher's version.
For additional information about this publication click this link.
http://hdl.handle.net/2066/157568
Please be advised that this information was generated on 2017-12-05 and may be subject to
change.
ORIGINAL RESEARCH ARTICLE published: 30 January 2015 doi: 10.3389/fncom.2014.00173
Gaussian mixture models and semantic gating improve
reconstructions from human brain activity
Sanne Schoenmakers1
*, Umut Güçlü1
, Marcel van Gerven1
and Tom Heskes2 1
Donders Institute for Brain, Cognition and Behaviour, Radboud University Nijmegen, Nijmegen, Netherlands 2Institute for Computing and Information Sciences, Radboud University Nijmegen, Nijmegen, Netherlands
Edited by:
Guenther Palm, University of Ulm, Germany
Reviewed by:
Barbara Hammer, Bielefeld University, Germany Petia D. Koprinkova-Hristova, Institute of Information and Communication Technologies, Bulgarian Academy of Sciences, Bulgaria
Friedhelm Schwenker, Ulm University, Germany
*Correspondence:
Sanne Schoenmakers, Donders Institute for Brain, Cognition and Behaviour, Radboud University Nijmegen, Montessorilaan 3, PO Box 9104, 6500 HE, Nijmegen, Netherlands
e-mail: s.schoenmakers@ donders.ru.nl;
www.ccnlab.net
Better acquisition protocols and analysis techniques are making it possible to use fMRI to obtain highly detailed visualizations of brain processes. In particular we focus on the reconstruction of natural images from BOLD responses in visual cortex. We expand our linear Gaussian framework for percept decoding with Gaussian mixture models to better represent the prior distribution of natural images. Reconstruction of such images then boils down to probabilistic inference in a hybrid Bayesian network. In our set-up, different mixture components correspond to different character categories. Our framework can automatically infer higher-order semantic categories from lower-level brain areas. Furthermore, the framework can gate semantic information from higher-order brain areas to enforce the correct category during reconstruction. When categorical information is not available, we show that automatically learned clusters in the data give a similar improvement in reconstruction. The hybrid Bayesian network leads to highly accurate reconstructions in both supervised and unsupervised settings.
Keywords: fMRI, reconstruction, Bayesian network, data fusion, semantic categories, unsupervised learning, probabilistic inference
1. INTRODUCTION
Machine learning techniques have made it possible to accu-rately encode and decode mental states from neuroimaging data. Neural encoding and decoding are topics of key importance in contemporary cognitive neuroscience. Especially visual percep-tion has received a large amount of attenpercep-tion since the visual system is relatively well understood and covers a large portion of the brain. While the first decoding studies focused exclu-sively on the prediction of discrete states such as object cat-egory (Haxby et al., 2001) or stimulus orientation (Kamitani and Tong, 2005), more recent work has focused on the predic-tion of increasingly complex stimulus features, culminating in the reconstruction of the contents of perceived images (Thirion et al., 2006; Kay et al., 2008; Miyawaki et al., 2008; Naselaris et al., 2009; van Gerven et al., 2010; Güçlü and van Gerven, 2014). Striking reconstructions have been made of handwrit-ten characters (Schoenmakers et al., 2013), faces (Cowen et al., 2014), natural images (Naselaris et al., 2009) and even the gist of video clips (Nishimoto et al., 2011). Reconstructing stim-uli from the neuronal response can be done by selecting the most probable image from a prior set of images (Naselaris et al., 2009). While this leads to good results, we showed that Bayesian inversion of the neuronal response yields more accurate reconstructions for our dataset (Schoenmakers et al., 2013).
Encoding and decoding are intimately related via Bayes’ rule where the probabilityP(x|y) of a stimulusxgiven a responsey, is proportional to the product of a likelihood termP(y|x) and a prior P(x) (Friston et al., 2008; Naselaris et al., 2010). The likelihood embodies a forward model of how the stimulus fea-tures are encoded in the neural response. The prior specifies how likely a stimulus is before observing any data. Reconstruction is then accomplished by inverse inference in a generative model, where both prior knowledge of images and the BOLD response transformed to image space contribute to the reconstructions. Thirion et al. (2006)advocated this approach to reconstruction before and it has proven to be successful. Here we expand this framework to a hybrid Bayesian network that more accurately describes the stimulus features by also incorporating higher-level semantic information. Through data fusion, the higher-higher-level semantic information can be joined with the low-level informa-tion to obtain more accurate reconstrucinforma-tions. This is similar in spirit as the work ofNaselaris et al. (2010). However, in contrast to that study, our approach provides an analytical solution for reconstruction.
We present a framework for image reconstruction using Gaussian mixture models. Whereas before we made use of a unimodal prior containing all stimulus categoriesSchoenmakers et al., 2013, here we use Gaussian mixture models where the image prior is taken to be multimodal, by splitting the prior
into separate groups of images. Each group results in a mix-ture component that embodies a set of images from the same category. The weights for the mixture components are esti-mated from the fMRI data. The BOLD-response is translated to image space and the resemblance to each mixture compo-nent is calculated resulting in probabilities of belonging to each category. These probabilities then enforce or suppress the mix-ture components in the reconstruction. The components can be generated in a supervised way by splitting the prior in sepa-rate semantic categories based on image labels (Schoenmakers et al., 2014) or the components can be estimated automatically from the prior by learning cluster assignments based on the stimulus features when categorical information for the prior is unavailable.
Previous studies have shown that it is possible to get an accu-rate read-out of the category of a perceived image from fMRI data (Haxby et al., 2001; Cox and Savoy, 2003; Kriegeskorte et al., 2008; Simanova et al., 2014).Naselaris et al. (2009)showed that image reconstruction improved when semantic information was incorporated in the forward model. In our framework semantic information from higher order brain areas can be incorporated by deriving semantic categories from high-level brain areas using multinomial logistic regression. This categorical information can then be gated to the prior to enforce the correct categorical infor-mation during reconstruction. In some cases it can be difficult to derive the category of handwritten characters from their low-level features, but people are very well adapted to identifying the cor-rect category of ambiguous characters. Hence, by gating higher level brain information ambiguous stimuli might be resolved more accurately.
We applied the Gaussian mixture model to reconstruct mul-tiple handwritten characters that have been presented to sub-jects during fMRI acquisition using a rapid event-related design. We compare the reconstruction results for supervised multi-modal decoding, in which stimulus categories are known, and unsupervised multimodal decoding, in which stimulus cate-gories are unknown, with unimodal decoding which was the method proposed in our previous work (Schoenmakers et al., 2013). Furthermore, we extend the supervised approach to allow for semantic gating, incorporating information from high-level visual areas to drive the prediction of stimulus category. We show a major improvement with more accurate reconstructions than could be obtained using unimodal decoding. The key feature of our approach is the simplicity of our analytical hybrid Bayesian network while not having to make concessions on reconstruction quality.
2. MATERIAL AND METHODS
2.1. ENCODING
As inSchoenmakers et al. (2013), we use a linear Gaussian encod-ing model with imagex=(x1, . . . ,xp)∈Rpand the associated measured brain responsey=(y1, . . . ,yq)∈Rq:
y=Bx+ (1)
with zero-mean normally distributed noise. Regression coef-ficients B are estimated using regularized linear regression as
inGüçlü and van Gerven (2014)since it is computationally fast. The likelihood function is then given by
P(y|x)=N(y;Bx,). (2) where B=(β1, . . . ,βq)∈Rp×q and =diag (σ12, . . . , σq2)∈ Rq×q. We assume that this mapping is independent of the con-text (e.g., the category). LetX=(x1, . . . ,xN)∈RN×p denote the design matrix wherexjdenotes the stimulus presented at the
j-th trial. Letyi=(y1i, . . . ,yNi ) denote the associated responses for thei-th voxel. For each voxeli, we minimize thel2-penalized least squares loss function to estimateβi:
ˆ βi=arg min βi 1 N||yi−Xβi|| 2 2+λi||βi||22 (3)
whereλi≥0 controls the amount of regularization. Coefficients
ˆ
βican be obtained as follows:
ˆ
βi=(XX+λiIp)−1Xyi. (4) For efficiency we can use a singular value decomposition to reduce the complexity of the estimation of βi from O
p3to OpN2(Hastie et al., 2009; Murphy, 2012).
We use stratifiedK-fold cross-validation withK=5 to esti-mateλiandσi2. We first define a grid of valuesi=(λ1i, . . . , λLi) based on the effective degrees of freedom (Güçlü and van Gerven, 2014). Next, we obtainλˆias:
ˆ
λi=arg min
λ∈
varˆ1i(λ), . . . ,ˆKi (λ) (5)
where ˆki(λ)=yki −Xkβˆi are the residuals that are estimated using regularization parameterλin thek-th cross-validation fold with superscriptkrestricted to the trials belonging to that fold. Finally, we obtainσˆi2as:
ˆ σ2 i =var ˆ 1 i ˆ λi , . . . ,ˆK i ˆ λi . (6)
For the purpose of decoding, only the most informative voxels withσˆi2≤0.99 are included in the model.
2.2. DECODING
In our probabilistic framework, decoding comes down to com-puting the probability of a reconstruction x given an fMRI response vectory and cluster assignmentc. Following standard probabilistic inference, see e.g.,Bishop (2006), we obtain
P(x|y)= c
P(x|y,c)P(c|y), (7) where bothP(x|y,c) andP(c|y) follow from the application of Bayes’ rule: P(x|y,c)= P(y|x)P(x|c) P(y|c) and P(c|y)= P(c)P(y|c) cP(c)P(y|c) , (8)
Schoenmakers et al. Reconstructions from human brain activity
with
P(y|c)=
dxP(y|x)P(x|c). (9) Since both the likelihoodP(y|x) and the priorP(x|c) have the form of a Gaussian inx, so does their product. The derivation of (8) and (9) can be found in the supplementary. Here we merely state the result.
The posteriorP(x|y,c) of a reconstructionxgiven the brain responseyunder the assumption that the corresponding cluster equalscis a Gaussian distribution with meannc(y) and variance Qc, which can be computed through
nc(y)=Qcf¯(y)+Ucmc, (10) where Uc≡(I+RcD)−1 , D≡B−1B , Qc ≡UcRc, and ¯ f(y)≡B−1y, (11) and withIthe identity matrix. The posterior probabilityP(c|y) of clustercgiven the brain responseycan be shown to obey
logP(c|y)=logπc+ 1 2log detUc+ 1 2f¯(y) Qcf¯(y) −1 2m cDUcmc+ ¯f(y) Ucmc+constants,(12) where the constants can be ignored since they are independent of cand drop out when normalizingP(c|y) to sum to one. For the final reconstruction we propose to consider
x∗(y)= c
wc(y)nc(y) with weights wc(y)∝P(c|y)1/T.(13)
For temperatureT=1, we havewc(y)=P(c|y) and the recon-struction is a standard weighted average of the reconrecon-structions for each of the clusters. In the limitT↓0, we zoom in on the recon-structionnc∗(y) corresponding to the most probable clusterc∗= argmaxcP(c|y). In previous work we found that the best recon-structions are obtained asT↓0 (Schoenmakers et al., 2014), so here only results are reported for the most probable clusterc∗.
2.3. SPECIFICATION OF THE IMAGE PRIOR
In previous work (Schoenmakers et al., 2013) we used a uni-modal prior which contained the images of all categories in one prior distribution over images. In the proposed mixture model we consider the priorP(x) to consist of multiple Gaussian mixture components. That is,
P(x)= c
P(c)P(x|c) (14)
with P(c) the prior probability of cluster c and P(x|c)= N(x;mc,Rc) the Gaussian distribution of cluster c with mean mc and covariance Rc. All images in the prior are normalized
whereafter per cluster the mean mc= N1cx∈Xcx and covari-anceRc= Nc1−1x∈Xcxxare calculated, withXcthe set of all images that belong to categorycandNc= |Xc|.
For the prior we use a separate set of images taken from the same database as the stimuli used for the fMRI experiment (van der Maaten, 2009). The prior set includes 700 unique instances per character, giving a total of 4200 handwritten characters. The Gaussian mixture components are realized in two ways. When the image categories are known, the components can be split in a supervised fashion leading to supervised multimodal decoding. In case the image categories are not known, a set of images can be split in clusters in an unsupervised way based on how similar fea-tures are between images, resulting in unsupervised multimodal decoding. For supervised multimodal decoding the prior is sub-divided in six semantic categories (B, R, A, I, N, and S) as they are categorized in the database of handwritten characters. For unsupervised multimodal decoding the prior is divided into a variable number of clusters as obtained by K-means clustering. The K-means algorithm groups together characters that have sim-ilar low-level features (Spath, 1985; Seber, 2009). To obtain the Gaussian for clusterc, we take the cluster meanmc provided by the K-means algorithm and calculate the covarianceRcas stated above.
2.4. SEMANTIC GATING
By defaultP(c) can be specified as a uniform probability over categories, so as 1/C. Alternatively, we can modelP(c|z) by incor-porating semantic information derived from higher-order brain areas. We propose to learn these probabilities with multinomial logistic regression leading to a mechanism reminiscent of the mixture-of-experts byJordan and Jacobs (1994). We will refer to this approach as semantic gating.
Assume we have a stimulus-response pair in the form of a set of clustersc∈(1, . . . ,C)and associated measured brain response z=(z1, . . . ,zq)∈Rq wherez refers to the brain responses of a higher-level brain area. According to the multinomial logistic regression model, the probability of the category given the brain responses is given by:
P(c|z)= exp αc+γcz K k=1exp αk+γkz . (15)
We take the approach in Friedman et al. (2010) to esti-mate the regression coefficients. We maximize thel1-penalized log-likelihood to estimate αk,γk
K
k=1 and use 10-fold cross-validation on the train set to estimate theλ that controls the amount of regularization: ˆ αk,γˆk K k=1= arg max {αc,γc} K c=1 ⎧ ⎨ ⎩ 1 N N j=1 logPcizi −λ K k=1 ||γk||1 . (16)
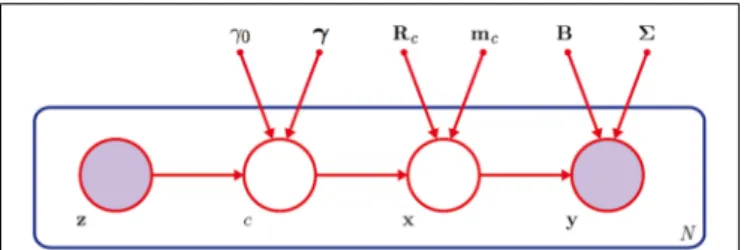
Our model is visualized inFigure 1, showing a graphical repre-sentation of the Gaussian mixture model with semantic gating
FIGURE 1 | The hybrid Bayesian network.The probability of belonging to clustercis estimated from the brain responsezfrom a high-level brain area with the help ofγ0andγ. An encoding model provides regression
coefficientsBand covarianceto reconstruct the image from the brain responseyof a lower-level brain area. The meanmcand covarianceRcof a
set of prior images enforce structure and the clustercenforces semantic information during the reconstruction of imagex. This process can be repeated for a set ofNimages.
and the variables that guide the reconstruction of a handwritten character from the brain response.
2.5. fMRI EXPERIMENT 2.5.1. Participants
In this study three healthy native Dutch speaking participants have been recruited to view stimuli of handwritten characters. All participants gave written consent according to the institutional guidelines set forth by the local ethics committee (CMO region Arnhem Nijmegen, the Netherlands) before the experiment. The participants were not paid for participation.
2.5.2. Stimuli
The stimuli represented grayscale handwritten characters cen-trally presented on a black background. The images spanned 9× 9 degrees of visual angle (56×56 pixels). All character images used in this study came from a database that was previously col-lected byvan der Maaten (2009). The character database consists of 40,000 handwritten characters collected from 250 writers. The images in the database are rescaled and centered such that they fill the canvas. For this study six characters were selected: B, R, A, I, N, and S. For each character, 60 unique instances were pre-sented during the experiment. A total of 360 characters were shown and this was repeated once in order to get a better estimate of the BOLD response (see FMRI data preprocessing section). The images were shown as flickering stimuli (200 ms ON, 200 ms OFF) for the duration of 1 sec, followed by 3 sec of black back-ground. A central white square served as a fixation point (0.2◦of visual angle). The fixation point was present at the center of the screen throughout the whole experiment.
2.5.3. Procedure
To keep participants vigilant they were asked to focus on the fix-ation point and to respond with a button press when the fixfix-ation point changed color from dark gray to light blue. The fixation point changed color once every six stimuli on average. Changes were presented at random but evenly spread over the length of the experiment and counterbalanced over characters. The characters were shown in pseudo-random order by shuffling six character sets consisting of one instance of each character in order to pre-vent long repetitions of the same character. The experiment lasted
for 50 min with a self-paced rest period in the middle. After the experiment, a structural scan was made. Subsequently, or in a next session, participants viewed a rotating checkerboard wedge in order to localize the visual areas in the brain with polar retinotopy. The rotating wedge was presented in four blocks of 5 min.
2.5.4. fMRI acquisition
Imaging was conducted at the Donders Institute for Brain, Cognition and Behavior (Nijmegen, the Netherlands). The func-tional images were collected with a Siemens Trio 3 T MRI system (Siemens, Erlangen, Germany) with an EPI sequence using a 32 channel head coil (TR=1.74 s, TE=30 ms, GRAPPA acceler-ation factor 3, 83◦ flip angle, 30 slices in ascending order, voxel size 2×2×2 mm). Head movement was restricted with foam cushions and a tight strip of tape over the forehead. After func-tional imaging, a structural scan was acquired using an MPRAGE sequence (TR=2.3 s, TE=3.03 ms, voxel size 1×1×1 mm, 192 sagittal slices, FoV=256 mm). In a separate session, the func-tional localizer data was acquired, again using an EPI sequence (TR=2 s, TE=30 ms, 83◦flip angle, 33 slices in ascending order, voxel size 2×2×2 mm, FoV=192 mm). During acquisition an eye tracker was employed to verify if participants were fixating their gaze.
2.5.5. fMRI preprocessing
With the use of SPM8 software (Wellcome Department of Imaging Neuroscience, University College London, UK), the functional volumes were reconstructed, realigned to the first scan of the session and slice time corrected. Participants moved less than 0.5 mm during the sessions. For each unique stimulus, which was presented twice to the subject, the response of each voxel to the stimulus was computed using a general linear model (GLM). The design matrix of the GLM was shaped by one regressor encoding the two stimulus repetitions, one regressor encoding all other stimuli, and nuisance regressors that encoded movement parameters and drift terms, similar to the approach presented in Mumford et al. (2011). The design matrix was convolved with the canonical hemodynamic response function (HRF). The voxel response for each stimulus was given by the beta estimate which was normalized for each voxel. Freesurfer software was used together with functional localizer data in order to isolate voxels belonging to visual area V1 and V2 using established methods for retinotopy (Sereno et al., 1995; DeYoe et al., 1996; Engel et al., 1997).
2.6. EMPIRICAL VALIDATION
In order to validate our approach we estimated an encoding model for the fMRI data from visual area V1 and tested dif-ferent versions of decoding under the Gaussian mixture model approach. In order to examine whether semantic information can improve decoding, we compared supervised multimodal decoding and unsupervised multimodal decoding with unimodal decoding. In the supervised multimodal setting we also tested whether including semantic information from a higher-level visual area (V2) with semantic gating of the six character cate-gories will help improve reconstructions.
To quantify the reconstruction performance we used two mea-sures. The structural similarity metric (SSIM) was used to see
Schoenmakers et al. Reconstructions from human brain activity
how well low-level image features are reconstructed. SSIM is designed to match the properties of the human visual system when determining to what extent two images are alike (Wang et al., 2004). SSIM is similar to correlation between images, rang-ing from 0 to 1, except that it controls for noise and distortion and only evaluates the structural congruency between the original images and their reconstructions. Secondly, we computed correct classifications to gain insight into how well high-level seman-tic information was decoded. In supervised decoding, the letter categorylcoincides with the classcand we measure the classifica-tion performance by counting the number of correctly classified test set images by assigning images to the most probable class and thus letter category. For unsupervised decoding, we com-pute the probabilityP(l|y) by multiplying the probability of each cluster assignmentP(c|y) with the probability of each letter cate-goryP(l|c) and summing over the clustersc. Here we estimate the probabilityP(l|c) through the frequency distribution over letter categories of the images in the prior image set that are assigned to clusterc. The test set image is then again classified as the letter cat-egory with the highest probabilityP(l|y). Note that for unimodal decoding classification performance is not objectively measurable and thus not provided. For unsupervised decoding we repeated the procedure ten times for each number of clusters because K-means finds different clusterings each time it is executed, which leads to variability in reconstruction quality. We used two-tailed
t-tests to compare mean decoding performances.
Furthermore, as a baseline, we compared our approach with a simple discriminative approach to form reconstructions. This is achieved by directly predicting pixel values from observed fMRI responses using the same ridge regression approach as used in the encoding model. Also, we compared the classification perfor-mance of our approach with a simple discriminative approach. This is achieved by directly predicting class labels from observed brain responses using multinomial logistic regression with l1 penalty. We tested the robustness of our generative model by extending the prior to contain the full English alphabet instead of the subset of the six character categories. The character database does not contain the letter “X” so those were not included. Furthermore, some of the characters did not have 700 exemplars to contribute. These were oversampled to arrive at 700 instances of each category providing for a more balanced analysis.
3. RESULTS
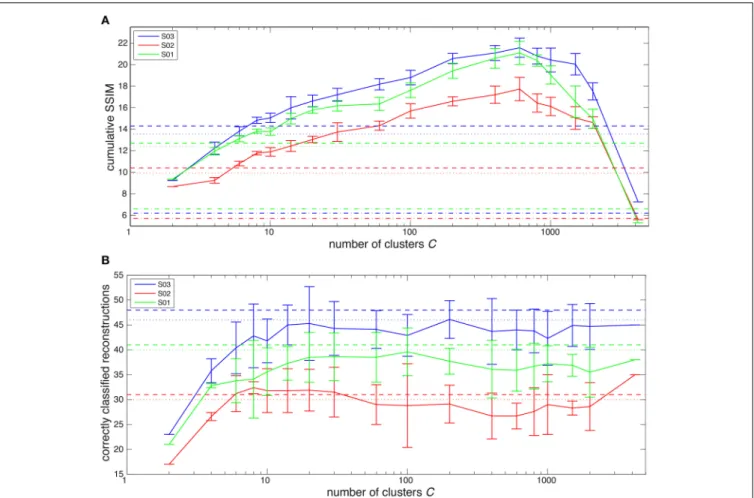
Figure 2shows the summation of SSIM scores for the original images in the test set and their reconstructions in Figure 2A. InFigure 2Bthe number of correctly classified reconstructions are shown for the different forms of decoding.Figure 2Ashows that all multimodal forms of decoding perform significantly better than unimodal decoding except for unsupervised decod-ing with 4200 clusters (p< 10−4 for unimodal vs supervised multimodal, supervised multimodal with semantic gating and unsupervised multimodal except forC= 4200). Semantic gat-ing gives a weakly significant increase over supervised multi-modal decoding without semantic gating (p= 0.0139 over all participants). Unsupervised multimodal decoding outperforms supervised multimodal decoding when the number of clusters exceeds eight for all participants. When the number of clusters
increases the SSIM scores go up until the prior is split up into more than 600 clusters, after which the SSIM scores start to drop again. The classification performance strongly increases when the prior is split up into a small number of classes, but from six clusters onwards the classification performance remains relatively stable. Classification is similar in performance for both supervised and unsupervised decoding, except that unsupervised decoding results are much more variable.
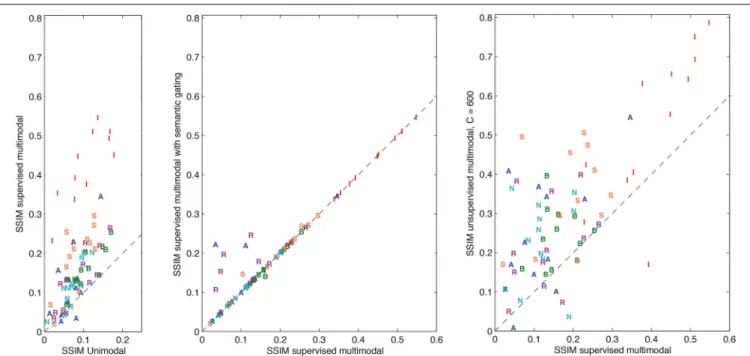
Figure 3shows comparisons between the different forms of decoding for the individual instances in the test set for subject S03. In the left-most panel the results for unimodal decoding vs. supervised multimodal decoding are shown. Almost all recon-structions improve for multimodal decoding. The middle panel shows that semantic gating increases the reconstruction accuracy of a small portion of the test set, while for most of the recon-structions the performance stays the same as the performance when reconstructing without semantic information. One instance is reconstructed worse than without semantic information. The right-most panel compares supervised decoding to unsupervised multimodal decoding with 600 clusters. The great majority of instances improves for unsupervised multimodal decoding in comparison with supervised multimodal decoding. A salient find-ing is that especially the reconstructions of the characters “I” are greatly improved under all forms of multimodal decoding.
Figure 4depicts the probability of belonging to each category for all instances in the test set for subject S03. The classifica-tion performance is similar for both supervised and unsupervised decoding. The block diagonal structure demonstrates that many of the instances are correctly identified with a high probability for both supervised and unsupervised decoding. Furthermore, the figure reveals that often one or just a few categories are attributed to an instance. Often the most probable category is the category to which the instance belongs. Semantic gating increases accuracy for some instances and decreases accuracy for other instances. Furthermore, the figures reveal that some characters are confused with each other. For instance, characters “A” and “N” are often confused and also the character “B” is confused with all other cat-egories. The character “I” is an example of a character that is not often confused with the other categories.
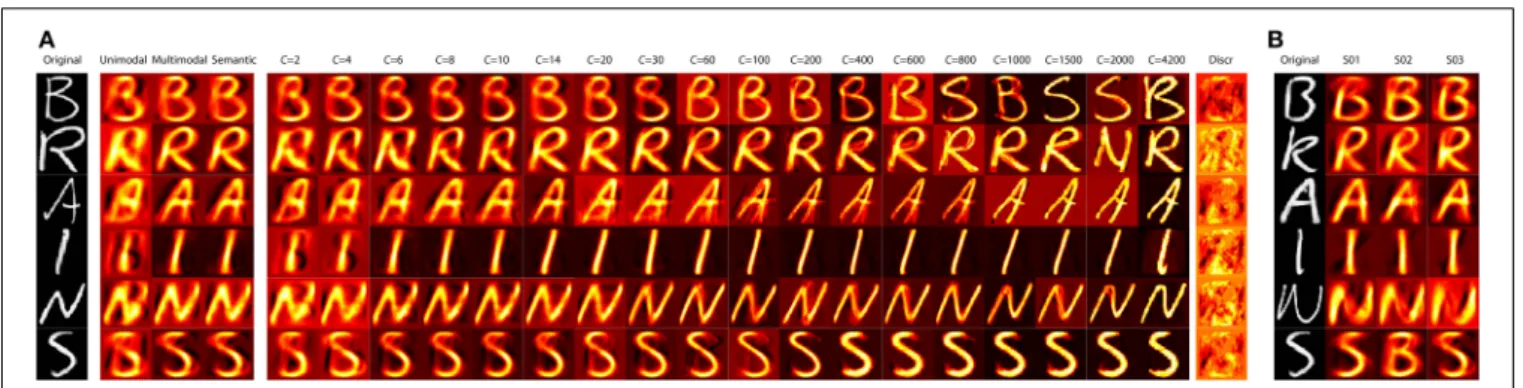
Figure 5displays the reconstruction results for the different decoding schemes for some exemplars in the test set for sub-ject S03. As can be seen, unimodal decoding retrieves the gist of the original stimulus but multimodal decoding improves the reconstructions greatly. Furthermore, it is shown that supervised multimodal decoding and unsupervised multimodal decoding with more than six clusters results in reconstructions of similar quality. For unsupervised multimodal decoding with an increas-ing number of clusters the reconstructions are sharpened. When the number of clusters exceeds about 20 the reconstructions start to converge to a particular image from the prior, which might not fully fit the original, but has a very high overlap. When the num-ber of clusters stays under approximately 20, the reconstruction is a mix of a large number of prior images. Below approxi-mately 20 clusters the reconstructions match the original very well, but the reconstructions are more blurry than the original. Figure 5B shows some exemplars that convey that the recon-structions are very similar across participants. Since we choose
FIGURE 2 | (A)Summations over the SSIM score for all original images with their reconstructions. The dashed-dotted lines show the scores for unimodal reconstruction, the dotted lines show the scores for supervised multimodal decoding and the dashed lines show the SSIM scores for supervised multimodal decoding scores with semantic gating. The solid lines indicate the SSIM score for different numbers of clusters for unsupervised multimodal reconstruction. The error bars indicate the standard error of the mean and the
colors indicate the different subjects S01, S02, and S03.(B)Number of reconstructions that were classified correctly in the test set of 72 images for all participants. The dotted lines show the classification performance for supervised multimodal decoding and the dashed lines show the classification for supervised multimodal decoding with semantic information included. For unsupervised multimodal decoding the mean and range are given for different numbers of clusters.
to take the most probable cluster for reconstruction we obtain high-quality image reconstructions, but in cases where a cluster is chosen that represents the incorrect category, the reconstructions are similar in their low-level features, yet incongruent in terms of their semantics. For instance inFigure 5Bthe “S” for S02 is reconstructed as a “B” for which the low-level features match the original quite well.
As a baseline, we test a basic discriminative model with the same ridge regression approach. The summation of SSIM scores in the test set result in 1.44, 0.29, and 0.41 for subjects S01, S02, and S03 respectively, which is significantly lower than all decoding settings including unimodal decoding (unimodal:p=
0.001, other:p< 10−4 over all participants). For comparison, learning the categories in a discriminative setting from V1 with
l1-penalized multinomial logistic regression resulted in 54.2, 44.4, and 51.4% correctly classified test set images for S01, S02, and S03, respectively. This is not significantly different from the results for multimodal decoding with 55.6, 41.7, and 63.9% for each of the participants. Similarly there is no significant difference
for supervised multimodal decoding with semantic gating or unsupervised multimodal decoding.
Figure 6illustrates the probabilities of belonging to the char-acter categories for all test set images when the prior is extended to include the complete alphabet. Still a significant number of images is correctly identified. We obtained accuracies of 30.6, 16.7, and 45% over a 4% chance level for each of the three par-ticipants. It is remarkable how well the characters still converge to the correct category for subject S03. However, for the participants’ data that give rise to less accurate reconstructions, characters often become assigned to the incorrect categories. For S03 it can be observed that only a few of the other categories are selected and that these categories are often very similar in their low-level features with the correct category. Previously, the “I” was never confused with the other categories, while now the “T” becomes a confusing category. This shows that characters are easy to classify when they are unique in their low-level features, which is partic-ularly the case for the character “I” in our dataset. In contrast, Figure 6shows that the character “A” is a very difficult character
Schoenmakers et al. Reconstructions from human brain activity
FIGURE 3 | Comparisons between the different forms of decoding for the individual instances in the test set for S03 measured in terms of SSIM.First unimodal decoding vs. supervised multimodal decoding, then
supervised multimodal decoding with or without semantic gating and finally supervised multimodal decoding vs. unsupervised multimodal decoding.
FIGURE 4 | The probabilities for all instances of the test set on the six character categories for S03 for supervised multimodal decoding, supervised multimodal decoding with semantic gating and unsupervised multimodal decoding.The instances have been sorted on the probability of the correct category.
to reconstruct, possibly because of strongly overlapping features with other characters, such as the “H” and the “N”. The recon-struction performance in terms of SSIM also slightly decreases to 9.3, 8.4, and 12.3 for S01, S02, and S03, respectively, using supervised multimodal decoding given the extended prior. 4. DISCUSSION
We introduced a hybrid Bayesian network that can decode stimuli from the human brain by considering both low-level feature information and high-level semantic information. In the network, information from low-level brain areas comes together with information from high-level brain areas when using semantic gating. Results show that the reconstruction performance is very accurate for the majority
of stimuli and highly improved in contrast to decoding in a unimodal setting. Furthermore, we showed that mul-timodal decoding can be fully automated by learning clusters from the data, leading to equally good decoding performance.
While discriminative models work well, it has been shown that generative models in many cases perform better in set-tings with few training samples (Ng and Jordan, 2002). Often fMRI datasets are recorded under tight constraints on scan-ning time and attention span from participants. Our generative approach makes accurate reconstructions from fMRI data feasible under such circumstances. Our data is recorded under a stan-dard approach of a rapid event-related design with an hour of scanning, which is not too demanding for participants. Using a
FIGURE 5 | (A)shows exemplars of reconstructions for S03 for the different decoding variants.(B)shows exemplars of original images and their reconstructions for the different participants using supervised multimodal decoding.
FIGURE 6 | Probability for all 72 instances of the test set for S03 with the extended prior that contains instances for the characters of the alphabet.
The instances have been sorted on the probability of the correct category.
relatively small set of prior images in the Gaussian mixture model we could obtain accurate reconstructions. A simple regularized linear regression under the same settings with a discriminative approach for reconstruction of images at pixel level results in very poor reconstructions contrary to our generative approach. With some effort, similar reconstruction performance can proba-bly be obtained with more advanced discriminative or generative approaches, in particular those that implicitly or explicitly involve dimension reduction (e.g.,Miyawaki et al., 2008; van Gerven and Heskes, 2010; van Gerven et al., 2010). However, such models may be more difficult to interpret and to extend than the generative Bayesian framework advocated here.
A strength of our generative approach with a multimodal prior is that we can automatically infer higher-order semantic categories from low-level image features. We found that biasing toward the most probable category leads to better reconstruc-tions (in terms of SSIM) than taking a standard weighted average over all categories. The drawback of choosing the most prob-able category is that reconstructions may converge toward the incorrect stimulus category. It is not always possible to correctly classify handwritten characters based on their low-level features. Sometimes the characters are ambiguous about their category and often the category with which it is confused is actually a cate-gory that has highly overlapping features. Furthermore, post hoc exploration of the prior revealed that approximately ten of the
original images of the test set are very similar to instances from the prior that come from a different category. So even if the BOLD response would have been recorded perfectly for these instances we would end up with wrongly categorized reconstructions. This suggests that perfect classification is impossible based on low-level features alone, which might be avoided when high-level brain areas can contribute the correct classification for categorically ambiguous images.
In order to overcome the incorrect classification of stim-uli based on their low-level information, semantic gating can improve the classification and thus the reconstruction. By extract-ing semantic information from higher-order brain areas we were able to enforce the correct category during reconstruction. Here, we only gated information from V2 since we did not have cover-age of other high-level brain regions for this dataset. The dataset was initially gathered to get the best possible acquisition of V1 and therefore extrastriate cortex was not fully available. It is quite impressive that including categorical information from V2 alone already gives an improvement, since V2 is still a rela-tively low-level visual area. Future work can investigate if there is a greater improvement when categorical information from the complete visual hierarchy is included. When an image is shown it will propagate through the brain, so each visual area should boost the reconstructions and classification performance. Furthermore, studies with stimuli from a wide range of semantic
Schoenmakers et al. Reconstructions from human brain activity
categories could greatly benefit from this paradigm. The seman-tic space in the brain can be mapped like inHuth et al. (2012). This semantic information can then be gated in order to tai-lor the prior to the stimulus that is decoded from V1, possibly resulting in scaling up the image reconstruction to a wide range of categories.
In this experiment, we had access to a fully labeled dataset which made it easy to explore a supervised model, but a fully labeled database might not be available in all settings. Especially when we want to extend the reconstruction paradigm to the full range of natural images an extremely large set of images is prob-ably necessary to span the space of natural images, in which case labels are probably not available. Therefore, we investigated whether the reconstructions can be made with a prior for which the mixture components were estimated in an unsupervised set-ting. We showed that it is possible to have a fully automated setup that infers a fitting set of images from the prior based on low-level information without sacrificing reconstruction performance. In our case the optimum reconstruction seems to be reached when the set of images in the prior is subdivided in 600 clusters. This optimum might be different for each dataset, but can be learned from the data. In principle, it is also possible to apply semantic gating to unsupervised decoding, but in our case this did not give good results (investigated, but not reported in this paper). Our dataset contained 360 recordings of stimuli, which is enough data for six categories when the dataset is well balanced. Unfortunately the K-means cluster assignments rarely result in a well-balanced split. With only few stimuli it is hard to get a good estimation with multinomial logistic regression, resulting in poor decoding performance.
It is difficult to find a good measure for comparing images. Here, we used a combination of two types of measurements, structural similarity metric and classification performance. Both measures cover different aspects of the tested images and therefore give different results for image comparison. Together they allow for objective comparison, but still not all reconstruction informa-tion is encompassed by these measures. An alternative albeit time consuming way to evaluate reconstruction performance could be to acquire subjective ratings with a behavioral experiment.
We showed that high-quality reconstructions can be obtained from human brain data, but our framework can be advanced fur-ther. Empirically, we observed that it is important to have a good voxel selection to get the framework to perform sufficiently well. The voxel selections we made were based on retinotopic map-ping and selecting the voxels with high explained variance. This selection may be improved further by explicitly modeling sparse-ness in the voxel domain during encoding. Moreover, we here used a canonical HRF but the shape of the HRF varies across brain regions and subjects (Handwerker et al., 2004; Badillo et al., 2013). If the HRF is tailored to individual voxels, the performance is expected to increase for both encoding and decod-ing (Pedregosa et al., 2013). Another improvement could be to make use of a richer prior. In our dataset not all original images were accurately represented by the prior. A multi-scale approach might make it possible to include decoding of under-represented mid-level image features independent of semantic category.
An interesting avenue for future research is to examine how our framework performs on more challenging datasets while using more brain regions to drive the reconstructions. Also, it would be interesting to examine the merits of our framework when reconstructing the contents of other sensory modalities, of subjective states such as mental imagery or internal speech, or to reconstruct motor output.
In summary, we have developed a hybrid Bayesian network that can combine different sources and levels of information in a natural way to yield accurate reconstructions of handwritten characters from brain responses.
4.1. DATA SHARING
The data and code can be obtained through our lab website: www. ccnlab.net. Please refer to this article when using our data or code. AUTHOR CONTRIBUTIONS
Sanne Schoenmakers, Marcel van Gerven, and Tom Heskes designed the experiments. Sanne Schoenmakers, Umut Güçlü, Marcel van Gerven, and Tom Heskes developed the methods. Sanne Schoenmakers collected the data and carried out the anal-ysis. Sanne Schoenmakers, Umut Güçlü, Marcel van Gerven, and Tom Heskes prepared the manuscript.
ACKNOWLEDGMENT
This research was funded by the Netherlands Organization for Scientific Research (NWO-EW) under grant number 612.001.013.
SUPPLEMENTARY MATERIAL
The Supplementary Material for this article can be found online at: http://www.frontiersin.org/journal/10.3389/fncom. 2014.00173/abstract
REFERENCES
Badillo, S., Vincent, T., and Ciuciu, P. (2013). Group-level impacts of within- and between-subject hemodynamic variability in fMRI.Neuroimage82, 433–448. doi: 10.1016/j.neuroimage.2013.05.100
Bishop, C. (2006).Pattern Recognition and Machine Learning. New York, NY: Springer Verlag.
Cowen, A. S., Chun, M. M., and Kuhl, B. A. (2014). Neural portraits of perception: reconstructing face images from evoked brain activity.Neuroimage94, 12–22. doi: 10.1016/j.neuroimage.2014.03.018
Cox, D. D., and Savoy, R. L. (2003). Functional magnetic resonance imaging (fMRI) brain reading: detecting and classifying distributed patterns of fMRI activity in human visual cortex.Neuroimage19, 261–270. doi: 10.1016/S1053-8119(03)00049-1
DeYoe, E. A., Carman, G. J., Bandettini, P., Glickman, S., Wieser, J., Cox, R., et al. (1996). Mapping striate and extrastriate visual areas in human cerebral cortex.
Proc. Natl. Acad. Sci. U.S.A.93, 2382–2386. doi: 10.1073/pnas.93.6.2382 Engel, S. A., Glover, G. H., and Wandell, B. A. (1997). Retinotopic organization in
human visual cortex and the spatial precision of functional MRI.Cereb. Cortex
7, 181–192. doi: 10.1093/cercor/7.2.181
Friedman, J., Hastie, T., and Tibshirani, R. (2010). Regularization paths for gener-alized linear models via coordinate descent.J. Stat. Softw.33, 1–22.
Friston, K., Chu, C., Mourão-Miranda, J., Hulme, O., Rees, G., Penny, W., et al. (2008). Bayesian decoding of brain images.Neuroimage 39, 181–205. doi: 10.1016/j.neuroimage.2007.08.013
Güçlü, U., and van Gerven, M. A. (2014). Unsupervised feature learning improves prediction of human brain activity in response to natural images.PLoS Comput. Biol.10:e1003724. doi: 10.1371/journal.pcbi.1003724
Handwerker, D. A., Ollinger, J. M., and D’Esposito, M. (2004). Variation of bold hemodynamic responses across subjects and brain regions and
their effects on statistical analyses. Neuroimage 21, 1639–1651. doi: 10.1016/j.neuroimage.2003.11.029
Hastie, T., Tibshirani, R., and Friedman, J. (2009).The Elements of Statistical Learning: Data Mining, Inference, and Prediction. New York, NY: Springer. Haxby, J., Gobbini, M., Furey, M., Ishai, A., Schouten, J., and Pietrini, P. (2001).
Distributed and overlapping representations of faces and objects in ventral temporal cortex.Science293, 2425–2430. doi: 10.1126/science.1063736 Huth, A., Nishimoto, S., Vu, A., and Gallant, J. (2012). A continuous semantic space
describes the representation of thousands of object and action categories across the human brain.Neuron76, 1210–1224. doi: 10.1016/j.neuron.2012.10.014 Jordan, M. I., and Jacobs, R. A. (1994). Hierarchical mixtures of experts and the
EM algorithm.Neural Comput.6 , 181–214. doi: 10.1162/neco.1994.6.2.181 Kamitani, Y., and Tong, F. (2005). Decoding the visual and subjective contents of
the human brain.Nat. Neurosci.8, 679–685. doi: 10.1038/nn1444
Kay, K. N., Naselaris, T., Prenger, R. J., and Gallant, J. L. (2008). Identifying natural images from human brain activity. Nature 452, 352–355. doi: 10.1038/nature06713
Kriegeskorte, N., Mur, M., Ruff, D. A., Kiani, R., Bodurka, J., Esteky, H., et al. (2008). Matching categorical object representations in inferior temporal cortex of man and monkey.Neuron60, 1126–1141. doi: 10.1016/j.neuron.2008.10.043 Miyawaki, Y., Uchida, H., Yamashita, O., Sato, M., Morito, Y., Tanabe, H. C., et al. (2008). Visual image reconstruction from human brain activity using a com-bination of multiscale local image decoders.Neuron60, 915–929. doi: 10.1016/ j.neuron.2008.11.004
Mumford, J. A., Turner, B. O., Ashby, F. G., and Poldrack, R. A. (2011). Deconvolving BOLD activation in event-related designs for multivoxel pat-tern classification analyses. Neuroimage59, 2636–2643. doi: 10.1016/j.neur oimage.2011.08.076
Murphy, K. P. (2012).Machine Learning: A Probabilistic Perspective. Cambridge: MIT Press.
Naselaris, T., Kay, K. N., Nishimoto, S., and Gallant, J. L. (2010). Encoding and decoding in fMRI. Neuroimage 56, 400–410. doi: 10.1016/j.neuroimage.2010.07.073
Naselaris, T., Prenger, R. J., Kay, K. N., Oliver, M., and Gallant, J. L. (2009). Bayesian reconstruction of natural images from human brain activity.Neuron
63, 902–915. doi: 10.1016/j.neuron.2009.09.006
Ng, A. Y., and Jordan, M. I. (2002). On discriminative vs. generative classifiers: a comparison of logistic regression and naive bayes.Adv. Neural Inf. Process. Sys.
2, 841–848.
Nishimoto, S., Vu, A. T., Naselaris, T., Benjamini, Y., Yu, B., and Gallant, J. L. (2011). Reconstructing visual experiences from brain activity evoked by natural movies.
Curr. Biol.21, 1641–1646. doi: 10.1016/j.cub.2011.08.031
Pedregosa, F., Eickenberg, M., Thirion, B., and Gramfort, A. (2013). “Hrf esti-mation improves sensitivity of fmri encoding and decoding models,” in
Pattern Recognition in Neuroimaging (PRNI), 2013 International Workshop
(Philadelphia, PA: IEEE), 165–169. doi: 10.1109/PRNI.2013.50
Petersen, K. B., and Pedersen, M. S. (2008). The Matrix Cookbook.Tech. Univ. Den.
7–15. Available online at: http://matrixcookbook.com/
Schoenmakers, S., Barth, M., Heskes, T., and van Gerven, M. (2013). Linear reconstruction of perceived images from human brain activity.Neuroimage83, 951–961. doi: 10.1016/j.neuroimage.2013.07.043
Schoenmakers, S., van Gerven, M., and Heskes, T. (2014). “Gaussian mixture models improve fMRI-based image reconstruction,” inPattern Recognition in Neuroimaging(Tubingen: IEEE), 37–41. doi: 10.1109/PRNI.2014.6858542 Seber, G. A. (2009).Multivariate Observations, Vol. 252. New York, NY: John Wiley
& Sons.
Sereno, M. I., Dale, A. M., Reppas, J. B., Kwong, K. K., Belliveau, J. W., Brady, T. J., et al. (1995). Borders of multiple visual areas in humans revealed by functional magnetic resonance imaging.Science268, 889–893. doi: 10.1126/sci-ence.7754376
Simanova, I., Hagoort, P., Oostenveld, R., and van Gerven, M. (2014). Modality-independent decoding of semantic information from the human brain.Cereb. Cortex24, 426–434. doi: 10.1093/cercor/bhs324
Spath, H. (1985). Cluster Dissection and Analysis: Theory, Fortran Programs, Examples. Chichester: Prentice-Hall, Inc.
Thirion, B., Duchesnay, E., Hubbard, E., Dubois, J., Poline, J.-B., Lebihan, D., et al. (2006). Inverse retinotopy: inferring the visual content of images from brain activation patterns. Neuroimage 33, 1104–1116. doi: 10.1016/j.neuroimage.2006.06.062
van der Maaten, L. (2009).A New Benchmark Dataset for Handwritten Character Recognition. Technical report, Tilburg University, Tilburg.
van Gerven, M. A. J., de Lange, F. P., and Heskes, T. (2010). Neural decod-ing with hierarchical generative models.Neural Comput.22, 3127–3142. doi: 10.1162/NECO/a/00047
van Gerven, M. A. J., and Heskes, T. (2010). “Sparse orthonormalized partial least squares,” inBenelux Conference on Artificial Intelligence(Luxembourg). Wang, Z., Bovik, A. C., Sheikh, H. R., and Simoncelli, E. P. (2004). Image quality
assessment: from error visibility to structural similarity.IEEE Trans. Image Process.13, 600–612. doi: 10.1109/TIP.2003.819861
Conflict of Interest Statement:The authors declare that the research was
con-ducted in the absence of any commercial or financial relationships that could be construed as a potential conflict of interest.
Received: 16 July 2014; accepted: 19 December 2014; published online: 30 January 2015.
Citation: Schoenmakers S, Güçlü U, van Gerven M and Heskes T (2015) Gaussian mixture models and semantic gating improve reconstructions from human brain activity. Front. Comput. Neurosci.8:173. doi: 10.3389/fncom.2014.00173
This article was submitted to the journal Frontiers in Computational Neuroscience. Copyright © 2015 Schoenmakers, Güçlü, van Gerven and Heskes. This is an open-access article distributed under the terms of the Creative Commons Attribution License (CC BY). The use, distribution or reproduction in other forums is permitted, provided the original author(s) or licensor are credited and that the original publication in this journal is cited, in accordance with accepted academic practice. No use, distribution or reproduction is permitted which does not comply with these terms.