U.S. Department of the Interior
Bureau of Land Management
RIPARIAN AREA MANAGEMENT
TR 1737-16 1999, Revised 2003
A User Guide to Assessing Proper
Functioning Condition and
the Supporting Science for Lentic Areas
U.S. Department of Agriculture
Forest Service
U.S. Department of Agriculture
Copies available from: Bureau of Land Management
National Business Center BC-650B
P.O. Box 25047
Denver, Colorado 80225-0047 BLM/RS/ST-99/001+1737+REV03
RIPARIAN AREA MANAGEMENT
A User Guide to Assessing Proper
Functioning Condition and
the Supporting Science for Lentic Areas
by
Don Prichard - Work Group Leader Fishery Biologist/Riparian-Wetland Coordinator
Bureau of Land Management
National Applied Resource Sciences Center, Colorado
Work Group
Technical Reference 1737-16 1999, revised 2003 U.S. Department of the Interior
Bureau of Land Management
National Applied Resource Sciences Center P.O. Box 25047
Denver, CO 80225-0047 Forrest Berg
Stream Mechanics Engineer Natural Resources Conservation Service
Riparian/Wetland Technical Team Bozeman, Montana Warren Hagenbuck
Regional Wetland Coordinator (retired) U.S. Fish and Wildlife Service
Albuquerque, New Mexico Russ Krapf Soil Scientist Bureau of Land Management
National Training Center Phoenix, Arizona
Robert Leinard Plant Ecologist
Natural Resources Conservation Service Riparian/Wetland Technical Team
Bozeman, Montana
Steve Leonard
Riparian Ecologist/Grazing Management Specialist Bureau of Land Management
National Riparian Service Team Prineville, Oregon Mary Manning Ecologist Forest Service Northern Region Missoula, Montana Chris Noble Soil Scientist
Natural Resources Conservation Service Riparian/Wetland Technical Team
Bozeman, Montana Janice Staats
Hydrologist Forest Service
National Riparian Service Team Prineville, Oregon
Acknowledgments
The authors would like to thank the following individuals for the time they offered in review, comment, and development of this document: Al Amen, Mark
Biddlecomb, Clay Bridges, Pam Clemmer, Mary D’Aversa, Jim Fogg, Karl Gebhardt, Paula Ledford, Ramone McCoy, and Paul Summers from the Bureau of Land Management; Lorena Corzatt and Susan Holtzman from the Forest Service; and Terry Costner, Marcus Miller, and Sandy Wyman from the Natural Resources Conservation Service.
The authors also extend a special thank you to Linda Hill and Jennifer Kapus of the National Applied Resource Sciences Center, and to the National Business Center, for doing a fine job in editing, layout, design, and production of the final document.
Contents
Page
Acknowledgments . . . .iii
I. Introduction . . . .1
II. Method Development . . . .3
III. Definitions . . . .5
IV. PFC Assessment Procedure . . . .7
A. Review Existing Documents . . . .7
B. Analyze the Definition of PFC . . . .7
C. Assess Functionality . . . .8
1. Attributes and Processes . . . .8
2. Capability and Potential . . . .10
3. Functioning Condition . . . .11
4. Functional Rating . . . .13
D. Institute the Process . . . .14
1. Planning . . . .14
2. Management . . . .15
3. Monitoring . . . .16
V. Quantification of Checklist Items . . . .17
A. Hydrology . . . .18
Item 1: Riparian-wetland area is saturated at or near the surface or inundated in “relatively frequent” events . . . .19
Item 2: Fluctuation of water levels is not excessive . . . .23
Item 3: Riparian-wetland area is enlarging or has achieve potential extent . . . .24
Item 4: Upland watershed is not contributing to riparian-wetland degradation . . . .26
Item 5: Water quality is sufficient to support riparian-wetland plants . . . .30
Item 6: Natural surface or subsurface flow patterns are not altered by disturbance (i.e., hoof action, dams, dikes, trails, roads, rills, gullies, drilling activities) . . . .31
Item 7: Structure accommodates safe passage of flows (e.g., no headcut affecting dam or spillway) . . . .32
B. Vegetation . . . .33
Item 8: There is diverse age-class distribution of riparian-wetland vegetation (recruitment for maintenance/recovery) . . . .34
Item 9: There is diverse composition of riparian-wetland vegetation (for maintenance/recovery) . . . .36
Item 10: Species present indicate maintenance of
riparian-wetland soil moisture characteristics . . . .37
Item 11: Vegetation is comprised of those plants or plant communities that have root masses capable of withstanding wind events, wave flow events, or overland flows (e.g., storm events, snowmelt) . . . .39
Item 12: Riparian-wetland plants exhibit high vigor . . . .40
Item 13: Adequate riparian-wetland vegetative cover is present to protect shoreline/soil surface and dissipate energy during high wind and wave events or overland flows . . . .42
Item 14: Frost or abnormal hydrologic heaving is not present . . . .43
Item 15: Favorable microsite condition (i.e., woody material, water temperature, etc.) is maintained by adjacent site characteristics . . . .45
C. Erosion/Deposition . . . .47
Item 16: Accumulation of chemicals affecting plant productivity/composition is not apparent . . . .47
Item 17: Saturation of soils (i.e., ponding, flooding frequency, and duration) is sufficient to compose and maintain hydric soils . . . .48
Item 18: Underlying geologic structure/soil material/permafrost is capable of restricting water percolation . . . .51
Item 19: Riparian-wetland is in balance with the water and sediment being supplied by the watershed (i.e., no excessive erosion or deposition) . . . .52
Item 20: Islands and shoreline characteristics (i.e., rocks, coarse and/or large woody material) are adequate to dissipate wind and wave event energies . . . .53
VI. Summary . . . .55
Appendix A: Riparian-Wetland Lentic Checklist . . . .57
Appendix B: Potential and Capability Examples . . . .63
Appendix C: Lentic Riparian-Wetland Examples . . . .77
Appendix D: PFC—What It Is and What It Isn’t . . . .89
Appendix E: Common Wetlands . . . .93
Appendix F: Problem Wetlands . . . .97
Literature Cited . . . .103
A User Guide to Assessing Proper
Functioning Condition and
the Supporting Science for Lentic Areas
I. Introduction
Riparian-wetland areas are some of our most productive resources. They are highly prized for their recreation, fish and wildlife, water supply, cultural, and historic values, as well as for their economic values, which stem from their use for livestock production, timber harvest, and mineral extraction.
This document provides guidance for assessing the condition of any riparian-wetland area other than a lotic (riverine) area. These areas, which are called lentic areas, not only include jurisdictional wetlands as defined by the U.S. Army Corps of Engineers (1987), but also nonjurisdictional areas (e.g., deep water, freshwater, saline, marine, and estuarine) that provide enough available water to the root zone to establish and maintain riparian-wetland vegetation.
Proper functioning condition (PFC) is a qualitative method for assessing the condi-tion of riparian wetland areas. The term PFC is used to describe both the assessment process and a defined, on the-ground condition of a riparian-wetland area.
The PFC assessment refers to a consistent approach for considering hydrology, vegetation, and erosion/deposition (soils) attributes and processes to assess the condition of riparian wetland areas. A checklist is used for the PFC assessment (Appendix A), which synthesizes information that is basic for determining a riparian-wetland area’s health.
The on-the-ground condition termed PFC refers to how well the physical processes are functioning. PFC is a state of resiliency that will allow a lentic riparian-wet-land area to hold together during wind and wave action events or overriparian-wet-land flow events with a high degree of reliability. This resiliency allows an area to then pro-duce desired values, such as waterfowl habitat, neotropical bird habitat, or forage over time. Riparian-wetland areas that are not functioning properly cannot sustain these values.
PFC is a qualitative assessment based on quantitative science. The PFC assessment is intended to be performed by a trained and experienced interdisciplinary (ID) team. Quantitative techniques support the PFC checklist and should be used in conjunction with the PFC assessment for individual calibration, where answers are uncertain, or where experience is limited. PFC is also an appropriate starting point for deter-mining and prioritizing the type and location of quantitative inventory or monitoring necessary.
The PFC assessment has proven to be an excellent communication tool for bringing diverse groups to consensus. This process provides a common vocabulary for iden-tifying the building blocks for the development of desired condition (DC) and resulting values.
Again, the method developed for assessing PFC is qualitative and is based on using a checklist to make a relatively quick determination of condition. The purpose of this technical reference is to explain how this methodology was developed for lentic areas and to assist an ID team in answering checklist items by providing examples of and references to methods of quantification where necessary.
II. Method Development
The Bureau of Land Management (BLM), the Fish and Wildlife Service (FWS), and the Natural Resources Conservation Service (NRCS), formerly the Soil Conservation Service, worked together to develop the PFC method. The methodology for
assessing the condition of running water (lotic) systems is presented in BLM Technical Reference (TR) 1737-9, Process for Assessing Proper Functioning Condition (Prichard et al. 1993), and the methodology for standing water (lentic) systems is presented in TR 1737-11, Process for Assessing Proper Functioning Condition for Lentic Riparian-Wetland Areas (Prichard et al. 1994).
Technical Reference 1737-15, A User Guide to Assessing Proper Functioning
Condition and the Supporting Science for Lotic Areas (Prichard et al. 1998) provides the background for how the PFC tool was developed. The PFC method has been implemented by BLM and adopted by several other agencies. In 1996, the BLM and the USDA Forest Service (FS) announced a cooperative riparian-wetland man-agement strategy, which would include the NRCS as a principal partner. A National Riparian Service Team was formed to act as a catalyst for implementing this
strategy.
This cooperative strategy recognized that if riparian-wetland areas are to be produc-tive, they have to be managed on a watershed basis, which requires working together across ownership boundaries. To be successful, the agencies would need to use common terms and definitions and determine a minimum method for evaluating the condition of riparian-wetland areas. The BLM and the FS identified the PFC method as the starting point—as the minimum level of assessment for riparian-wetland areas.
III. Definitions
To assess the condition of a riparian-wetland area, there must be a gauge to measure against. The definition of PFC in TR 1737-9 and TR 1737-15 establishes the gauge for assessing lotic systems. This definition has to be adjusted for lentic systems because they are affected by wind and wave energies or overland flow energies versus high flow events, and they typically have a restrictive layer (e.g., geologic structure/soil material/permafrost/manmade restrictive layer) that limits water perco-lation and maintains the site:
Proper Functioning Condition - Lentic riparian-wetland areas are func-tioning properly when adequate vegetation, landform, or debris is present to: dissipate energies associated with wind action, wave action, and overland flow from adjacent sites, thereby reducing erosion and improving water quality; filter sediment and aid floodplain development; improve flood-water retention and ground-water recharge; develop root masses that stabilize islands and shoreline features against cutting action; restrict water percola-tion; develop diverse ponding characteristics to provide the habitat and the water depth, duration, and temperature necessary for fish production, water-bird breeding, and other uses; and support greater biodiversity.
The components of this definition are in order relative to how processes work on the ground.
When adequate vegetation, landform, or debris is present to dissipate energy associ-ated with wind and wave action or overland flow, then a number of physical changes begin to occur, such as reduced erosion, floodplain development, and improved flood-water retention. As physical aspects of an area begin to function, they start the process of developing wetland characteristics. These physical aspects have to be functioning properly to sustain characteristics that provide habitat for resource values.
For areas that are not functioning properly, changes have to be made to allow them to recover (e.g., acquire adequate vegetation). A change such as increasing vegeta-tion cover results in changes that improve funcvegeta-tion. Recovery starts with having the right elements present to dissipate energy, which puts the physical process into working order and provides the foundation to sustain the desired condition.
Each riparian-wetland area has to be judged against its capability and potential. The capability and potential of natural riparian-wetland areas are characterized by the interaction of three components: 1) hydrology, 2) vegetation, and 3) erosion/ deposition (soils).
Potential is defined as the highest ecological status a riparian-wetland area can attain given no political, social, or economical constraints; it is often referred to as the “potential natural community” (PNC).
Capability is defined as the highest ecological status a riparian-wetland area can attain given political, social, or economical constraints. These con-straints are often referred to as limiting factors.
Examples of how both potential and capability apply to the checklist and rating can be found in Appendix B. A more detailed discussion on potential and capability is found in Appendix B of TR 1737-15.
If a riparian-wetland area is not in PFC, it is placed into one of three other cate-gories:
Functional—At Risk- Riparian-wetland areas that are in functional condi-tion, but that have an existing soil, water, or vegetation attribute that makes them susceptible to degradation.
Nonfunctional - Riparian-wetland areas that clearly are not providing ade-quate vegetation, landform, or woody debris to dissipate energies associated with flow events, and thus are not reducing erosion, improving water quality, etc.
Unknown - Riparian-wetland areas for which there is a lack of sufficient information to make any form of determination.
IV. PFC Assessment Procedure
The process for assessing lentic areas involves reviewing existing documents, ana-lyzing the PFC definition, and assessing functionality using an ID team. Each step is important because it provides a foundation and a certain level of understanding necessary to complete the next step.
A. Review Existing Documents
An ID team should review TR 1737-9, TR 1737-11, and TR 1737-15 before
assessing functioning condition of lentic riparian-wetland areas. The ID team should also review the other technical references identified in TR 1737-9 and TR 1737-15, which provide a basis for assessing PFC, as well as thought processes that will be useful in assessing the functional status of any riparian wetland area. Reviewing these documents helps an ID team develop an understanding of the concepts of the riparian-wetland area they are assessing.
Other documents to review may include Classification of Wetland and Deepwater Habitats of the United States (Cowardin et al. 1979), local riparian-wetland vegetation classifications, soil survey reports, and riparian-wetland ecological site descriptions. The level of information necessary to assess PFC for lentic riparian-wetland areas will vary. Some will require the magnitude of effort provided by an ecological site inventory (ESI) to assess functionality, while others can be assessed by using the lentic checklist in Appendix A. Information pertaining to ESI applications can be found in BLM’s TR 1737-7, Procedures for Ecological Site Inventory—with Special Reference to Riparian-Wetland Sites (Leonard et al. 1992a).
When using the PFC method to assess functioning condition, existing files should be reviewed for pertinent information. For some riparian-wetland areas, enough infor-mation may exist to assess functionality without having to go to the field. However, field verification is desirable, if not necessary, in most cases. For other areas, the existing information will be useful in establishing capability and potential or trend.
B. Analyze the Definition of PFC
When assessing PFC for lentic riparian-wetland areas, the definition of PFC must be analyzed. One way to do this is by breaking the definition down as follows:
Lentic riparian-wetland areas are functioning properly when adequate vegetation, landform, or debris is present to:
• dissipate energies associated with wind action, wave action, and overland flow from adjacent sites, thereby reducing erosion and improving
water quality;
• improve flood-water retention and ground-water recharge;
• develop root masses that stabilize islands and shoreline features against cutting action;
• restrict water percolation;
• develop diverse ponding characteristics to provide the habitat and the water depth, duration, and temperature necessary for fish production, waterbird breeding, and other uses;
• and support greater biodiversity.
Lentic riparian-wetland areas are functioning properly when there is adequate sta-bility present to provide the listed benefits applicable to a particular area. The analysis must be based on the riparian-wetland area's capability and potential. If, for example, the system does not have the potential to support woody vegetation, that criteria would not be used in the assessment.
C. Assess Functionality
Assessing the condition of a lentic riparian-wetland area requires an ID team to look at the entire area. Attributes and processes do not always occur in equal balance throughout a lentic riparian wetland area. For example, overland flow might enter a given riparian-wetland area at one end and exit at the opposite end. In order to answer specific items on the lentic checklist, an ID team is going to have to go to the location where water and sediment are being supplied from the watershed to assess balance, to the location of the outlet to assess safe passage of flows, and look at the entire area to determine if flow patterns are altered by disturbance.
Stratified sampling may be appropriate for lentic areas when you assess and extrapo-late from one riparian-wetland area to another area of the same type as long as envi-ronmental, management, and other factors relating to the assessment are constant. Even when these factors are constant, current aerial photos need to be checked to ensure conditions are the same. The procedure to do this is explained in BLM’s TR 1737-12, Using Aerial Photographs to Assess Proper Functioning Condition of Riparian-Wetland Areas (Prichard et al. 1996).
1. Attributes and Processes
Assessing PFC involves understanding the attributes and processes occurring in a lentic riparian wetland area. An ID team must determine the attributes and processes important to the riparian wetland area that is being assessed. If they do not spend the time to develop an understanding of the processes affecting an area, their judge-ment about PFC will be incomplete and may be incorrect. The attributes and
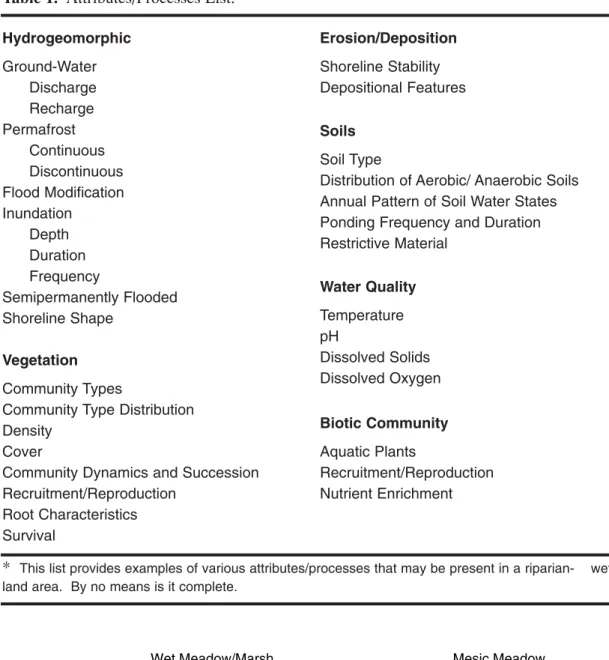
processes for the area being evaluated need to be identified. Table 1 provides a list of attributes and processes that may occur in any given lentic riparian-wetland area. To understand these processes, an example of an Alaskan palustrine wetland area in both a functional and nonfunctional condition is provided in Figure 1. Applying the
Hydrogeomorphic Ground-Water Discharge Recharge Permafrost Continuous Discontinuous Flood Modification Inundation Depth Duration Frequency Semipermanently Flooded Shoreline Shape Vegetation Community Types
Community Type Distribution Density
Cover
Community Dynamics and Succession Recruitment/Reproduction Root Characteristics Survival Erosion/Deposition Shoreline Stability Depositional Features Soils Soil Type
Distribution of Aerobic/ Anaerobic Soils Annual Pattern of Soil Water States Ponding Frequency and Duration Restrictive Material Water Quality Temperature pH Dissolved Solids Dissolved Oxygen Biotic Community Aquatic Plants Recruitment/Reproduction Nutrient Enrichment
Table 1. Attributes/Processes List.*
* This list provides examples of various attributes/processes that may be present in a riparian-
wet-land area. By no means is it complete.
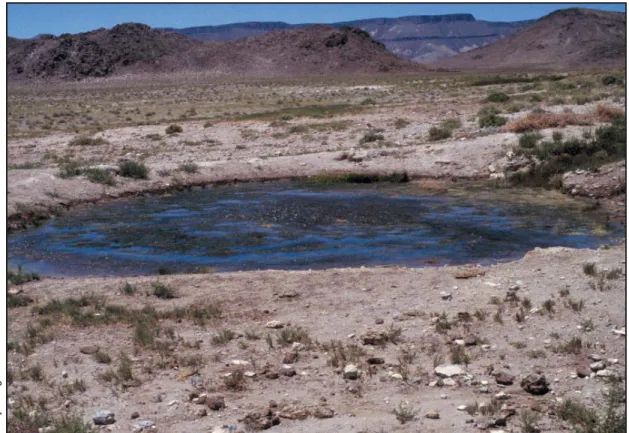
Mesic Meadow Wet Meadow/Marsh ^ Water Table Water Table > Mesic Meadow Stratified Soil Material Fragmental Substrate Basalt Bedrock Permafrost State
B
StateA
Figure 1. Proper functioning condition (State A) and nonfunctional condition (State B) for a lentic palustrine wetland area.
PFC definition, State Awould be classified as PFC. Important attributes and processes present for State Aare:
Hydrogeomorphic - Continuous permafrost; shoreline shape; and depth, duration, and frequency of inundation.
Vegetation - Community types and distribution, recruitment and reproduction, root density, community dynamics, and survival. Erosion/Deposition - Shoreline stability.
Soils - Distribution of anaerobic soil and ponding frequency and duration. Water Quality - No change.
Biotic Community - Aquatic plant recruitment and reproduction.
Land activities and natural processes that disrupt the permafrost layer would result in State Aprogressing to State B. State Bwould be classified as nonfunctional. The following changes in attributes and processes are likely in State B:
Hydrogeomorphic - Continuous permafrost (lost); shoreline shape (changed); and depth, duration, and frequency of inundation (decreased).
Erosion/Deposition - Shoreline stability (decreased).
Soils - Distribution of anaerobic soil and ponding frequency and duration (decreased).
Water Quality - Temperature (increased), pH (changed).
Biotic Community - Aquatic plant recruitment and reproduction (decreased). The previous example is found in Alaska and represents only one of many types of lentic riparian wetlands. However, it is important to remember that there are other types and that:
Riparian-wetland areas do have fundamental commonalities in how they function, but they also have their own unique attributes. Riparian-wetland areas can and do function quite differently. As a result, most areas need to be evaluated against their own capability and potential. Even for similar areas, human influence may have introduced component(s) that have
changed the area's capability and potential. Assessments, to be correct, must consider these factors and the uniqueness of each area.
2. Capability and Potential
Determining functionality of lentic riparian-wetland areas involves determining an area's capability and potential. The approach is:
• Look for reference areas (relic areas, exclosures, preserves, etc.). • Seek out historic photos, survey notes, and/or documents that indicate
• Search out species lists (animals and plants - historic and present).
• Determine species habitat needs (animals and plants) related to species that are/were present.
• Examine the soils and determine if they were saturated at one time and are now well-drained.
• Examine the hydrology; establish the frequency and duration of flooding/ponding.
• Identify vegetation that currently exists and determine if the same species occurred historically.
• Determine the entire watershed's general condition and identify its major landform(s).
• Look for limiting factors, both human-caused and natural, and determine if they can be corrected.
This approach forms the basis for initiating an inventory effort like ESI. For some areas, conducting an ESI effort will be the only way to assess an area's capability and potential.
3. Functioning Condition
The steps in Figure 3 of TR 1737-15 provide examples of the relationship between PFC and vegetation community succession for a lotic riparian-wetland area. This relationship can be applied to lentic riparian-wetland areas as well. If vegetation succession continues uninterrupted (Step 1 to Step 2), the riparian-wetland site will progress through some predictable changes from early seral to potential natural com-munity (although not necessarily as linearly as depicted). As the vegetation commu-nity progresses, the riparian-wetland area will advance through phases of not
functioning, functioning at-risk, and functioning properly.
At various stages within this successional process, the riparian-wetland area will provide a variety of values for different uses (Step 4). Optimal conditions for grazing occur when forage is abundant and the area is stable and sustainable. Wildlife goals depend upon the species for which the area is being managed. If the riparian-wetland area is to provide nesting habitat for songbirds, the optimum condi-tions might be late seral. If the area is to provide feeding habitat for shorebirds, the optimum condition might be mid-seral. Lentic riparian-wetland areas can function properly before they achieve their potential. The PFC definition does not mean potential or optimal conditions for a particular species have to be achieved for an area to be rated as functioning properly. The threshold for any goal is at least PFC because any rating below this would not be sustainable. For riparian-wetland areas, PFC may occur from early seral to late seral. Desired plant community (DPC) is then determined based on management objectives through an interdiscipli-nary approach (Step 5 in Figure 3, TR 1737-15), eventually achieving the desired condition (Figure 2). Plant communities and future condition need to be balanced within a watershed(s) and within an ecoregion(s).
Figure 2. A riparian-wetland area in PFC may contain several different plant communities. A desired management condition may include several of these communities in some proportion.
When determining whether a lentic riparian-wetland area is functioning properly, it is important to determine the condition of the entire watershed. The entire water-shed can influence the quality, size, and stability of a riparian-wetland area by affecting production of sediment, water, and nutrients, influencing inundation/ saturation frequency and duration, and modifying the distribution of chemicals. When rating functionality, it will be easy to categorize many lentic riparian-wetland areas as being in PFC or nonfunctional. For others it will not be easy. Difficulty in rating PFC usually arises in identifying the thresholds that allow a riparian-wetland area to move from one category to another. Using the lentic checklist (Appendix A) helps to ensure consistency in assessing functionality.
This checklist may not answer the question of functionality for all lentic riparian-wetland areas. On occasion, ID teams will find that blending the lentic checklist with the lotic checklist is necessary to assess functionality for some riparian-wetland areas. Some areas may require a more intensive inventory, like ESI. ID teams can add elements to the lentic checklist to address unique riparian wetland attributes and processes. If an item is added, an ID team needs to make sure this addition can be quantified. Appendix C provides examples of lentic riparian-wetland areas that depict the categories of PFC, functional—at risk, and nonfunctional to further assist in assessing functionality.
As with any tool, PFC has its limits. Appendix D describes what PFC is and isn’t, and what it can and can’t do.
Riparian-Wetland Area
Desired Condition Proper Functioning Condition
Minimum threshold
Vegetative community succession
Each desired plant community (DPC) is based on management objectives and values that are determined through an interdisciplinary approach
D
P
C
D
P
C
1
2
3
4
5
D
P
C
D
P
C
D
P
C
4. Functional Rating
Following completion of the checklist, a “functional rating” is determined based on an ID team’s discussion. When determining the functional rating, it is important for the ID team to understand the type of riparian-wetland being assessed. Appendix E provides examples of some of the more common riparian-wetland types while Appendix F provides examples of some of the more complex riparian-wetland types. The ID team must review the “yes” and “no” answers on the checklist and their respective comments about the severity of the situation, then collectively agree on a rating of proper functioning condition, functional—at risk, or nonfunctional. If an ID team agrees on a functional—at risk rating, a determination of trend is then made whenever possible.
There is no set number of “no” answers that dictate whether an area is at-risk or nonfunctional. This is due to the variability in kinds of lentic riparian-wetland areas (based on differences in climatic setting, geology, landform, and substrate) and the variability in the severity of individual factors relative to an area’s ability to with-stand wind action, wave action, and overland flow. Aproperly functioning
riparian-wetland area will provide the elements contained in the definition: • dissipate energies associated with wind action, wave action, and overland
flow from adjacent sites, thereby reducing erosion and improving water quality
• filter sediment and aid floodplain development
• improve flood-water retention and ground-water recharge
• develop root masses that stabilize islands and shoreline features against cutting action
• restrict water percolation
in accordance with its capability and potential.
If a riparian-wetland area possesses these elements, then it has a high probability to withstand wind action, wave action, and overland flow events. If all the answers on the checklist are “yes,” this area is in proper functioning condition. However, if some answers on the checklist are “no,” this area may still meet the definition of PFC. The ID team reviews the “no” answers and determines if any of these answers make this riparian-wetland area susceptible to degradation from wind action, wave action, and overland flow events. If they do, the ID team would rate the area and explain why it is something less than PFC.
Afunctional—at risk riparian-wetland area will possess some or even most of the elements in the definition, but have at least one attribute/process (Table 1) that gives it a high probability of degradation with wind action, wave action, and overland flow event(s). Most of the time, several “no” answers will be evident because of the interrelationships between items. If the ID team thinks that these “no” answers col-lectively provide the probability for degradation from the events mentioned above, then the rating is functional—at risk. If there is disagreement among team members after all comments have been discussed, it is probably advisable to be conservative in the rating (i.e., if the discussion is between PFC and functional—at risk, then the
rating should be functional—at risk). One situation where only one “no” answer indicates a lentic riparian wetland area is at risk is when a structure is not accommo-dating safe passage of flows because a headcut is starting to affect the dam or spillway. The riparian-wetland above the structure is then rated as functional—at risk regardless of other factors. The prairie pothole wetland example in Appendix C provides an example of this.
Trend must be determined, if possible, when a rating of functional—at risk is given. Preferably, trend is determined by comparing the present situation with previous photos, trend studies, inventories, and any other documentation or personal knowl-edge attained in a review of existing documents or interviews prior to the PFC assessment. In the absence of information prior to the assessment, indicators of “apparent trend” may be deduced during the assessment process. Recruitment and establishment of riparian-wetland species (or the absence thereof) that indicate an increase (or decline) in soil moisture characteristics can be especially useful. However, care must be taken to relate these indicators to recent climatic conditions as well as to management. If there is insufficient evidence to make a determination that there is a trend toward PFC (upward) or away from PFC (downward), then the trend is not apparent.
Nonfunctional riparian-wetland areas clearly lack the elements listed in the PFC definition. Usually nonfunctional riparian-wetland areas translate to a preponder-ance of “no” answers on the checklist, but not necessarily all “no” answers. A riparian-wetland area may still be saturated at or near the surface or inundated in “relatively frequent” events, but be clearly nonfunctional because it lacks vegetation to protect the area from erosion and deposition. The lack of vegetation and inability to buffer the sediment being supplied greatly reduce the extent of this wetland and prevent it from recovering.
It is imperative for management interpretation of the checklist to document factors con-tributing to unacceptable conditions outside management’s control for
functional—at risk and nonfunctional ratings where achievement of PFC may be impaired. It is desirable to document any of the factors listed if they occur, even if they don’t appear to be affecting the achievement of PFC. Their presence may still affect achievement of desired condition for other values when compared to a natural system.
D. Institute the Process
1. Planning
The process established in TR 1737-15 for incorporating information into a manage-ment plan would apply to lentic riparian-wetland areas also:
Step 1 Existing Condition - Determine the existing riparian-wetland and watershed condition using the standard checklist.
Step 2 Potential - Each area is assessed relative to its potential. Determine potential by using reference areas, historic photos, etc. (ESI process).
Step 3 PFC - Determine the minimum conditions required for the area to function properly.
Step 4 Resource Values - Determine existing and potential resource values and the plant communities necessary to support these values.
Step 5 Management Goals - Identify specific objectives to reach management goals for the watershed, PFC, DPC, or DC.
Step 6 Planned Actions - Design management actions to achieve PFC and then DC.
Step 7 Monitoring - Design appropriate monitoring strategies to assess progress towards meeting management goals.
Step 8 Flexibility - Maintain management flexibility to accommodate change based upon monitoring results.
2. Management
Successful management of lentic riparian-wetland areas requires implementation of a well-conceived plan. Appropriate strategies and practices that consider the entire watershed should be used. Upland and lentic riparian-wetland areas are interrelated and cannot be managed separately.
Inferences about habitat condition can be made from the PFC assessment.
Generally, a lentic riparian-wetland area in nonfunctional condition will not provide quality habitat conditions. One that is in PFC can be expected to provide at least some quality habitat. Additionally, an area in PFC can be managed for improved habitat, if that is an objective.
The PFC assessment can be used as a tool for prioritizing either additional inventory needs or restoration activities. PFC provides a sorting that allows the establishment of priorities. Functional—at risk areas with a downward trend should receive pri-ority for treatment. These areas may be near the threshold of rapidly degrading into a nonfunctional condition. Planned actions to begin recovery can usually be imple-mented at a much lower cost in these areas. Once an area is nonfunctional, the effort, cost, and time required for recovery may dramatically increase.
Restoration of nonfunctional systems should be reserved for those situations when: • recovery is possible,
• efforts are not at the expense of at-risk systems, • or unique opportunities exist.
At the same time, areas that are functioning properly are usually not the highest pri-orities for restoration because they are more resilient than the at-risk areas. It is
crit-ical to manage PFC areas to retain their resilience and further recovery toward desired condition. Identifying systems in PFC also allows local managers to assess why these systems have fared well in the past and to possibly use them as models for recovery of similar systems.
The PFC assessment can also help determine the appropriate timing and design of riparian-wetland restoration projects (including structural and management changes). It can identify situations where structures are either entirely inappropriate or premature. The results of the PFC assessment can be used in watershed analysis. While the methodology and resultant data are site-specific, the ratings can be aggregated and analyzed at the watershed scale. The PFC method is most useful when condition is determined based on local information, experience, and knowledge of functions and processes at the watershed scale. Information from the PFC assessment, along with other watershed and habitat condition information, helps provide a good picture of watershed health and the possible causal factors affecting watershed health. Using the PFC method will help to identify watershed-scale problems and suggest manage-ment remedies and priorities. These management decisions are derived by concen-trating on the “no” answers on the checklist. Additional uses for this information can be found in TR 1737-15, Appendix E.
There are other documents that can be helpful in assisting with this process: BLM’s TR 1737-14, Grazing Management for Riparian-Wetland Areas (Leonard et al. 1997), provides grazing management principles, concepts, and practices that have been effective in improving and maintaining desired conditions on riparian-wetland areas, and Prescribed Grazing (USDA NRCS Field Office Technical Guide, Section IV, Practice No. 528) provides guidance for establishing grazing management plans. For other forms of management, such as recreation development, mining opportuni-ties, timber practices, and watershed treatments, BLM’s TR 1737-6, Management Techniques in Riparian Areas (Smith and Prichard 1992), provides suggested prac-tices. With a change in management, most riparian-wetland areas can achieve PFC in a few years, but some will take many years to achieve the identified DPC or advanced ecological status.
3. Monitoring
Management effectiveness and progress can be assessed and documented with moni-toring. A good monitoring plan, including a schedule for field visits and the protocol to be used, must be developed as a part of the management plan. For monitoring to be effective, field sites must be revisited on a scheduled basis. Monitoring reflects trends and will show whether the planned objectives are being achieved.
A number of references are available to help when developing monitoring plans. Inventory and Monitoring of Riparian Areas, BLM TR 1737-3 (Myers 1989), provides guidance. The Integrated Riparian Evaluation Guide (USDA FS 1992) provides some specific protocols that can be used for monitoring riparian-wetland areas. The National Range and Pasture Handbook (USDA NRCS 1998c) provides general guidance for rangeland monitoring, which can also be used for riparian-wetland area monitoring.
V. Quantification of Checklist Items
As long as the procedure is followed and the definitions are understood, the PFC assessment will work for most sites because it was developed from rigorous science (ESI) and is performed by a trained and experienced ID team. However, there will be times when items from the checklist need to be quantified.
There is a considerable body of literature addressing relationships between soils, vegetation, hydrology, and other riparian-wetland functions, as well as a growing number of “success stories” from which empirical comparisons can (and have) been made. The references presented here are selected as examples of supporting docu-mentation for the PFC assessment. By no means are these references
all-encompassing, as there are many other ways to quantify these items.
The checklist items are designed to address the common attributes and processes that have to be in working order for a lentic riparian-wetland area to function prop-erly. Each item on the checklist is answered with a “yes,” meaning that the attribute or process is working, a “no,” meaning that it is not working, or an “N/A,” meaning the item is not applicable to that particular area. For any item marked “no,” the severity of the condition must be explained in the “Remarks” section and must be discussed by the ID team in determining riparian-wetland functionality. Using the “Remarks” section to also explain items marked “yes” is encouraged but not required.
The intent of each checklist item, examples of how each item might be answered, and ways to quantify each item are outlined below. These examples should not be misconstrued as a cookbook, as there are many riparian-wetland types. Before assessing condition of any riparian wetland area, its attributes and processes have to be defined to answer the checklist items correctly.
It is important to note that many of the checklist items are closely related. This pro-vides a system of checks and balances for how any one item is answered. For example, if item 6 (natural surface or subsurface flow patterns are not altered by dis-turbance) is answered “yes” for a recovering system, item 1 should be answered “yes” because the riparian-wetland area is being saturated or inundated in relatively frequent events. It is also important to note the items are numbered for the purpose of cataloging comments and that the numbers do not declare importance. The importance of any one item will vary relative to a riparian-wetland area’s attributes and processes. However, there is an order to when some of the items are answered “yes.” Any time item 13 is answered “yes,” more than likely items 8, 9, 10, and 11 will be answered “yes.” For a riparian-wetland area to recover or be maintained, the right plants have to establish themselves and then produce the adequate amount of cover. The supporting science for some of the items is the same or overlapping. Explanations are with the most appropriate items, but some cross-referencing may be required.
A. Hydrology
Hydrologic attributes and processes are addressed in this section relative to presence and function. The term “wetland hydrology” encompasses all hydrologic character-istics of lentic areas that are periodically inundated or have soils saturated to the sur-face at some time during the growing season. Areas with evident characteristics of wetland hydrology are those where the presence of water has an overriding influence on characteristics of vegetation and soils due to anaerobic and reducing conditions, respectively. Such characteristics are usually present in areas that are inundated or saturated to the surface for sufficient duration to develop hydric soils and support vegetation typically adapted for life in periodically anaerobic soil conditions. Hydrology is often the least exact of the parameters, and indicators of wetland hydrology are sometimes difficult to identify in the field. However, it is essential to establish that a wetland area is periodically inundated or has saturated soils during the growing season (Prichard et al. 1994).
The Federal Government’s standard for classifying wetlands is described in Cowardin et al. (1979), which is available on the Internet at http://www.nwi.fws.gov. This system provides ecological and hydrological information for the identification, classi-fication, and mapping of wetlands and deepwater habitats in the United States and its territories. The standard was selected by the Federal Geographic Data Committee in 1996. Systems are the highest level of the classification hierarchy; five are defined— marine, estuarine, riverine, lacustrine, and palustrine. Systems are further divided by subsystems and classes. Water regime, water chemistry, and soil modifiers are used at the class level to further describe wetlands. For riverine systems, the process for assessing PFC for lotic systems should be used (TR 1737-15). Palustrine wetlands that are periodically inundated from overbank flows may occur adjacent to riverine systems, but are not included as part of the riverine system. In those cases, and in others where a mixture of lotic and lentic systems occur, both the lotic and lentic PFC definitions and checklist questions should be examined in order to understand the important attributes and processes of those systems.
BLM’s TR 1737-7 (Leonard et al. 1992a) details field procedures for describing and documenting site information (ESI) as it applies to the interaction of soils,
hydrology, and vegetation for riparian-wetland resources and uplands. This method is a rigorous science base for classifying riparian-wetland sites and the quantitative measures used in ESI can be used for items 1-7 in the hydrology section of the checklist.
References associated with the hydrogeomorphic model (HGM) (Brinson 1993; Smith et al. 1995; Brinson et al. 1995; and Walton et al. 1995) describe another approach for assessing wetland functions that could also be used for items 1-7 in the hydrology section. The HGM approach includes a development and application phase. In the development phase, wetlands are classified into regional subclasses based on hydrogeomorphic factors. A functional profile is developed to describe the characteristics of the regional subclass, identify the functions that are most likely to be performed, and discuss the characteristics that influence how those functions are
performed. Reference wetlands are selected to represent the range of variability exhibited by the regional subclass in a reference domain, and assessment models are constructed and calibrated by an ID team based on reference standards and data from reference wetlands. Reference standards are the conditions exhibited by the undisturbed, or least disturbed, wetlands and landscapes in the reference domain. The functional indices resulting from the assessment models provide a measure of the capacity of a wetland to perform functions relative to other wetlands in the regional subclass. The application phase of the approach or assessment procedure includes characterizing the wetland, assessing its functions, analyzing the results of the assessment, and applying them to a specific project (Smith et al. 1995).
Item 1: Riparian-wetland area is saturated at or near the surface or inundated in “relatively frequent” events
Purpose
Water creates and maintains all wetlands. Cowardin et al. (1979) state, “In general terms, wetlands are lands where saturation with water is the dominant factor deter-mining the nature of soil development and the types of plant and animal communi-ties living in the soil and on its surface.” The purpose of item 1 is to document that inundation or saturation is long enough in duration and occurs frequently enough to maintain wetland characteristics.
Examples
Item 1 would be answered “yes” if evidence of inundation or saturation, such as hydric soils, standing water, or recent deposits of sediment and/or debris on the floodplain from overbank flows, is apparent. Another indicator for a “yes” answer would be if obligate wetland (OBL) species and/or facultative wetland (FACW) species dominate a site. Additional information on how vegetation is used as a wet-land indicator is provided in the vegetation section.
Item 1 would be answered “no” if the evidence of saturation or inundation is less than in the past. One indicator of this may be where obligate upland (UPL) and fac-ultative upland (FACU) species are encroaching on OBL and FACW species, indi-cating a loss of hydrology. Another indicator is a soil with hydric properties, which presently lacks periods of inundation or saturation.
There is a strong relationship between item 1 and items 3, 6, 10, and 17. If item 1 is answered “no,” then these items will usually be answered “no” also.
Supporting Science/Quantitative Methodologies
Even though the factors influencing the wetness of an area are numerous (e.g., pre-cipitation, topography, soil characteristics, plant cover, ground water), all lentic sites have a source of water consistent enough to cause anaerobic (no oxygen) and
source of water for riparian-wetland areas may be precipitation, runoff, flooding, tidal influence, ground water, or some combination of sources.
Inundation or saturation must occur often enough (frequency) and long enough (duration) to develop and maintain the anaerobic and reducing conditions. Both “measurements” and “field observations” are helpful to document that saturation or inundation is occurring in the “relatively frequent” events within the potential or capability of the site. Local knowledge and historical records should be used as much as possible, especially where problem wetlands are concerned. If a jurisdic-tional wetland determination is made, the U.S. Army Corps of Engineers (COE) 1987 Wetlands Delineation Manual should be consulted for information on the cri-teria, primary indicators, and secondary indicators necessary to meet the wetland hydrology, soils, and vegetation requirements. However, within the context of PFC, riparian-wetland areas are broadly defined to include nonjurisdictional types that do not meet the hydric soils or wetland hydrology definition in U.S. Army COE (1987) or the Clean Water Act.
Where available, hydrology data from local soil surveys should be used in conjunc-tion with recorded data. Gage data, such as lake, tidal, ground water, and stream stage, along with precipitation data, are available from different sources, depending on the location. These sources include the U.S. Geological Survey (USGS); COE District Offices; Bureau of Reclamation (BOR); NRCS; Tennessee Valley Authority (TVA); National Oceanic and Atmospheric Administration (NOAA); Highway Departments; and other State, County, and local agencies.
USDA NRCS (1997) describes a nine-step process for using stream and lake gages to document the timing, duration, and frequency of inundation adjacent to streams and lakes. At least 10 years of gage data during the growing season are needed. The highest stage of each year that is exceeded for a predetermined duration is deter-mined. If the inundation criterion is 7 days, the lowest stage occurring during those 7 days of high flow is recorded. The median recorded stage readings are tabulated in descending order, and the median value computed. Any land in the immediate vicinity of the gage below this median elevation would be inundated for the inunda-tion criterion by out-of bank flooding during the growing season in 50 percent of the years, thus meeting the wetland criterion.
Few riparian-wetland areas have sufficient existing information on ground-water con-ditions or wells for mapping the water table, so it may be necessary to install well points. Well points are small-diameter (1-1/4- to 3-inch) metal or PVC well casings with short screened intervals to allow water to flow into the casings. The COE has installation procedures for placing monitoring wells in wetlands (Sprecher 1993). The NRCS state geologist or hydraulic engineer can also provide information on specifications for installing, casing, and sealing wells; taking and recording measure-ments; and local regulations concerning well development (USDA NRCS 1997). Existing wells were likely drilled into the regional aquifer for water supply, and the water level might not be representative of the shallow ground-water conditions that
support the riparian wetland area of interest. Using information from both nearby existing wells and installed well points helps an ID team to determine whether the riparian-wetland area is the result of a perched aquifer or is hydraulically connected to a regional system. This information is crucial for determination of regional versus local effects. Details on well depth, screened interval, and date of drilling for many wells are available from the USGS Water Resources Division. Well informa-tion for many wells drilled on public land and assistance in designing/planning ground-water monitoring projects can be obtained from BLM’s National Applied Resource Sciences Center.
Aerial photographs are useful for documenting evidence and extent of wetland inundation or soil saturation (Clemmer 1994; Prichard et al. 1996). Comparing sev-eral years of photos will help in interpreting the effect of very dry or very wet periods. Acquiring photos taken during similar seasons or months will provide a more accurate comparison. Photography can also assist in preliminary identification of lentic sites for further field investigation based on the spectral response of local-ized vegetation around the site.
USDA NRCS (1997) describes a method using annual rainfall data and aerial pho-tographs to document wetland hydrology. The annual rainfall total for each year is compared to the annual boundaries for wet and dry from the WETS table (see
www.wcc.nrcs.usda.govand click on climate for WETS table and associated docu-mentation). The WETS table identifies the boundary where 3 in 10 of the precipita-tion amounts are wetter than normal value and the boundary where 3 in 10 values are drier than normal. Normal is considered to be values that fall between these two boundaries. Aerial photographs from years of average precipitation are compared with aerial photographs from wet years and dry years. If a wet signature appears for a site only in wet years, a good probability exists that wetland hydrology is not pre-sent under normal circumstances. If a wet signature is seen in both dry and wet years, the site may well meet wetland hydrology criteria. Where the wet signatures appear in wet and normal years, further study is needed to determine whether wet-land hydrology exists on the site.
While recorded data can provide valuable information, field observations are also important. There are a number of hydrologic indicators that can be observed in the field:
• Inundation. Seasonal conditions and recent weather conditions should be considered. Surveyed cross sections can be used to document the elevation of high water. Harrelson et al. (1994) is a good reference for surveying basics and surveying cross sections.
• Soil saturation. Digging a soil pit to a depth of 16 inches and observing the water level in the hole after sufficient time has been allowed for water to drain into the hole will indicate soil saturation. The time required varies depending on the soil texture. In some cases, the depth to the water table (or upper level at which water is flowing into the pit) can be observed by
examining the wall of the hole. Because of the capillary fringe, saturated soils will be nearer the surface (U.S. Army COE 1987).
Using an auger hole to confirm saturation may be inaccurate or misleading in clayey soils when only macropores are filled with water. Macropores may have filled during a recent rain while the soil matrix remained unsaturated. Tightly sealed piezometers or tensiometers are recommended to confirm sat-uration. These instruments should be sealed with clay (e.g., bentonite) to prevent surface water from running down the sides of the instruments (Vepraskas 1994).
There are hydric soils indicators that will show that wetland hydrology is present or has been present at some time. Histosols, Histic Epipedon, Black Histic, Hydrogen Sulfide Odor are usually saturated or inundated for much of most years for soil of all textures. Sandy Gleyed Matrix, Polyvalue Below Surface, Thin Dark Surface are the wetter hydric soil indicators for soil with sand or loamy sand soil textures. Loamy Gleyed Matrix, Thick Dark Surface are the hydric soil indicators for wetter soils of soil textures of sandy loam, sandy clay loam, clay loam, loam, silt loam, silty clay loam, sandy clay, and clay. While soils with all other hydric indicators will require a shorter dura-tion of saturadura-tion or inundadura-tion, they will still have or have had wetland hydrology. See item 17 for more information on hydric soils.
Steel rods (rebar) can also be used to measure the depth to the water table in a wetland (Brigdham et al. 1991). Rebar is pounded into the wetland soil. The oxidation/reduction process that occurs during saturation will change the color of the steel rod and can be measured to indicate the depth to water table.
• Watermarks. Watermarks can be observed on fixed objects, such as woody vegetation, bridge pillars, fences, bedrock, or boulders.
• Drift lines. Evidence consists of linear deposition of debris or debris entangled in fixed objects such as vegetation. Debris is usually deposited parallel to the direction of water flow and provides an indication of the minimum portion of the area inundated during a flooding event.
• Sediment deposits (mineral or organic). Sediment deposition on vegetation and other objects provides an indication of the minimum inundation level. • Drainage patterns(surface evidence of drainage flow into or through an
area). Evidence consists of drainage patterns eroded into the soil, debris oriented perpendicular to the direction of water flow, or the absence of leaf litter. Scouring is often evident around roots of persistent vegetation. Because drainage patterns also occur on upland areas (i.e., ephemeral channels), topographic position must also be considered.
• Oxidized rhizospheres(zone of soil where living plant root and
microorganisms occur). These are associated with living plant roots in the upper 12 inches of the soil.
• Water-stained leaves(works better in the eastern United States than in the western United States). Water stains on leaf litter indicate areas that have been inundated with water.
• Vegetation. Vegetation can be a useful indicator that an area is being saturated near the surface or inundated often enough. Existing vegetation needs to be compared against the potential for the site using an ecological site description, vegetation classification, or similar reference. When riparian-wetland species are not clearly dominant on a site, the FAC-neutral test (U.S. Army COE 1987) can be used and compared to the potential. • Soil Survey Data. This data provides climatic information, soil
classifications, and wetness characteristics of soils, such as frequency, duration, and timing of inundation.
Indicators above are mostly from the U.S. Army COE 1987 Wetland Delineation Manual. For nonjurisdictional riparian-wetland areas, the water table and wetland soil criteria may occur at a greater depth.
Item 2: Fluctuation of water levels is not excessive
Purpose
Riparian-wetland vegetation plays an important role in the stability of most lentic riparian-wetland areas. Periodic flooding or saturation of these areas is necessary to promote and sustain this vegetation, but to do so, these water level changes must be within the range of plant tolerance. The purpose of item 2 is to determine if these water level changes are within the limits that will sustain the riparian-wetland vegetation.
Examples
Most lentic riparian-wetland areas require vegetation to function properly. The veg-etation on these sites for the most part should be OBL and/or FACW species. If a riparian-wetland area is dominated by OBL and/or FACW species, the answer to item 2 would be “yes.” However, some lentic riparian-wetland areas only have the potential to produce facultative (FAC) species (see Appendix F). The answer to item 2 would be “yes” if these sites are dominated by FAC species. There are some sites that only produce OBL, FACW, FAC species during wet years and are dominated by UPL species during dry years (see Appendix F). The answer to item 2 would be “yes” if these sites are producing OBL, FACW, or FAC species during wet years even though they are dominated by UPL species during dry years, as this is the norm (see playa wetland example from New Mexico in Appendix B). Understanding the potential of the site is critical in order to answer the question correctly.
Item 2 would be answered “no” if bare soil or annual UPL species are present in place of OBL and FACW species as a result of changes in the water level. An example of this is a reservoir with constantly fluctuating water levels resulting in a zone of no vegetation. Other wetlands can also experience this if water is removed or added on an irregular basis. Natural systems will occasionally experience this as a result of irregular water fluctuation. Again, understanding site potential is crucial in these situations.
“N/A” would apply for those wetland types that do not require riparian-wetland vegetation to function properly.
There is a strong relationship between item 3 and items 1, 10, 12, and 17. If item 3 is answered “no,” then these items will often be answered “no” as well.
Supporting Science/Quantitative Methodologies
Riparian-wetland plants living along the edges of standing water bodies have
adapted so that during drying periods, as long as water levels do not drop drastically, the plants will expand and occupy the newly exposed sites. During wetter periods, as the water body fills up again, some plants may be drowned out around the edges. If the elevation of the water level changes faster than the plants can respond, a “bathtub ring” effect occurs where riparian-wetland plants cannot survive, leaving bare ground. Excessive ground-water fluctuations or the combination of excessive ground-water and surface-water changes can cause similar vegetation effects. The “bathtub ring” effect is very obvious on aerial photos.
The recorded data discussed in item 1 can be used to document water level changes for this item (i.e., lake gage data). Comparing the rate of fill and the rate of with-drawal with similar systems in the region will help determine whether the water fluctuation is appropriate because of site potential or is a problem accelerated by some human-caused disturbance.
Item 3: Riparian-wetland area is enlarging or has achieved potential extent
Purpose
Depending on a lentic area’s site characteristics, degradation can lead either to accel-erated sedimentation (filling in faster) or to loss or lowering of the water table. Either process has a detrimental effect on the riparian-wetland vegetation. Some riparian-wetland areas initially appear to be enlarging as they fill in. Deposition around shorelines provides more shallow water area for emergent vegetation. However, over the long-term, there is a decrease in extent as the circumference shrinks with declining catchment capacity. A loss or lowering of the water table can result in water stress (loss of vigor), lowered production, and eventually a complete loss of riparian-wetland vegetation. Recovery is expressed by an increase in wetland vegetation. The purpose of item 3 is to determine if a riparian-wetland area is recovering or has recovered.
Item 3 addresses two situations, enlarging or achieving potential extent, in order that a “yes” answer is always applied for a positive attribute or process.
Examples
Evidence that a riparian-wetland area is widening/enlarging may include an increase in the amount of appropriate vegetation (i.e., sedges, rushes, willows) that is
replacing upland species, a rising water table, and the establishment of riparian-wetland vegetation in soils deposited along a shoreline/soil surface. Any of this evidence would result in a “yes” answer for item 3.
Potential extent can be largely determined by the adjacent topography (e.g., valley bottom width). If a riparian-wetland area has achieved potential extent, the answer to item 3 would be “yes.”
Evidence that a riparian-wetland area is shrinking in extent may include an increase in upland vegetation (e.g., sagebrush, rabbitbrush, cheatgrass) and replacement of riparian-wetland species, such as sedges and rushes, with more drought-tolerant species, such as Kentucky bluegrass, western wheatgrass, and cheatgrass (especially on small raised areas). Any of this evidence would result in a “no” answer for item 3. The age of these nonwetland plants should be noted to determine the apparent trend. If they are old and the wetland species present are young and vigorous, the area may be enlarging rather than shrinking.
For areas where there is no potential for vegetation, an “N/A” answer would be given, as landform dictates functionality.
There is a strong relationship between item 3 and items 1, 10, 12, and 17. If item 3 is answered “no,” then these items will often be answered “no” as well.
Supporting Science/Quantitative Methodologies
The presence of hydric soil and riparian-wetland vegetation are indicators of soil moisture conditions and water table. Soils and vegetation are key in delineating the extent of riparian wetland areas. Some hydric soil indicators, such as redoximorphic features, can persist in the soil even after a water table drops, indicating that the extent of a riparian-wetland area has been reduced. Change in composition from upland species like sagebrush to riparian-wetland species like Nebraska sedge is a good indicator that the riparian-wetland area is widening.
Where available, original survey notes should be obtained. Often the original sur-veyors made notes about the riparian-wetland areas they saw, and their observations can be very helpful in comparing a site with current riparian-wetland extent.
Aerial photos are a great tool for documenting change over time in riparian-wetland area acreages (Clemmer 1994; Prichard et al. 1996). The National Aerial
Photography Program (NAPP) provides coverage of the lower 48 states every 5 to 7 years. Some shrinking and expansion of riparian-wetland areas can be associated
with climate fluctuation. However, there may be a time lag for areas that are depen-dent on ground-water recharge.
To measure riparian-wetland extent in the field, several transects for soils and vege-tation information should be established perpendicular to the down valley axis of the riparian complex. For soils, standard identification and delineation procedures (USDA NRCS 1998b and other NRCS soils manuals and handbooks; U.S. Army COE 1987) should be used. Vegetation community complex composition can be assessed using a line intercept transect (USDA FS 1992). Additional detail is
included in the supporting science for the vegetation section (the questions are inter-related).
Monitoring wells discussed in item 1 can also be used to measure the expansion or contraction of a riparian-wetland.
Item 4: Upland watershed is not contributing to riparian-wetland degradation
Purpose
The condition of the surrounding uplands can greatly affect the condition of a riparian-wetland area. Changes in upland condition can influence the magnitude, timing, or duration of overland flow events, which in turn can affect a riparian-wetland area. The purpose of item 4 is to determine if there has been a change in the water or sediment being supplied to a riparian-wetland area, and whether it is resulting in degradation. Although a correlation can exist, the focus here is on whether uplands are or are not contributing to degradation, and not on the condition of the uplands.
Examples
It is possible to have disturbances in the uplands and still not see major changes in magnitude, timing, or duration of overland flows having a negative impact on riparian-wetland areas. If there is no evidence of erosion deposits from the uplands that are degrading a riparian-wetland area, the answer to item 4 is “yes,” even if the uplands are not in good condition.
Evidence that a riparian-wetland area is being degraded could include the formation of a large delta or sediment plumph where the overland flow enters a riparian-wetland, indicating that the water and sediment are not in balance with the watershed (see item 19). If this characteristic is present, the answer to item 4 would be “no.” Item 4 will never be answered “N/A;” it will always have a “yes” or “no” answer. There is a strong relationship between item 4 and item 19. If item 4 is answered “no,” then item 19 will usually be answered “no” also.
Supporting Science/Quantitative Methodologies
The watershed surrounding a riparian-wetland area can influence the hydrologic regime, water quality, sediment supply, and plant community composition. Water quality is discussed in item 5, and plant community composition is discussed in the vegetation section.
The hydrologic functions of riparian-wetland areas are governed by a water budget and a sediment budget. Depending on the type of riparian-wetland area, water enters a wetland as precipitation, incoming channel flow, overbank flow, overland flow from adjacent slopes, ground-water discharge, or some combination of these. Water is stored in a wetland as surface and subsurface storage, and is lost as runoff, evapora-tion/transpiration, and/or ground-water recharge. Sediments are deposited in a wetland from bedload, filtered from surface runoff, or precipitated from dissolved minerals in runoff and ground-water flows, and are lost through erosion (Zeedyk 1996). When a natural system is in dynamic equilibrium, it maintains a level of stability that permits internal adjustments of variables without producing rapid changes to the system. Detrimental changes in water supply come from constraining or diverting surface and/or subsurface flows. An example would be upslope road ditches and cross drainage structures installed in a manner that concentrates overland flows away from the riparian-wetland area, causing desiccation of meadow soils (Zeedyk 1996). If human disturbance in a watershed increases the sediment delivery to a riparian-wetland area, the progression of states can be accelerated (Figure 3).
Aerial photos that cover several years or decades can be used to identify riparian-wetland adjustments through time for a particular riparian-riparian-wetland complex.
Information on the use of aerial photos is provided in Clemmer (1994) and Prichard et al. (1996). Most of the photo interpretive techniques and procedures described in Prichard et al. (1996) for lotic sites can be applied to lentic sites.
A simplified method for analyzing a wetlands water budget and determining the rel-ative importance of hydrologic and hydraulic processes is described in Walton et al. (1995). The processes can be based on the following balance equation:
Qi+ R + G = Qo+ ET + I where
Qi= surface water flow into the system R = direct rainfall on the wetland
G = ground-water discharge to the wetland Qo= surface water flow out of the system ET = evapotranspiration from the wetland I = infiltration to the ground water.