Exploring the Hidden Challenges Associated with
the Evaluation of Multi-class Datasets using Multiple
Classifiers
Shamaila Iram, Dhiya Al-Jumeily, Paul Fergus, Abir Hussain
Applied Computing Research Group,School of Computing and Mathematical Sciences, Liverpool John Moores University,
Byrom Street, L3 3AF, UK.
[email protected], D.Aljumeily, P.Fergus, A.Hussain @ljmu.ac.uk Abstract – The optimization and evaluation of a pattern
recognition system requires different problems like multi-class and imbalanced datasets be addressed. This paper presents the classification of multi-class datasets which present more challenges when compare to binary class datasets in machine learning. Furthermore, it argues that the performance evaluation of a classification model for multi-class imbalanced datasets in terms of simple “accuracy rate” can possibly provide misleading results. Other parameters such as failure avoidance, true identification of positive and negative instances of a class and class discrimination are also very important. We, in this paper, hypothesize that “misclassification of true positive patterns should not necessarily be categorized as false negative while evaluating a classifier for multi-class datasets”, a common practice that has been observed in the existing literature. In order to address these hidden challenges for the generalization of a particular classifier, several evaluation metrics are compared for a multi-class dataset with four classes; three of them belong to different neurodegenerative diseases and one to control subjects. Three classifiers, linear discriminant, quadratic discriminant and Parzen are selected to demonstrate the results with examples.
Index Terms— Classifier evaluation; multi-class dataset; pattern recognition; neurodegenerative diseases; multiple classifiers
I. INTRODUCTION
There are several ways to evaluate the performance of learning algorithms. Most often, the evaluation is based on a
confusion matrix to represent the results in terms of accuracy
and a classifier’s ability to correctly and incorrectly classified instances of a class [1].
This evaluation technique becomes more complex and intricate when multi-class pattern recognition is required. This is because the continuous growth of biomedical data has largely deteriorated the performance and accuracy of many evaluation techniques [2]. These problems are largely seen in our modern life, for instance, web page classification [3], web spam detection [4], and medical diagnosis [5], [6]. Some of the other fields that involve the analysis of enormous multi-class datasets are mobile commerce [7], bankruptcy or credit detection [8], fraud detection, and crime activity analysis.
Moreover, with the traditional empirical measure,
“accuracy rate”, it is difficult to distinguish patterns in
multi-class datasets. For instance, mismulti-classification of true positive
instances should not necessarily be considered a false negative
when a multiclass dataset is being evaluated. More specifically, multi-class datasets offer more complexities and challenges while ranking the reliability of a particular classification model. This paper discusses some of these challenges when multi-class dataset are evaluated.
To demonstrate the uncertainty among results, a 4-class dataset has been selected which belongs to neurodegenerative diseases (NDDs) and control subjects, as a case study. NDDs is an umbrella term used to describe medical conditions that directly affect the neurons within the brain [9]. These include Parkinson’s disease (PD), Alzheimer’s disease (AD), Huntington disease (HD), and Amyotrophic Lateral Sclerosis (ALS) among others. Patients suffering with these kinds of disease, experience a cognitive decline over a long period and symptoms include gait abnormalities, problems with speech, and memory loss due to progressive cognitive deterioration [10]. Analysing gait signals to recognize relevant patterns and correlations with specific neurodegenerative diseases is one of the most challenging tasks that will be considered in this paper using various evaluation techniques. This research work is an extension of previous published work [11], [12], which discussed the classification of gait patterns in neurodegenerative diseases and their relationship with brain activity. A set of 11 well-known classifiers on a dataset of healthy and sick persons is considered. Three classifiers have performed comparatively better than the remaining eight and are used to discuss classification accuracy, Precision, Recall, Sensitivity, Specificity, F-Measure, ROC and Reject Curves [13],[1].
This paper highlights the shortcomings and weaknesses of existing evaluation techniques to evaluate the performance of multi-class datasets. The main idea is to bring forward those attributes that are important to generalize the performance of a particular classification model and to provide a future research direction in this regard. Moreover, it also presents an overview of well-known evaluation measure for multi-class dataset with multiple classifiers.
The rest of the paper is structures as follow; Section II describes the hidden challenges that should be address in multi-class pattern recognition. Section III lists the features that are used for classification, followed by the description of classification models that are used for simulation in Section IV. Section V narrates commonly used classifier evaluation measures and their results on a multi-class dataset while the results are discussed in Section VI with conclusion.
II. CHALLENGESWITHMULTI-CLASSSKEWED
DATASETSEVALUATION
Evaluation of a classifier is considered important for making decisions in data mining [14]. There are many classifier performance metrics that claim to be better than other evaluation techniques [13]. One particular performance measure may evaluate a classifier from a single perspective and often fail to measure others [15]. Consequently, there is no single rule that successfully covers all performance issues regarding a classifier’s evaluation.
In practice, there are several multi-class domains that belong to real world applications [16]. For instance, text categorization, and protein fold classification where a protein may retain more than one subcellular locations [17], [18], [19]
etc. These multiclass datasets pose new challenges compared to simple two-class problems. Zhou et al. [20] argue that handling multi-class datasets is much harder than handling two-class problem domains. Furthermore, almost all classifier evaluation techniques are designed for two-class problems that cannot be used in multi-class problems. They are less affective and in some cases show negative impact on multi-class data evaluations.
Furthermore, learning from skewed dataset distributions, where one class has more subjects (majority class) as compare to the other class (minority class) produce misleading results [21], [22], [14]. In this case the classification model becomes more sensitive to recognize the majority class patterns as compare to the minority class patterns. These kinds of results ultimately cause more destruction if data comes from real time environments, such as biomedical, genetics, radar signals, intrusion detection, risk management and credit card scoring [23], [24]. Especially, in the field of bioinformatics where patient’s class usually has less data as compare to the class of control subjects [25].
Instead of providing comprehensive solutions for multi-class imbalanced datasets, most attention in the literature focuses on class decomposition [26]. In this case (K>2) class problems are solved by generating all possible pairwise binary class classifiers between K classes [19]. Eventually, the final
decision of a class is made by following one-against-all or by one-vs.-others rule [27]. This approach does not provide the desired output because votes of the correct class are randomly distributed among other classes due to imbalanced distributions. Moreover, results derived from sub-classes can cause potential classification errors [28, 29].
Compounding the problem further, in the realm of all the issues related to classifier evaluation, existing evaluation measures do not fully explain the hidden facts of the results. A common practice that has been considered to generalize the reliability of a classifier is accuracy rate; this offers serious shortcomings because it does not take misclassification cost into consideration [15]. This paper argues that while evaluating a multi-class dataset, results could not simply be presented in terms of true class identification. Further investigations are important to identify the mislabelling of a single instance and its final class decision before concluding the authentication of a particular classifier.
III. DATASETSANDDATAPREPROCESSING
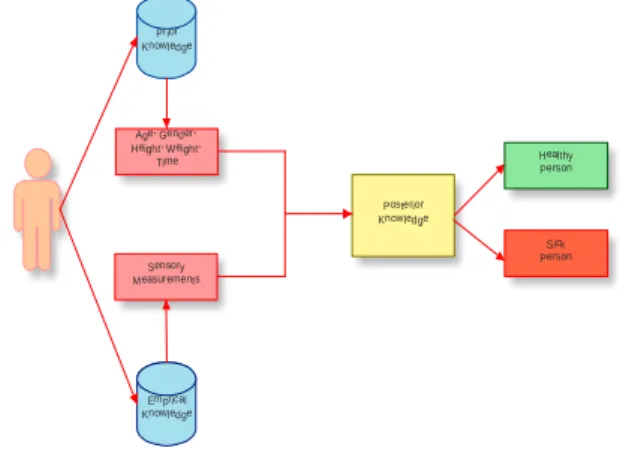
The dataset is a collection of prior knowledge (age, gender, height, weight, BMI, walking speed and time) with empirical knowledge (sensory measurements for right and left foot signals) to get a posterior knowledge to recognize gait patterns of a disease as shown in the Figure 1.
Figure 1: Extraction of Posterior Knowledge from Prior and Empirical Knowledge
Table I shows a set of eight (8) features that are used as an input for classification. We have a dataset of right and left feet gait signal values for control subjects and those that are sick. Within the dataset other clinical information for each subject, including age, gender, height, weight, walking speed, disease severity or duration and BMI are considered to improve the accuracy and reliability of the classification results. Additional
TABLE I:ASET OF EIGHT FEATURES USED FOR CLASSIFICATION
Right Feet Signals
Left Feet Signals
Age Height Weight Time Walking
Speed BMI Motion Vectors in Millisecond Motion Vectors in Millisecond 20-80 (Years) 1.57-2.13 (Meters) 40.82-117.5 (Kg) 10 Sec 0.5-1.82 (m/sec) 14.4-37.1 (weight(kg) / height²(m²)) Sensory Measurements Posterior Knowledge Age, Gender, Height, Weight, Time Prior Knowledge Emprical Knowledge Healthy Person Sick Person
data is simulated to solve the problem of skewed datasets
(Oversampling for the minority class where we, at first,
determine the maximum and minimum values of each feature set and then randomly generate more data between these two data points for the minority class [12]). The resulting dataset is an 80x8 matrix where we have 20 subjects in each class.
IV. CLASSIFIERS AND THEIR IMPLEMENTATION
Using the defined feature set, eleven classifiers have been implemented for a comparison of evaluation techniques. The principle goal is to use classifiers that perform the best. The classifiers considered are the Linear Discriminant Classifier (ldc), Quadratic Discriminant Classifier (qdc) and the Quadratic Bayes Normal Classifier (udc) based on Bayes Normal classification. For Linear Classification, an additional four classifiers are selected, that are Logistic linear (loglc), Fisher’s (fisherc), Nearest Means (nmc) and the Polynomial (polyc). A linear classifier predicts the class labels based on a weighted linear combination of features or the pre-defined variables. The Parzen (parzenc), Decision Tree (treec), Support Vector Machine (svc) and k-Nearest Neighbour (knnc) classifiers have been selected for non-linear classification of our datasets.
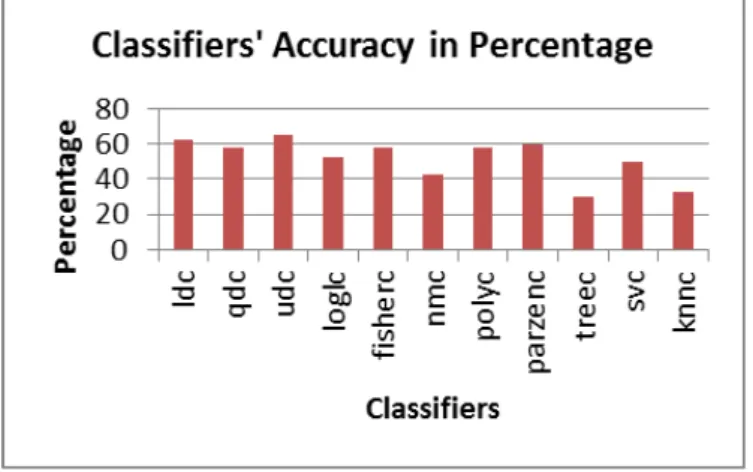
The results produced by all eleven classifiers are illustrated in Figure 2. These results were evaluated using a confusion matrix table to determine the performance of each classifier. In this instance, the Confusion Matrix technique was used to determine the distribution of errors across all classes.
Figure 2: Classification Accuracy for 11 classifiers
Three classifiers that have given comparatively better results are selected for a comparison of evaluation techniques. Those classifiers are Bayes Quadratic classifier (udc), Linear Discriminant Classifier (ldc) and Parzen Classifier (parzenc) with accuracies of 65%, 62.5%, and 60% respectively.
V. CLASSIFIERPERFORMANCEMETRICS
The performance evaluation of a classifier is mostly done by a parameter called the decision threshold, t (0 ≤ t ≤ 1), which decides the final class membership of a given object [13, 30]. A class with a higher posterior probability of this
threshold is assigned to a particular object. This threshold value may vary for imbalanced and multiclass datasets.
Two different kinds of measures are used to compare the performance evaluation results of all these classifiers:
1. Visualization: representing the possible outcome of
true and false values of a classifier in the form of graphs; Reject and ROC curves
2. Statistical Analysis: to compare the evaluation
results by mathematical formulas such as classification accuracy (Confusion Matrix), Precision, Recall, Sensitivity, Specificity and F-Measure
Here is a brief description of the above mentioned performance evaluation measures that have been articulated in this research work.
A. Confusion Matrix
The Confusion Matrix determines the distribution of errors across all classes [31]. The estimate of the classifier is calculated as the trace of the matrix divided by the total number of entries.
𝐶𝐶𝐶𝐶𝐶𝐶𝐶𝐶𝐶𝐶𝐶𝐶𝐶𝐶𝐶𝐶𝐶𝐶 𝑀𝑀𝑀𝑀𝑀𝑀𝑀𝑀𝐶𝐶𝑀𝑀 =𝑇𝑇𝑇𝑇+𝐹𝐹𝑇𝑇+𝑇𝑇𝑇𝑇+𝐹𝐹𝑇𝑇𝑇𝑇𝑇𝑇+𝑇𝑇𝑇𝑇 (1)
B. Precision
Precision is a function of true positive values and the objects that are misclassified as positive i.e. false positive.
𝑃𝑃𝑀𝑀𝑃𝑃𝑃𝑃𝐶𝐶𝐶𝐶𝐶𝐶𝐶𝐶𝐶𝐶 =𝑇𝑇𝑇𝑇+𝐹𝐹𝑇𝑇𝑇𝑇𝑇𝑇 (2)
C. Recall/Sensitivity and Specificity
Recall presents a function of correctly classified objects i.e. true positives and false negatives while specificity
describes the results in terms of true negative values.
Both Recall and Precision are relevant to each other. Precision is the fraction of retrieved information relevant to the search while Recall is the fraction of the information related to the search query that is retrieved successfully [14, 32]. The formulas for Sensitivity and Specificity are given below:
𝑅𝑅𝑃𝑃𝑃𝑃𝑀𝑀𝑒𝑒𝑒𝑒/𝑆𝑆𝑃𝑃𝐶𝐶𝐶𝐶𝐶𝐶𝑀𝑀𝐶𝐶𝑆𝑆𝐶𝐶𝑀𝑀𝑆𝑆 =𝑇𝑇𝑇𝑇+𝐹𝐹𝑇𝑇𝑇𝑇𝑇𝑇 (3)
𝑆𝑆𝑆𝑆𝑃𝑃𝑃𝑃𝐶𝐶𝐶𝐶𝐶𝐶𝑃𝑃𝐶𝐶𝑀𝑀𝑆𝑆 =𝑇𝑇𝑇𝑇+𝐹𝐹𝑇𝑇𝑇𝑇𝑇𝑇 (4)
TABLE II:RESULTS OF EVALUATION TECHNIQUES ON MULTI-CLASS
DATASET
Confusion Matrix 65% 62.5% 60% Precision 86.36% 85.71% 85% Recall/Sensitivity 63% 60% 56% Specificity 70% 70% 40% F-Measure 72.72% 70% 67% Type I Error 36.6% 40% 43.3% Type II Error 30% 30% 60% D. F-Measure
F-Measure is another common evaluation metric that combines precision and recall into a single value. In other words it provides the percentage of the instances that are truly classified by a classification model [33], [34]. The formula is:
𝐹𝐹 − 𝑀𝑀𝑃𝑃𝑀𝑀𝐶𝐶𝐶𝐶𝑀𝑀𝑃𝑃 = 2𝑋𝑋𝑅𝑅𝑅𝑅𝑅𝑅𝑅𝑅𝑅𝑅𝑅𝑅+𝑇𝑇𝑥𝑥𝑅𝑅𝑅𝑅𝑥𝑥𝑥𝑥𝑥𝑥𝑥𝑥𝑥𝑥𝑅𝑅𝑅𝑅𝑅𝑅𝑅𝑅𝑅𝑅𝑅𝑅𝑥𝑥𝑇𝑇𝑥𝑥𝑅𝑅𝑅𝑅𝑥𝑥𝑥𝑥𝑥𝑥𝑥𝑥𝑥𝑥 (5) Table II describes the results of the above mentioned evaluation techniques, in percentages, for three selected classifiers.
E. ROC and Reject Curves
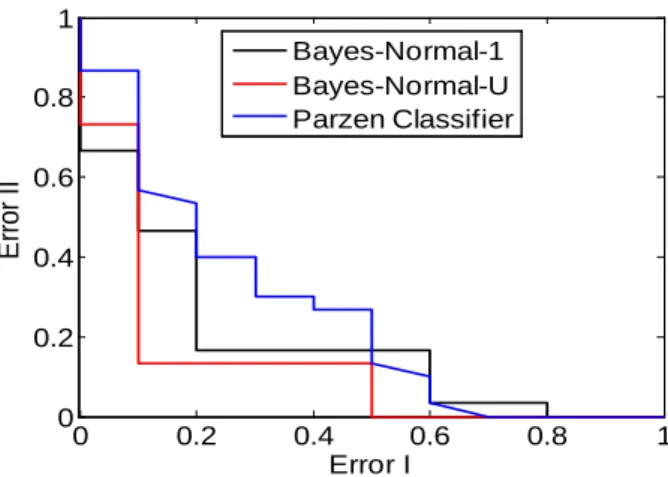
In this paper we visualize the Receiver Operating Curve (ROC) for Error Type I and Error Type II [35]. The curve is drawn for “False Positive” and “False Negative” values as Error Type I represents the “false positive” values while Error Type II represents the “false negative” values that a classifier predicts during the classification of a dataset. Results in terms of ROCs curve are presented in Figure 3.
𝑇𝑇𝑆𝑆𝑆𝑆𝑃𝑃 𝐼𝐼 𝐸𝐸𝑀𝑀𝑀𝑀𝐶𝐶𝑀𝑀 =𝑇𝑇𝑃𝑃 + 𝐹𝐹𝐹𝐹𝐹𝐹𝐹𝐹 (6) 𝑇𝑇𝑆𝑆𝑆𝑆𝑃𝑃 𝐼𝐼𝐼𝐼 𝐸𝐸𝑀𝑀𝑀𝑀𝐶𝐶𝑀𝑀 =𝑇𝑇𝐹𝐹 + 𝐹𝐹𝑃𝑃𝐹𝐹𝑃𝑃 (7)
Another common approach is the Reject curve which works on reducing the error cost by turning them into a rejection [36]. In this case the objects close to the decision boundaries are not classified. Reject curve for all three classifiers is presented in Figure 4.
Figure 3: Receiver Operating Curve for Classifier’s Evaluation
Figure 4: Rejection Curve for Classifier’s Evaluation
VI. DISCUSSIONANDCONCLUSION
All the above mentioned evaluation techniques have their own importance in analysing a classifier’s performance. All different techniques have confirmed that the best classifier for analysing gait patterns for NDDs patients is Bayes Normal Density based classifier with un-correlated variables (UDC) due to a quadratic decision boundary. Table II shows that the percentage of recall for the Quadratic classifier is higher than precision. This indicates that 95% of patterns in the dataset are recognized as related to some disease or control subject while 86.36% are correctly classified to its specific class. In case of curve analysis the Bayes classifier (red line) is showing the least error compare to others, both for the ROC and Rejection curve.
Given the nature of the multiclass datasets it is difficult to compare the results with the previous findings, where most of the time, the analysis is for 2-class datasets. However, the results can be elaborated from adifferent perspective. The accuracy rate (calculated from confusion matrix) is 65%, 62.5% and 60% for UDC, LDC and Parzen classifiers, respectively.
0 0.2 0.4 0.6 0.8 1 0 0.2 0.4 0.6 0.8 1 Error I E rro r I I Bayes-Normal-1 Bayes-Normal-U Parzen Classifier
In term of sensitivity and specificity, it is actually quite difficult to calculate true positive and false positive values because of three different NDDs. The sensitivity of UDC in terms of (CO-HD), (CO-PD), and (CO-ALS) is 90%, 50% and 50%, respectively. While the overall sensitivity for all 4-class datasets is 63%. Similarly, for LDC it is 40%, 80% and 60% for (CO-HD), (CO-PD), and (CO-ALS), respectively. Nonetheless, the overall percentage is 60%. In the case of
Parzen, the overall sensitivity is 56%. Working on the same
line, the specificity for individual diseases can be calculated. However, the overall percentage is 70%, 70% and 40% for
UDC, LDC, and Parzen separately.
Similarly, the precision of UDC, LDC, and Parzen is 86.36%, 85.71%, and 85%, respectively. F-measure is calculated through sensitivity and specificity, which is 72.72%, 70% and 67% for UDC, LDC, and Parzen respectively. Furthermore, Table II also reveals the false negative and false
positive values for all classifiers in term of Error type I and
Error type II.
As a preamble to our argument, a conjecture has already been postulated in the beginning that “a misclassification of true positive instance should not necessarily be considered a
false negative when it comes to multi-class pattern
recognition”. This indicates that all classes are of equal
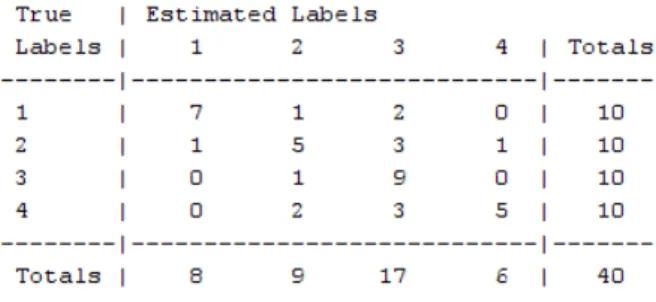
importance and yet must be distinguished. This has been clearly evident in the screen short of a confusion matrix
(Figure 5) where 1indicates CO, 2, 3 and 4 indicate HD, PD and ALS respectively.
For instance, while recognizing the gait patterns of HD subjects (column 2 in Figure 5), 5 out of 10 are distinguished
as true positive and the remaining 5 are misclassified. But
interestingly, the rest of the 5 are not categorized as false
negative rather 3 of them miss-classified to PD, 1 as ALS
(other NDDs) while only 1is a false negative.
Figure 5: Screen Short of Confusion Matrix for UDC
Working on the same line, while classifying Parkinson patients, 9 out of 10 are classified as PD while none of the instances is classified as false negative, as shown in the column 3 of Figures 5. Similarly, only 5 ALS patients are positively classified (true positive) while the rest of the five are either misclassified as HD or PD, and none of the instances is classified as false negative as shown in the column 4 ofFigure 5. This has clearly given a new dimension to our results.
This is further verified from the confusion matrix results of
LDC and Parzen classifiers as shown in the Figure 6 and Figure 7 respectively.
Figure 6: Screen Short of Confusion Matrix for LDC
Figure 7: Screen Short of Confusion Matrix for Parzen Classifier
According to this justification, the new calculation says that sensitivity of the UDC classifier is (19/19+1) x100= 95% which is highest comparing to the literature so far. Similarly, for LDC and Parzen is 81.8% and 74%, respectively.
Even the ROC curves are hard to compare using different classifiers for different misclassification costs and class distributions. Here, we have analysed an equal number of objects for each class to avoid misclassification and bias results due to skewed datasets.
In this paper we have discussed the challenges and complexities related to performance evaluation techniques for multi-class pattern recognition with multiple classifiers. We have demonstrated using a confusion matrix how some important features get neglected while evaluating the performance of a classification model based on a simple
accuracy rate. In future work, we intend to consider new
measures that best evaluate a multi-class dataset such as
Youden’s index, likelihood and discrimination power focusing
on failure avoidance or class discrimination.
REFERENCES
[1] M. Sokolova, N. Japkowicz, and S. Szpakowicz, "Beyond Accuracy, F-Score and ROC: A Family of Discriminant Measures for Performance Evaluation." vol. 4304, A. Sattar and B.-h. Kang, Eds., ed: Springer Berlin / Heidelberg, 2006, pp. 1015-1021.
[2] H.-Y. Lin, "Efficient classifiers for multi-class classification problems," Decision Support Systems, vol. 53, pp. 473-481, 2012.
[3] X. Qi and B. D. Davison, "Web page classification: Features and algorithms," ACM Comput. Surv., vol. 41, pp. 1-31, 2009.
[4] L. Becchetti, C. Castillo, D. Donato, R. Baeza-YATES, and S. Leonardi, "Link analysis for Web spam detection," ACM Trans. Web, vol. 2, pp. 1-42, 2008.
[5] D. Delen, G. Walker, and A. Kadam, "Predicting breast cancer survivability: a comparison of three data mining methods," Artif. Intell. Med., vol. 34, pp. 113-127, 2005.
[6] A. Khashman, "Neural networks for credit risk evaluation: Investigation of different neural models and learning schemes," Expert Systems with Applications, vol. 37, pp. 6233-6239, 2010.
[7] H.-W. Kim, H. C. Chan, and S. Gupta, "Value-based Adoption of Mobile Internet: An empirical investigation," Decision Support Systems, vol. 43, pp. 111-126, 2007.
[8] C.-F. Tsai, "Feature selection in bankruptcy prediction," Knowledge-Based Systems, vol. 22, pp. 120-127, 2009.
[9] P. Meriggi, P. Castiglioni, F. Rizzo, V. Gower, R. Andrich, M. Rabuffetti, M. Ferrarin, and M. Di Rienzo, "Potential role of wearable, ambulatory and home monitoring systems for patients with neurodegenerative diseases and their caregivers," in 5th International Conference on Pervasive Computing Technologies for Healthcare (PervasiveHealth) 2011, pp. 316-319.
[10] A. Harter, A. Hopper, P. Steggles, A. Ward, and P. Webster, "The Anatomy of a Context-Aware Application," Wireless Networks, vol. 8, pp. 187-97, 2002.
[11] S. Iram, D. Al-jumeily, P. Fergus, M. Randles, and A. Hussain, "Computational Data Analysis for Movement Signals Based on Statistical Pattern Recognition Techniques for Neurodegenerative Diseases," in 13th Annual Post Graduate Symposium on the Convergence of Telecommunications, Networking and Broadcasting, 2012, pp. 1-6.
[12] S. Iram, P. Fergus, D. Al-jumeily, A. Hussain, and M. Randles, "A Classifier Fusion Strategy to Improve the Early Detection of Neurodegenerative Diseases," International Journal of Artificial Intelligence and Soft Computing, pp. 1-18, 2012.
[13] N. Seliya, T. M. Khoshgoftaar, and J. Van Hulse, "Aggregating performance metrics for classifier evaluation," in IEEE International Conference on Information Reuse & Integration, 2009, pp. 35-40. [14] C. G. Weng and J. Poon, "A New Evaluation Measure
for Imbalanced Datasets," in Proc. Seventh Australasian Data Mining Conference (AusDM 2008), South Australia, 2008, pp. 27-32.
[15] N. Japkowicz, "Classifier evaluation: A need for better education and restructuring," in Proceedings of the 3rd Workshop on Evaluation Methods for
Machine Learning, ICML 2008, Helsinki, Finland, 2008.
[16] W. Shuo and Y. Xin, "Multiclass Imbalance Problems: Analysis and Potential Solutions," IEEE Transactions on Systems, Man, and Cybernetics, Part B: Cybernetics, vol. 42, pp. 1119-1130, 2012.
[17] C. Ken, L. Bao-Liang, and J. T. Kwok, "Efficient Classification of Multi-label and Imbalanced Data using Min-Max Modular Classifiers," in International Joint Conference on Neural Networks, 2006. IJCNN '06. , 2006, pp. 1770-1775.
[18] X.-M. Zhao, X. Li, L. Chen, and K. Aihara, "Protein classification with imbalanced data," Proteins: Structure, Function, and Bioinformatics, vol. 70, pp. 1125-1132, 2008.
[19] A. C. Tan and D. Gilbert, "Multi-class protein fold classification using a new ensemble machine learning approach " Genome Informatics, vol. 14, pp. 206-217, 2003.
[20] Z. Zhi-Hua and L. Xu-Ying, "Training cost-sensitive neural networks with methods addressing the class imbalance problem," Knowledge and Data Engineering, IEEE Transactions on, vol. 18, pp. 63-77, 2006.
[21] A. S. Ghanem, S. Venkatesh, and G. West, "Multi-class Pattern Classification in Imbalanced Data," presented at the Proceedings of the 20th International Conference on Pattern Recognition, 2010.
[22] D. Xiong, F. Xiao, L. Liu, K. Hu, Y. Tan, S. He, and X. Gao, "Towards a better detection of horizontally transferred genes by combining unusual properties effectively," PLOS ONE, vol. 7, p. e43126, 2012. [23] F. Ganji, S. Abadeh, M. Hedayati, and N. Bakhtiari,
"Fuzzy classifcation of imbalanced data sets for medical diagnosis," in 17th Iranian Conference of Biomedical Engineering (ICBME), 2010, pp. 1-5. [24] T. Sun, R. Zhang, J. Wang, X. Li, and X. Guo,
"Computer-Aided Diagnosis for Early-Stage Lung Cancer Based on Longitudinal and Balanced Data," PLoS One vol. 8, p. e63559, 2013.
[25] M. Beigi and A. Zell, "SPSO: Synthetic Protein Sequence Oversampling for Imbalanced Protein Data and Remote Homology Detection," in Biological and Medical Data Analysis. vol. 4345, N. Maglaveras, I. Chouvarda, V. Koutkias, and R. Brause, Eds., ed: Springer Berlin Heidelberg, 2006, pp. 104-115.
[26] O. Guobin, Y. L. Murphey, and L. Feldkamp, "Multiclass pattern classification using neural networks," in Proceedings of the 17th International Conference on Pattern Recognition, 2004. ICPR 2004. , 2004, pp. 585-588 Vol.4.
[27] R. Rifkin and A. Klautau, "In Defense of One-Vs-All Classi¯cation," Journal of Machine Learning Research, vol. 5, pp. 101-141, 2004.
[28] R. Jin and J. Zhang, "Multi-Class Learning by Smoothed Boosting," Mach. Learn., vol. 67, pp. 207-227, 2007.
[29] H. Valizadegan, R. Jin, and A. Jain, "Semi-Supervised Boosting for Multi-Class Classification," in Machine Learning and Knowledge Discovery in Databases. vol. 5212, W. Daelemans, B. Goethals, and K. Morik, Eds., ed: Springer Berlin Heidelberg, 2008, pp. 522-537.
[30] H. C. Shamsudin, A. Adam, M. I. Shapiai, M. A. M. Basri, Z. Ibrahim, and M. Khalid, "An Improved Two-Step Supervised Learning Artificial Neural Network for Imbalanced Dataset Problems," in Third International Conference on Computational Intelligence, Modelling and Simulation (CIMSiM), 2011, 2011, pp. 108-113.
[31] N. D. Marom, L. Rokach, and A. Shmilovici, "Using the confusion matrix for improving ensemble classifiers," in 26th Convention of Electrical and Electronics Engineers in Israel (IEEEI), 2010, pp. 000555-000559.
[32] L. A. Jeni, J. F. Cohn, and F. De La Torre, "Facing Imbalanced Data--Recommendations for the Use of Performance Metrics," in Humaine Association
Conference on Affective Computing and Intelligent Interaction (ACII), 2013 2013, pp. 245-251.
[33] F. M. Rodrigues, A. de M Santos, and A. M. P. Canuto, "Using confidence values in multi-label classification problems with semi-supervised learning," in The 2013 International Joint Conference on Neural Networks (IJCNN),, 2013, pp. 1-8.
[34] I. Pillai, G. Fumera, and F. Roli, "F-measure optimisation in multi-label classifiers," in 21st International Conference on Pattern Recognition (ICPR), 2012, pp. 2424-2427.
[35] T. C. W. Landgrebe and R. P. W. Duin, "Approximating the multiclass ROC by pairwise analysis," Pattern Recogn. Lett., vol. 28, pp. 1747-1758, 2007.
[36] P. Simeone, C. Marrocco, and F. Tortorella, "Shaping the error-reject curve of error correcting output coding systems," presented at the Proceedings of the 16th international conference on Image analysis and processing, Ravenna, Italy, 2011.