U n i v e r s i t y o f H u d d e r s f i e l d R e p o s i t o r y
I g h o r oj e, L a m o g h a H y b ri d Au t o m a t e d M a c h i n e L e a r n i n g S y s t e m fo r Bi g D a t a Or i g i n a l C i t a t i o n I g h o r oj e, L a m o g h a ( 2 0 1 8 ) H y b ri d Au t o m a t e d M a c hi n e L e a r n i n g S y s t e m fo r Bi g D a t a . Do c t o r al t h e si s, U n iv e r si ty of H u d d e r sfi el d. T hi s v e r si o n is a v ail a bl e a t h t t p :// e p r i n t s . h u d . a c . u k/i d/ e p r i n t/ 3 5 0 4 8 / T h e U n iv e r si ty R e p o si t o r y is a d i gi t al c oll e c tio n of t h e r e s e a r c h o u t p u t of t h e U niv e r si ty, a v ail a bl e o n O p e n Acc e s s . C o p y ri g h t a n d M o r al Ri g h t s fo r t h e it e m so n t hi s si t e a r e r e t ai n e d b y t h e i n divi d u a l a u t h o r a n d / o r o t h e r c o p y ri g h t o w n e r s .
U s e r s m a y a c c e s s full it e m s fr e e of c h a r g e ; c o pi e s of f ull t e x t it e m s g e n e r a lly c a n b e r e p r o d u c e d , d i s pl ay e d o r p e rf o r m e d a n d g iv e n t o t hi r d p a r ti e s i n a n y fo r m a t o r m e d i u m fo r p e r s o n al r e s e a r c h o r s t u dy, e d u c a ti o n al o r n o t-fo r-p r ofi t p u r p o s e s wi t h o u t p r i o r p e r m i s sio n o r c h a r g e , p r o vi d e d :
• T h e a u t h o r s , ti tl e a n d f ull b i blio g r a p h i c d e t ail s is c r e d i t e d in a n y c o p y;
• A h y p e r li n k a n d / o r U RL is in cl u d e d fo r t h e o ri gi n al m e t a d a t a p a g e ; a n d
• T h e c o n t e n t is n o t c h a n g e d i n a n y w ay.
F o r m o r e i nfo r m a t io n , in cl u di n g o u r p olicy a n d s u b m i s sio n p r o c e d u r e , p l e a s e c o n t a c t t h e R e p o si t o r y Te a m a t : E. m a il b ox@ h u d . a c. u k .
HYBRID AUTOMATED MACHINE LEARNING SYSTEM
FOR BIG DATA
By: Lamogha Ighoroje
School of Computing and Engineering University of Huddersfield
A thesis submitted to the University of Huddersfield in partial fulfilment of the requirements for the degree of Doctor of Philosophy.
Copyright statement
i. The author of this thesis (including any appendices and/or
schedules to this thesis) owns any copyright in it (the
“Copyright”) and s/he has given The University of Huddersfield the right to use such copyright for any administrative, promotional, educational and/or teaching purposes.
ii. Copies of this thesis, either in full or in extracts, may
be made only in accordance with the regulations of the University Library. Details of these regulations may be obtained from the Librarian. This page must form part of any such copies made.
iii. The ownership of any patents, designs, trademarks and any
and all other intellectual property rights except for the
Copyright (the “Intellectual Property Rights”) and any
reproductions of copyright works, for example graphs and
tables (“Reproductions”), which may be described in this
thesis, may not be owned by the author and may be owned by third parties. Such Intellectual Property Rights and
Reproductions cannot and must not be made available for use without the prior written permission of the owner(s) of the relevant Intellectual Property Rights and/or
Acknowledgements
I acknowledge God Almighty for making it possible for me to undergo this research.
I will like to take the opportunity to acknowledge and thank my supervisory team, led by Prof. Joan Lu for giving me the
opportunity to undergo this PhD research, and develop my research skills and interests in big data machine learning.
Finally, and most importantly I am very grateful to my parents Prof. Mrs Ahbor D.A. Ighoroje and Engr. Mr Richard Ighoroje, who supported my studies financially and morally at every stage. I also appreciate my husband Raymond Chiazor for his love and encouragements and all my family and friends for their immense support throughout my research years at the University.
Abstract
A lot of machine learning (ML) models and algorithms exist and in designing classification systems, it is often a challenge looking for and selecting the best performing ML algorithm(s) to use for a dataset in a short period of time. Often, one must learn thor-oughly about the data set structure and content, decide whether to use a supervised, semi-supervised or an unsupervised learning strategy, and then investigate, select or design via trial and error a classification or clustering algorithm that would work most accurately for that specific dataset. This can be quite a time consuming and tedious process. Additionally, a classification algorithm may not perform very well with a dataset as compared to using a clustering algorithm. Meta-learning (learning to learn) and automatic ML (autoML) are data mining-based formalisms for modelling evolving conventional ML functions and toolkit systems. The concept of modelling a decision tree-based combination of both formalisms as a Hybrid-AutoML toolkit extends that of traditional complex autoML systems.
In hybrid-autoML, single or multiple predictive models are built by combining a three-layered decision learning architecture for automatic learning mode and model selection, by engaging formal-isms for selecting from a variety of supervised or unsupervised ML algorithms and generic meta information obtained from varying multi-datasets. The work presented in this thesis aims to study, conceptualize, design and develop this hybrid-autoML toolkit. By extending in the simplest form, some existing methodologies for the model training aspect of autoML systems. The theoretical and experimental development focuses on the extension of autoWeka and use of existing meta-learning, algorithm selection and
deci-sion tree concepts. It addresses the issue of efficient ML mode
(supervised or unsupervised) and model selection for varying multi-datasets, learning methods representations of practical alternative use cases and structuring of layered decision ML un-folding, and algorithms for constructing the unfolding. The im-plementation aims to develop tools for hybrid-autoML based model visualization or evaluation, use case simulations and analysis on single or multi varying datasets. An open source tool called hybrid-autoML has been developed to support these functionali-ties. Hybrid-autoML provides a user-friendly graphical interface that facilitates single or multi varying datasets entry, sup-ports automatic learning mode or strategy selection, automatic model selection on single or multi-varying datasets, supports predictive testing, and allows the automatic visualization and use of a set of analytical tools for model evaluation. It is highly extensible and saves a lot of time.
Table of Contents
1 Introduction ... - 1 -
1.1 Background ... 1
-1.2 Research Focus and Values ... 3
-1.3 Aims and Contributions ... 4
-1.4 Outline of the Thesis ... 6
-1.5 List of Publications ... 6
Summary ... 7
-2 Literature Review ... - 8 -
Introduction ... - 8 -
2.1 Big Data Machine Learning ... - 8 -
2.1.1 Big Data Classification Related works ... 9
-2.2 Classification and Clustering ... - 12 -
2.2.1 Data Classification & Regression ... 12
-2.2.2 Data Clustering ... 13
-2.2.3 Classification Methods ... 14
-2.3 Testing the Performance of Classification Algorithms . - 21 -2.3.1 HoldOut Method Validation method: ... 21
-2.3.2 Cross Validation method: ... 21
-2.3.3 Bootstrap method: ... 21
-2.3.4 Confusion Matrix: ... 22
-2.3.5 Discrete Classifier Evaluation Measures ... 22
-2.3.6 Integrity of the model: ... 26
-2.3.7 Simplicity ... 26
-2.3.8 Run time ... 26
-2.3.9 Reliability ... 26
-2.3.10 Storage Requirements ... 26
-2.4 Classification Tools ... 26
-2.5 The Algorithm Selection Problem ... 28
-2.6 Meta-Learning ... - 29 -
2.7 Automated Machine Learning (AutoML) ... - 31 -
2.7.1 Starting High ... 31
-2.7.2 Exhaustive Searching ... 32
-2.7.3 AutoML Related Works ... 32
Summary ... 35 -3 Methodology ... - 36 - Introduction ... - 36 - 3.1 Methods ... - 37 - 3.1.1 Reviewing Literatures ... 37 -3.1.2 Mini Survey ... 38
-3.1.3 Hypothesis and Assumptions ... 38
3.2.1 Experiment Materials ... 39
-3.2.2 Big Data ... 40
-3.2.3 Experimental Setup ... 42
-3.2.4 Preliminary Experiment Results ... 50
-3.2.5 Size Effect experiment on an example classification problem ... 58
-3.3 Machine Learning Algorithms Considered ... - 59 -
3.3.1 Feature Selection and Filtering ... 60
-3.3.2 Supervised Classifiers ... 60
-3.3.3 Unsupervised Classifiers ... 63
-3.3.4 Evaluation Measures ... 64
-3.4 Problem Identification Through Experiments ... 64
-3.5 Knowledge Gained from Experiments ... - 65 -
Summary ... - 67 -
4 Hybrid-AutoML System ... - 68 -
Introduction ... - 68 -
4.1 System Requirements ... - 68 -
4.2 The Model Design ... 68
-4.2.1 Design Goals and Aims ... 68
-4.2.2 Model Architecture ... 70
-4.2.3 Model Components ... 71
-4.2.4 Model Characteristics ... 71
-4.3 The Model Algorithms ... - 73 -
4.3.1 Decision (meta) Learning Algorithm ... 73
-4.3.2 AutoProbClass Unsupervised Algorithm ... 73
-4.4 Design Materials ... - 75 -
4.4.1 Weka API ... 75
-4.4.2 NetBeans IDE ... 75
-4.4.3 Program ... 76
-4.5 Testing and Evaluation of System Model ... - 76 -
4.5.1 Case Study 1 ... 76
-4.5.2 Case Study 2 ... 77
-Summary ... - 78 -
5 Results and Discussion ... - 79 -
Introduction ... - 79 -
5.1 Evaluation of Use Cases. ... - 79 -
5.1.1 Use Case 1 (Small Unlabeled Dataset) ... 79
-5.1.2 Use Case 2 (Larger Unlabeled Dataset) ... 82
-5.1.3 Use Case 3 (Large Labelled Train Data with Smaller Test Data) ... 83
-5.1.4 Use Case 4 (Small Labelled Train Data with Large Test Data) ... 85
-5.1.5 Use Case 5 (Location with MultiVarying Data sets) ... 87
-5.2 Comparison of the Hybrid autoML with AutoWeka ... - 95 -
Summary ... - 97 -
6.1 Conclusion ... 98 6.2 Future Work ... 100 Appendix 1 ... 101 Appendix 2 ... 102 Appendix 3 ... 103 Appendix 4 ... 105 Appendix 5 ... 107 Appendix 6 ... 108 Appendix 7 ... 114
List of Figures
FIGURE 2.1:A SIMPLE DECISION TREE THAT REPRESENTS RESPONSES TO DIRECT MAILING (ROKACH &MAIMON,2010). ... -16
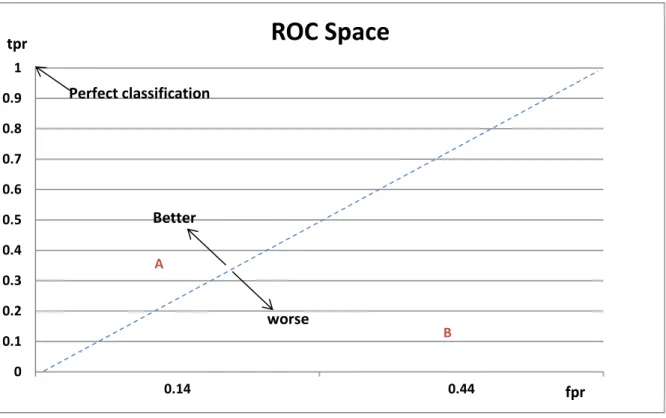
-FIGURE 2.2:THE ROC SPACE AND PLOTS OF THE TWO PREDICTION CASES ABOVE... -25
-FIGURE 3.1:WEKA EXPLORER ‘CLASSIFIER’ TAB. ... -42
-FIGURE 3.2:OUTPUT RESULT WINDOW DISPLAY FOR A ‘CLASSIFIER’ IN WEKA. ... -43
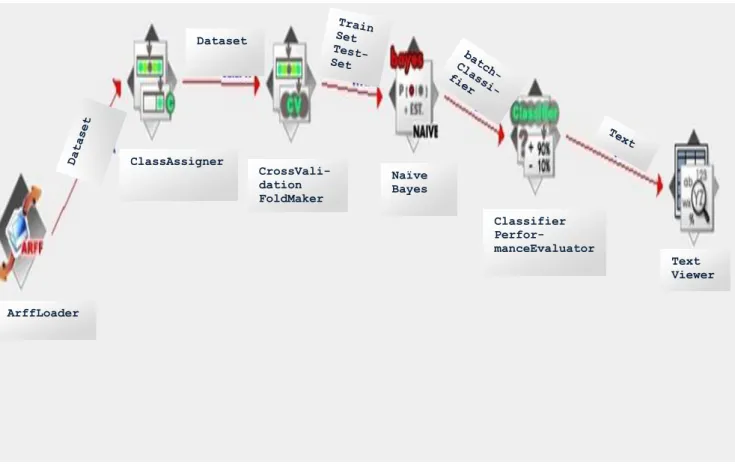
-FIGURE 3.3:EXAMPLE OF A SINGLE SUPERVISED LEARNING KNOWLEDGE FLOW SETUP IN WEKA. ... -44
-FIGURE 3.4:UNSUPERVISED LEARNING KNOWLEDGE FLOW SETUP IN WEKA. ... -45
-FIGURE 3.5:KNOWLEDGE FLOW SETUP FOR TESTING SEVERAL CLASSIFICATION ALGORITHMS ON A GIVEN DATASET IN PARALLEL. ... -46
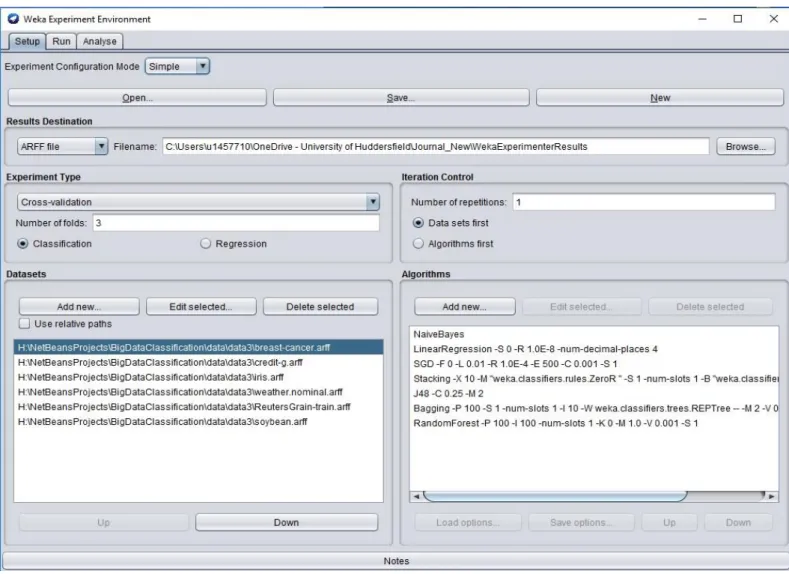
-FIGURE 3.6:EXPERIMENTER SETUP FOR TESTING SEVERAL CLASSIFICATION ALGORITHMS ON VARIOUS DATASETS. ... -47
-FIGURE 3.7:DATASET VIEW IN TABULAR FORMAT FROM THE EXPERIMENTER ... -48
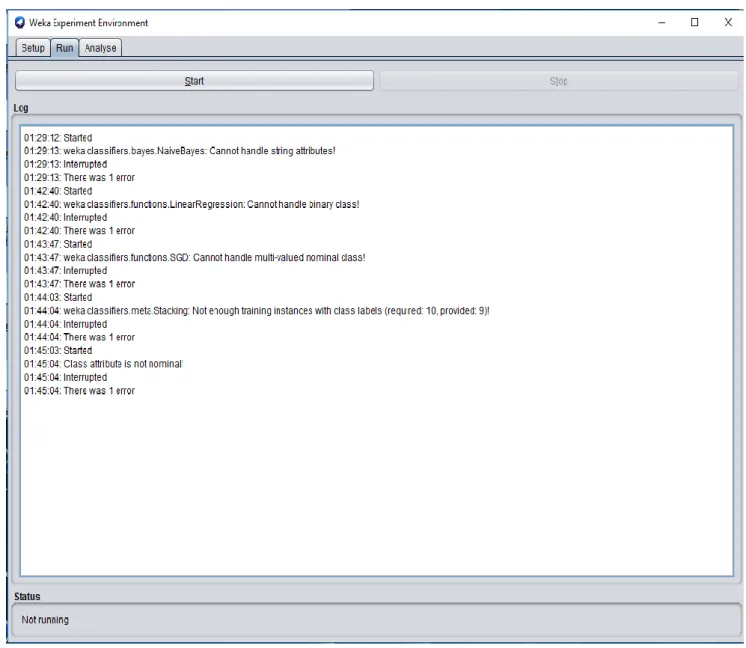
-FIGURE 3.8:POSSIBLE ERRORS FACED WHEN RUNNING THE EXPERIMENTER ON SEVERAL DATASETS AND ALGORITHMS ... -49
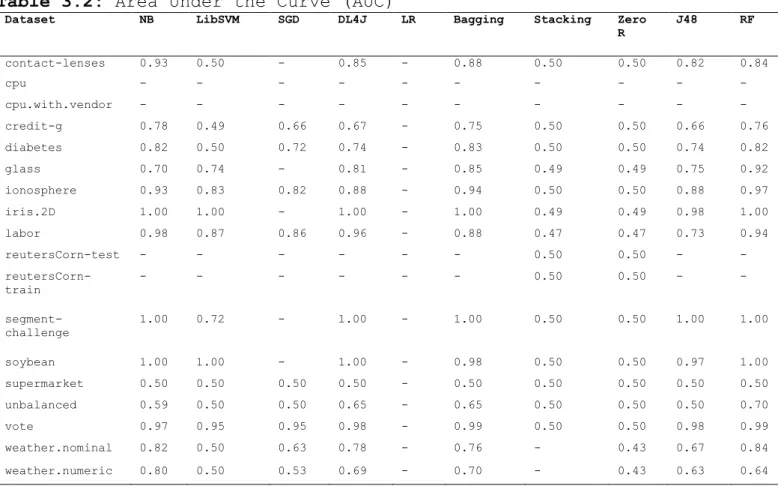
-FIGURE 3.9:AREA UNDER ROC(AUC) ... -51
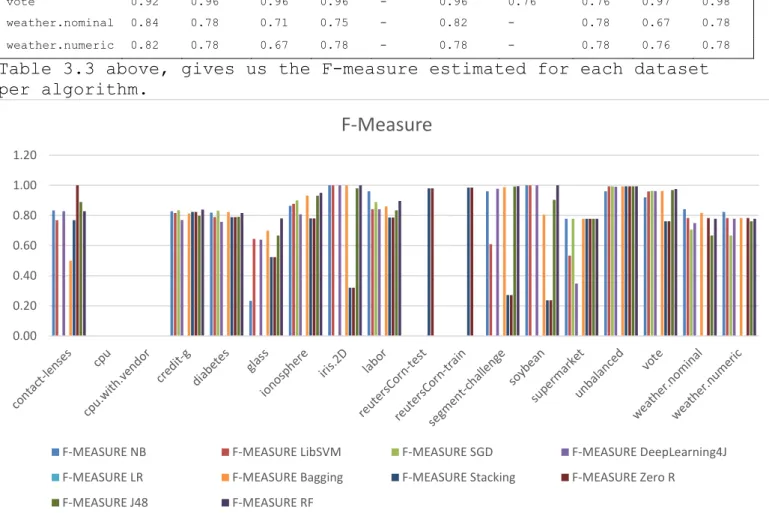
-FIGURE 3.10:F-MEASURE FOR EACH DATASET AGAINST SEVERAL CLASSIFICATION ALGORITHMS ... -52
-FIGURE 3.11:MEAN ABSOLUTE ERROR (MAE)0-1 ... -54
-FIGURE 3.12:MEAN ABSOLUTE ERROR (MAE) FOR CPU AND CPU.WITH.VENDOR DATASETS ... -54
-FIGURE 3.13:CORRELATION COEFFICIENT 0-1(CPU AND CPU.WITH.VENDOR DATASETS) ... -56
-FIGURE 3.14:SIZE EFFECT ON ACCURACY (%) ... -58
-FIGURE 4.1:THREE LAYERED DECISION ARCHITECTURE FOR THE HYBRID AUTO MACHINE LEARNING SYSTEM PROPOSED AFTER EXPERIMENTS. ... -70 -FIGURE 4.2:SIMPLE GUI INTERFACE FOR THE IMPLEMENTATION OF THE HYBRID AUTO CLASSIFICATION SYSTEM. ... -77
-FIGURE 4.3:DETAILS OF THE CONTACT-LENSES-TEST DATASET USED. ... -78
-FIGURE 5.1:SHOWS A DATA SUMMARY ON UPLOAD OF THE SMALL UNLABELLED DATASET (SOY-TEST). ... -80
-FIGURE 5.2: SHOWS THAT AN UNSUPERVISED ML MODE WAS SELECTED AUTOMATICALLY AND A CLUSTERING MODEL CONSTRUCTED BY ENGAGING AUTOPROB CLUSTERING FUNCTION ON THE SOY-TEST DATASET. THIS MODEL AUTOMATICALLY RESULTED IN SIX CLUSTER BEEN IDENTIFIED IN UNDER 0.03 SECONDS. ... -81
-FIGURE 5.3:SHOWS AN UNSUPERVISED ML MODE USING THE EM CLUSTERING ALGORITHM WAS AUTOMATICALLY CHOSEN AS THE BEST TO USE FOR THIS GIVEN TASK. TWO CLUSTERS WHERE DERIVED AND THE EM MODEL BUILT IN 3.21 SECONDS. ... -82
-FIGURE 5.4:THE ROC CURVE OBTAINED AFTER A MODEL WAS BUILT AND TESTED USING THE GISETTE DATA SET. ... -83
-FIGURE 5.5:SHOWS THE EVALUATION RESULT OBTAINED FROM USING THE HYBRID AUTOML SYSTEM ON THE 'GISETTE' DATA SET. ... -84
-FIGURE 5.6:ROC CURVE OBTAINED FROM TRAINING THE MODEL ON THE GIVEN TRAIN DATA SET. ... -85
-FIGURE 5.7:EVALUATION METRICS OBTAINED FROM USING A SMALL TRAINED DATA SET AND LARGE TEST SET IN USECASE4. ... -86
-FIGURE 5.8:A FILE DIRECTORY SUPPLIED AS THE LOCATION CONTAINING THE VARYING DATA SETS TO BE SUPPLIED IN ONE RUN. IT SHOWS A TOTAL OF 8 DATASETS THAT WE USE TO TEST THIS USER SCENARIO. ... -87
-FIGURE 5.9:ROC CURVED OBTAINED FOR FIVE OUT OF THE 8 MULTI-VARYING DATA SETS IN OUR DATA LOCATION. ... -88
-FIGURE 5.10:SHOWS THE EVALUATION FOR THE 'BREAST CANCER' DATA SET AND NAIVE BAYES AUTOMATICALLY CHOSEN FOR IT AS THE CLASSIFIER. ... -89
-FIGURE 5.11:SHOWS THAT RANDOM FOREST WAS CHOSEN FOR THE 'IRIS' DATASET. ... -90
-FIGURE 5.12:EVALUATION RESULTS SHOWN FOR THE 'LABOUR' DATA SET. ... -91
-FIGURE 5.13:EVALUATION RESULT FOR THE 'RESULTS' DATA SET. ... -92
-FIGURE 5.14:EVALUATION RESULTS FOR THE 'REUTERSCORNTRAIN' DATA SET. ... -93
-FIGURE 5.15:EVALUATION RESULTS SHOWING THAT RANDOM FOREST CLASSIFIER ISAUTOMATICALLY USED TO BUILD THE MODEL FOR THE 'SAMSUNG-GALAXY-GEAR' DATA SET. ... -94
-FIGURE 6.1: SHOWS DATA FROM THE SURVEY CARRIED OUT, THAT DATA SCIENCE PROFESSIONALS ARE WELL AWARE OF DATA CLASSIFICATION AS A GOOD MANAGEMENT TECHNIQUE... 105
FIGURE 6.2:SURVEY RESULTS, SHOWING DATA SCIENCE PROFESSIONALS THOUGHTS ON WHETHER BIG DATA CLASSIFICATION MEASURES IN PLACE, EFFECTIVELY IMPROVES SECURITY. ... 105
FIGURE 6.3:SURVEY RESULTS ON THE USE OF BIG DATA CLASSIFICATION TOOLS BY SEVERAL DATA SCIENCE PROFESSIONALS. ... 106
FIGURE 6.4:10-FOLDS ANALYSES OF THE AREA UNDER THE CURVE PERFORMANCE MEASURE. ... 109
FIGURE 6.5:10FOLDS F-MEASURE EVALUATION ... 110
FIGURE 6.6:10 FOLDS MAE EVALUATION ... 111
FIGURE 6.7:10 FOLDS MAE EVALUATED MEASURES FOR CPU AND CPU.WITH.VENDOR DATASETS. ... 112
FIGURE 6.8:10 FOLDS %ACCURACY... 113
FIGURE 6.9:10 FOLDS CORRELATION COEFFICIENT OF CPU AND CPU.WITH.VENDOR ... 113
FIGURE 6.10:WEKA GUI WHEN INITIALLY LAUNCHED. ... 114
FIGURE 6.11:THE WEKA EXPLORER GUI... 115
FIGURE 6.12:THE WEKA EXPERIMENTER GUI ... 116
List of Tables
TABLE 2.1:A COMPARISON OF SOME TOOLS USED FOR DATA MINING EXPERIMENTATIONS. ... -28
-TABLE 2.2:A SUMMARY OF CURRENT STATE-OF-THE-ART AUTOML SYSTEMS ... -35
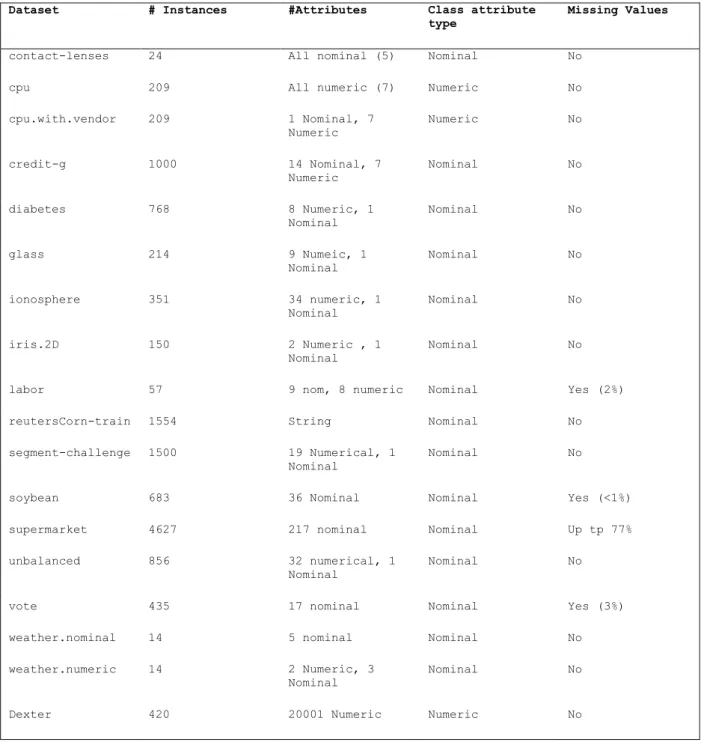
-TABLE 3.1:A LIST OF DATASETS USED FOR PRELIMINARY EXPERIMENTS, TAKEN AS A SUBSET FROM THE FULL LIST OF DATASETS USED IN THIS RESEARCH. ... -41
-TABLE 3.2:AREA UNDER THE CURVE (AUC) ... -50
-TABLE 3.3:F-MEASURE FOR DATASETS PER ALGORITHM. ... -52
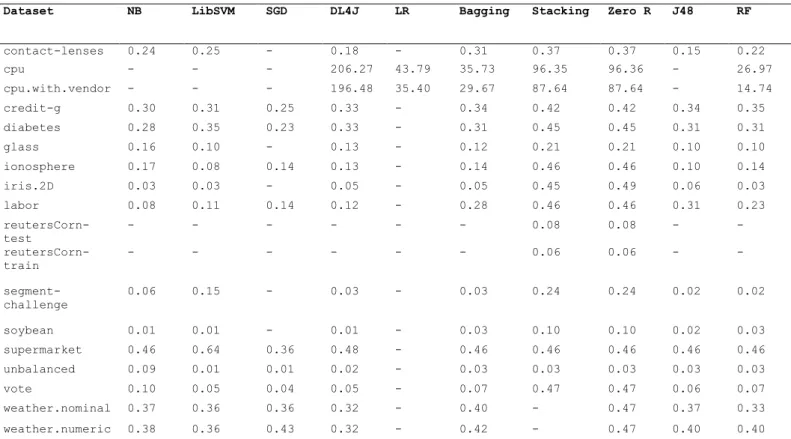
-TABLE 3.4:TABLE OF THE MEAN ABSOLUTE ERROR (MAE) FOR THE VARIOUS DATASETS. ... -53
-TABLE 3.5:ACCURACY IN % AND CORRELATION COEFFICIENTS FOR CPU AND CPU.WITH.VENDOR DATASETS ... -55
-TABLE 3.6:COMBINATION OF EVALUATION MEASURES ON EACH DATASET TO EFFECTIVELY EVALUATE PERFORMANCE OF EACH ALGORITHM ON DIFFERENT ALGORITHMS, IN ORDER TO UNDERSTAND THE PATTERNS. ... -57
-TABLE 3.7:THE EFFECT OF THE TRAIN AND TEST SIZES ON A NAÏVE BAYES CLASSIFIER (%ACCURACY). ... -58
-TABLE 3.8:THE FOLLOWING ALGORITHMS FROM WEKA WHERE USED IN THE EXPERIMENTS CARRIED OUT. ... -59
-TABLE 4.1:HYPOTHETICAL EXAMPLE CASE STUDY OF A MULTI-CLASS LABELS UNSUPERVISED ALGORITHM. ... -72
-TABLE 5.1:COMPARING AUTOWEKA AND THE HYBRID AUTOML DESIGNED IN THIS THESIS. ... -96
-TABLE 6.1:A TABLE SUMMARY OF DATASETS USED IN THIS RESEARCH. ... 107
TABLE 6.2:AREA UNDER CURVE USING 10-FOLDS CROSS VALIDATION ... 108
TABLE 6.3:10-FOLDS F-MEASURE EVALUATION ON THE DATASETS. ... 110
TABLE 6.4:10FOLDS MEAN ABSOLUTE ERROR MEASURES... 111
- 1 -
Chapter 1
1
Introduction
This chapter provides some background information, highlights into the motivations and problems resolved in this thesis and then
discusses the aims and contributions of this thesis.
1.1
Background
Over the past decades, there has been an explosion in the volume, variety and velocity of data. Offering effective solutions as a resolution of some major problems this explosion brings has become ever more important. One of such solutions is big data machine learning (ML) classification or clustering. However, with the solu-tions offered we become faced with several problems that include but not limited to the following:
1. Varying domains: A classifier trained using a labelled dataset may not be suitable for another dataset.
2. Traditional methods cannot efficiently accommodate the large varieties of class types found in a dynamically growing dataset. This often leads to inaccurate classification results.
3. Traditional methods are not suitable for present day multiple learning or multi-varying data tasks (Suthaharan, 2014).
Data classification is a data mining process of allocating data into one or more categories. The original and traditional concepts of classification involves a process of allocating pre-labelled data input into their relevant category, deriving a classification
function and then applying this function to correctly predict the class/category of un-labelled data input.
One of the most basic ways for organizations to determine the relative importance of the data they possess is through data classification. An interview of three chief information security officers (CISOs), from different organizations (Microsoft, Royal Bank of Scotland and dell incorporations) by Microsoft trustworthy computing in (Computing, 2014), confirms the relative importance of
data classification in today’s information security scenery. The data many organizations must deal with in recent years is referred to as big data; hence it is important to reason data classification in terms of big data. Big data is a term usually
defined in terms of Volume, Variety and Velocity (3 Vs). Definitions
and discussions on big data can be found in (Chen, Mao, & Liu, 2014; Fan & Bifet, 2013; Mahmood & Afzal, 2013; Small, 2013). There are numerous benefits of big data, which have been discussed over the years in different literatures, some of them include: increased
- 2 -
efficiency, better and improved services in different sectors e.g. healthcare, e-commerce, etc.
In the literatures, the classification problem is mostly communicated as follows. Given a set of class labels (Charu C.
Aggarwal) and a random variable input X under consideration,
determine correctly which label should be assigned to a new
unlabelled instance of X (Charu C Aggarwal, 2014b). Clustering
differs from classification in that it uses similarities between feature variables to perform separation into groups without prior
understanding of the group’s structure (i.e. it uses unlabelled
dataset) (Jain, Murty et al. 1999, Aggarwal and Reddy 2013, Jacques and Preda 2014). While for classification, the separation is done based on training dataset that translates information concerning the construction of the clusters (i.e. it uses labelled data) (Sokal 1974, Aggarwal 2014, Fabrico 2014). Classification is regularly denoted as supervised learning whereas clustering is often denoted as unsupervised Learning. Classification of big data has several ad-vantages and benefits, some of which can be seen in Appendix 1.
There are several conventional tools for data classification, and one of such tools is waikato environment for knowledge analysis (Weka) (Hall, Frank et al. 2009). It is a data-mining tool designed mainly for research purposes. It contains a lot of support that allows for data mining tasks easily and can help assist in the
development of new ML schemes or systems. The Weka API (application programming interface) provides various methods and function to help us build customisable ML systems.
ML is the field under which data classification resides. There is also no doubt that in data science, ML plays a very key and vital role in building smart and intelligent solutions using big data. From building an understanding of the most widely used ML schemes and algorithms, it has been observed that there are a lot of ML algorithms out there, and a model trained on one dataset might not be useful on another dataset. Also, data scientists spend an awful amount of time searching and selecting the best ML algorithm to use for a given data problem, which in turn brings about the need and
growth in the automated ML (autoML) field. The autoML field is a
fast-growing ML area, designed to automate tasks of data
preparation, pre-processing, and model training to ease the tasks of both intermediate and experts in the field.
Although there are a lot of traditional data classifiers or
clusterers, classification techniques and tools that can be used to achieve data classification, a majority still lack in their ability to effectively address the major challenges of big data on the fly. For example, some are not very effective in handling heterogeneous multi-datasets, or for handling large data streams. Secondly, some of the traditional classification methods are not flexible and scalable enough to handle large datasets or changes for which they
- 3 -
were not trained to handle. A highly acceptable classification
method or tool should be able to address the three major challenges of big data, should be flexible enough to adapt to changes within the organization. Lastly, another limitation of many classification systems, is the time and tedious process spent in finding the best ML algorithm to use on multi-varying datasets in a timely fashion. In ML, the decision about what learning algorithm to use, has been incorporated into the meta-learning (Learning to learn) research. Meta-learning has proven to have a major correlation with classifi-cation tasks. This connection is because as a researcher designing a classification system, one must empirically and analytically study existing algorithms (tons of algorithms exists) and in some cases even make use of some base concepts or hypothesis while designing the systems.
1.2
Research Focus and Values
In effectively designing a classification system the first step af-ter defining what the achievable goal is, usually entails the pro-cess of deciding what ML approach or model to select. Although some autoML systems (e.g. autoWeka and auto-sklearn) discussed in section 2.7.3 of this thesis, are efficient in their own ways for model
selection, some limitations they still have include:
a)Auto Learning mode as well as model selection: Not considering
and using more generic information and knowledge about various learning schemes (supervised, unsupervised or semi supervised) and algorithms (e.g. what happens if for a given scenario only a small amount of labelled training data instances is available?) to automatically decide on the mode or model algorithm to use of any given dataset.
b)Complexity of the various autoML systems, caused mainly by
focussing heavily on the problem of hyper parameter search and selection.
c)Supplying multi-varying datasets: Inability to supply multiple
datasets from different domains and sources at once to the tool for processing. This is mainly since because the systems are complex and consider not just the algorithm space but also the hyper parameter space and other parameters such as resource budget, etc. they need to consider only one dataset at a time. These limitations listed above, form part of the problems and
motivations for undergoing this research. The importance of study-ing, understandstudy-ing, designstudy-ing, conceptualizstudy-ing, and analyzing vari-ous ML algorithms to develop autoML systems for big data is well-ac-cepted in many application areas. The concept of meta-learning with hybrid autoML can play an important role with regards to the repsentations of such a system. However, there is a scarcity of re-search on the assessment of the practical usefulness of the new rep-resentations for automatic mode as well as model selection on single
- 4 -
formal support including the use of more generic knowledge about
various ML methods and formal verification are required, and
appro-priate tools facilitating the automatic selection and analysis of an appropriate algorithm for big data ML tasks are necessary.
The contributions in this thesis helps create a simple and less time-consuming hybrid-autoML system, which is beneficial in the sub field of autoML, and the data science and ML research community at large.
1.3
Aims and Contributions
Our research hypothesis is that the hybrid big data autoML model signed in this thesis, supported by an appropriate toolkit can
de-liver an effective approach to automatically determine the best ML mode and model that can yield the best accuracy, given a heterogene-ously large dataset, limited resources (i.e. limited time) and
knowledge about various ML methods. To validate this hypothesis, a generic methodology involving both theory and practical research is employed. The main aims of the study are as follows:
Aim-1, Theory: To provide a formal foundation for hybrid autoML
con-cepts, involving the extension of current formalization and proofs of several results concerning model selection which hence govern the correct use, manipulation and analysis of var-ious types of autoML abstraction.
Aim-2, Toolkit: To develop a platform for uploading single or
multi-varying datasets and provide automatic decision learning on the ML mode to use, dedicated auto ML model selection, training, prediction and analysis for all the datasets on the fly.
Aim-3, Evaluation: To assess the utility of hybrid-autoML models on
practical use-cases faced by experts in the field.
With regards to Aim-1, we propose several additional properties of basic autoML structure incorporating meta-learning. We provide new learning execution semantics for varying multi dataset variants, and
we design algorithmic functions for automatic clustering (an
‘auto-Prob’ function), automatic classification model selection (a generic
rule based ‘model selection’ function) and the simulation of conven-tional ML for multi datasets. We extend the existing basic autoML model concept for Auto-Weka (Kotthoff, Thornton, Hoos, Hutter, & Leyton-Brown, 2017) to formally support alternative representations of a given behavior based on some ideas in meta-learning research and in auto-sklearn (Feurer et al., 2015).
- 5 -
The new structure allows one to model multiple alternative scenarios that can occur in practice. We also extend basic meta-learning algo-rithms to support new generic knowledge representations. We formally describe how the hybrid autoML model saves time in the first
in-stance for any user of the toolkit, by pointing them to what ML al-gorithm they can start exploring.
We present a novel automatic clustering selection algorithm, that can take a decision to choose between existing clustering algorithms in Weka or use an autoProb clustering function designed based on varying distance/similarity measures e.g. Euclidean distance. We
in-vestigate the unfolding of a less complex solution that isn’t
primarily focused on considering the set of the hyper parameter space, but simply on using general knowledge about different
learning schemes and more generic features of the data to learn and automatically build models on various datasets from different domain sources. Such an unfolding contains a representation of all the pos-sible running processes. We provide an algorithm for the construc-tion of the unfolding.
In pursuit of Aim-2, we develop ‘Hybrid-autoML’, which is an open
source tool for automatic learning mode, model selection, and model analysis. The tool is implemented as a Java based application or
command line (CLI) platform which provides a flexible and extensible
framework for the development and analysis of simple conventional auto ML for multi-datasets. Hybrid-autoML provides a user-friendly graphical interface that facilitates single or multi-datasets entry, supports visual simulation of various ML scenarios (e.g. presence of large labelled training data with little unlabeled test data, small unlabeled data with no specific training dataset, large unlabeled data with no training data, etc.), facilitates predictions, and in-tegrates a set of analysis tools from Weka application programming
interface (API). More specifically, for automatic model learning we
implement the essential functionalities for their creation and visu-alization on multi-datasets, as well as facilities for their
simula-tion, error analysis, performance verification and evaluation. We
im-plement rule-based algorithms for visualizing dataset properties, choosing target features for model build consistency and estimating missing data information.
With regards to Aim-3, we apply ‘Hybrid-AutoML’ to five different
practical ML scenarios related to big datasets to assess the practi-cality of the model.
- 6 -
1.4
Outline of the Thesis
The rest of the thesis is organized as follows.
Chapter 2 presents a detailed literature review on big data machine learning, classification and clustering principles and tools (e.g. Weka) in the ML research community and presents detailed discussions on the algorithm selection problem and how meta-learning formalism can be used to help resolve the algorithm selection problem. Finally, it presents discussions on autoML and a comparison of some of the current state of the art autoML related works and tools.
Chapter 3 defines all methods used in this thesis and presents a de-tailed discussion of all pre-design experimentations including the setup, algorithms considered, problems identified, and knowledge gained during the experiments. The identified prob-lems and knowledge gained in this chapter, served as the basis for the design and modelling in the next chapter.
Chapter 4 describes the Hybrid-AutoML system’s design, architecture,
components, and characteristics, and presents the theory and algorithms for Hybrid-AutoML based unfolding. It also outlines the design framework and describes additional tools that have
been added or used for the models verification, simulation and
analysis.
Chapter 5 discusses the results obtained and analyzed from using the Hybrid-AutoML toolkit on five different practical use cases. Chapter 6 summarizes and concludes the work and proposes directions
for further work.
1.5
List of Publications
Portions of the work within this thesis have been documented in the following publications:
Conferences/Workshops
1. Ighoroje, L., Lu, J., & Xu, Q. (2016). Hybrid
classifica-tion system design using a decision learning approach and
three-layered structure - A Meta learning paradigm in Data
Min-ing. In J. Gołuchowski, M. Pańkowska, C. Barry, M. Lang, H.
Linger, & C. Schneider (Eds.), Information Systems Development: Complexity in Information Systems Development (ISD2016 Proceed-ings). Katowice, Poland: University of Economics in Katowice. ISBN: 978-83-7875-307-0.
- 7 -
Summary
We have provided in this section some background introduction into designing big data classification system, shown what the values and research focus in this thesis are, discussed the aims and
contributions made in this thesis, and provided an outline for the rest of this thesis. More specifically shown is that, in designing highly efficient and robust big data classification systems, the algorithm selection problem and the time data scientists spend in building ML models can be greatly reduced by engaging the sub fields of autoML and meta-learning. In addressing the limitations of some state of the art autoML systems discussed in the next chapter, this research thesis considers the following contributions:
1.An algorithmic function for automatic learning mode selection.
2.An algorithmic function for automatic clustering model
selection, with a new added function into the mix of available Weka clusterers called autoProbClass for class clustering, using euclidean distance estimation.
3.A toolkit that supports authomatic ML model selection on single
or varying multi-datasets, depending on the user scenario. Using a less complex solution that isn’t primarily focused on
considering the set of the hyper parameter space, but simply on using general knowledge about different learning schemes and more generic features of the data to learn and automatically build models on various datasets from different domain sources.
4.Saves model build time for multi-datasets ML tasks.
5.Is highly extensible and flexible.
In the next chapter, we provide more detailed discussions on ML and autoML concepts, methods, techniques and tools from state-of-the-art literature reviews.
- 8 -
Chapter 2
2
Literature Review
Introduction
This Chapter provides discussions on what is already known in the area of this research. Touching particularly on the key concepts, theories, and factors and how they are relevant to this research. Some inconsistencies, limitations and problem in existing
literatures are discussed. Discussions on why some of these
limitations and inconsistencies occur, how the knowledge relates to this research, as well as issues still yet to study effectively is carried out. Finally, it sets the basis for what contributions this research makes and who will benefit from such a study.
2.1
Big Data Machine Learning
Data science is a science used to tackle big data and comprises of data cleansing, preparation and data analysis. Big data is a term
usually discussed in terms of Volume, Variety and Velocity (3 Vs).
Definitions and discussions on big data can be found in (Chen, Mao, & Liu, 2014; Fan & Bifet, 2013; Mahmood & Afzal, 2013; Small, 2013). There are numerous benefits of big data, which have been discussed over the years in different literatures, some of which include: increased efficiency, better and improved services in different sectors e.g. healthcare, e-commerce, security etc. Datasets from multiple sources are gathered and then machine learning, predictive analytics and sentiment analysis are used to extract vital
information from the collected datasets. The field of data science acts as an umbrella under which data mining, data analytics, machine learning and various other related subject areas are included.
Machine Learning (ML) as one of the subject areas in the field of data science is described as the act of applying algorithms to data, in order to learn from it and then predict future trends in any
topic or domain area such as the health domain. It focuses mainly on the application of algorithms and statistics to the data as opposed to data science which is the term used when referring to the whole data processing practise. Machine Learning comprises supervised learning (data classification) and unsupervised learning (data
clustering) schemes. The characteristic of big data brings about new challenges and opportunities for classification algorithms, giving rise to a new era of classification algorithms that will be able to
address and handle the challenges of velocity, variety and volume
that comes with big data. One of which is proposed in this research thesis.
- 9 -
2.1.1
Big Data Classification Related works
The challenges that big data characteristics bring have led to new trends of classification algorithms to help address the challenges for effective data classification of big data. A lot of literatures are available on classification algorithms which is useful for big data classification. However, this section will focus on discussions of literatures that employ classification algorithms to address the velocity, variety & volume challenges of big data. Secondly,
discussions on literatures that employ auto classification algorithms are carried out. Finally, Literatures that use semi-supervised classification techniques are discussed.
To address the velocity challenge of big data, ‘online streaming
classification algorithms’ are being proposed and developed, while
for addressing the challenges of variety, ‘heterogeneous machine
learning’ or ‘multi-view classification for data heterogeneity’
algorithms are designed. For addressing the challenges of volume,
much efforts are being made to scale up existing classification algorithms. Some algorithms however address either one or two of these challenges. Nevertheless, it is seemingly difficult to see an evolving, automatic, semi-supervised, hybrid probabilistic big data classification algorithm that can address the three challenges at the same time and in a simple and effective manner, like the one being proposed in this thesis.
A survey of stream classification algorithms is conferred in (Charu C Aggarwal, 2014c). In 2005, the authors in (Law & Zaniolo, 2005), proposed an adaptive nearest neighbour classification algorithm (ANNCAD) for data streams.
In more recent times however, (Bertini & Zhao, 2013) present a graph-based algorithm to discourse the problem of moderately
labelled streaming data. Their algorithm extends a semi-supervised K-associated optimal graph algorithm (KAOGSS) and a purity measure transductive algorithm (PMTLA), which is also a graph-based model. The accuracy and processing time of the algorithms extended, where tested with real and artificial streams of data and the results compared. This differs from the proposed algorithm in this research in the sense that the proposed algorithm in this thesis incorporates concepts from an unsupervised probabilistic Bayesian classification method called autoClass (Cheeseman, Self, Kelly, & Stutz, 1996) and concepts from supervised rule-based methods.
Another interesting work is presented in (Sheikholesalmi, Mardani, & Giannakis, 2014), for the classification of streaming incomplete big data sets. A systematic model suitable for streaming big data, which makes use of the core low-dimensionality of feature vectors to design an SVM classifier that can handle relevant feature misses, is discussed. It is developed on the instinct that errors can be added using the core low-dimensionality of feature vectors, likewise the
- 10 -
basic comparisons amongst data instances of similar class.
Stochastic alternating minimization is used to design an online solution that renders the proposed approach operative for big scale dataset with probably numerous features. Computational challenges
where mitigated by developing a first order ‘stochastic sub-gradient
descent (SGD)’ structure for classifier update. However, their proposed design is quite a complex classifier for online streaming data.
The identification stage of the two stage, real time fault
detection and identification system proposed in (Costa, Angelov, & Guedes, 2015) shows promising applicability to on-line streaming
uses. The first stage in their approach is the fault detection,
which is founded on the notion of the density in the data space for detection and measure of abnormalities. The second stage is the
identification/classification, which is founded on a self-evolving
fuzzy rule based (FRB) classifier system called the ‘AutoClass’. It
is a fully unsupervised rule-based classifier, where the learning phase starts from scratch with no need for pre-specified parameters (e.g. the fuzzy rules or the number of classes). The number of
classes grows on its own with new class labels added automatically when there is a detection of considerable abnormalities. The
autoClass can easily evolve an existing initial rule base. The autoClass works with the concept of data clouds and the structure follows the idea of an AnYa FRB (Angelov & Yager, 2012) classifier.
A ‘zone of influence’ user definition is the starting point of the
autoClass Algorithm. The rule base is completely empty at the start (i.e. there is no predefined rule, class label, number of steps, etc.), it is only after construing the first data instance, a data
cloud class nc is created and a corresponding class label classl
added (this completes the first inference rule). For subsequent iterations, autoClass works with the existing FRB, updating the current rules and adding new ones when needed. New classes are formed over time and a certain number of closely related
abnormalities are grouped together to create a new cloud class. The autoClass classifier developed by the authors is similar in a way to the one designed in this research thesis in the sense that it is an autonomous and self-evolving classifier, where a new class is
created if one doesn’t already exist for an incoming dataset.
However, the one described in the literature is a fully unsupervised fuzzy rule-based classifier that depends on a previous fault
detection stage that uses the concept of density (Recursive Density Estimation) in the data space to determine all possible faults (this concept of density used is not the same as probability density
function). Secondly, the autoClass algorithm begins with a
definition of an initial ‘Zone of influence’ by the user. Lastly,
even though the autoClass classifier looks promising for resolving
the velocity (i.e. online streaming capability) and volume (i.e. it
is scalable) challenges of big data, it does not fully address or
provide suggestions for resolving the variety challenges also
- 11 -
developed in this thesis is a system that combines both supervised and un-supervised learning models, employing also the concept of evolving and automatic classification, as well as a hybrid
classification method that combines various traditional
classification algorithms such as Naive Bayes (Probabilistic) and Rule-based technique, which will help address the challenges of
velocity, variety and volume that big data classification is faced
with.
A similar fuzzy rule-based classification system to handle imbalanced big data is proposed in (Krawczyk, Stefanowski, &
Wozniak, 2015), the authors aimed to get a system that is capable of handling imbalanced big data with good accuracy and no increase in the run time. They make use of the MapReduce Framework to deal with big data as well as considered the implementation of cost-sensitive learning. However, their intentions, the algorithms did not pass the scalability test for use with big data and the overall performance was poor.
Another similar evolving rule base classifier as described in (Costa et al., 2015) is the parsimonious classifier (pClass)
proposed in (Pratama, Anavatti, Joo, & Lughofer, 2015). It applies a fully unsupervised method to drive its learning engine from scratch and can be easily used with online streaming instances.
In (Tekin & van der Schaar, 2013), the authors introduced a
distributed online learning framework for the classification of big data from different data sources. The data is treated by a set of heterogeneous distributed classifiers. The classifiers operate in a discrete time setting where various events such as: a data stream with a specific context arriving to each classifier, each classifier makes use of its own classification function or other classifiers to create a label, etc. The authors assume the creation of a binary label. Probabilistic classifiers such as the naive Bayes classifier were among the set of classifiers used. However, the results of their experiments from running two different simulations on network
security data failed to pass performance test based on classifier’s
accuracy.
In (Achcar et al., 2009), a system (AutoClass@IJM) for Bayesian classification of varying data in biology is developed. This system was made with a web interface to AutoClass, a prevailing
unsupervised Bayesian classification scheme (Cheeseman et al., 1996) that forms part of the basic idea employed in this research. The AutoClas@IJM however, required a lot of human efforts e.g.
preparation of the input data, sending the data files, providing an email address where the URL to the results is sent. It is also not very scalable to use with very large data sets, due to the return time involved.
- 12 -
A similar consideration of AutoClass is seen in (Pizzuti & Talia, 2003), where a parallel version of autoClass algorithm (P-AutoClass) is performed on distributed memory multi-computers. The algorithm divides the classification task among the processors of a parallel machine. This method of parallelization is meant to increase the speed at which classification results are obtained. P-autoClass is also intended for scalability in mining large data sets. Both a theoretical and experimental performance model of the algorithm is carried out. Which the authors use to prove that parallel processing of a classification process (especially if performed on multiple processors) speeds up the classification task. Therefore, making parallel implementation of classification or clustering algorithms very attractive when dealing with big data.
2.2
Classification and Clustering
Machine Learning algorithms can be divided into mainly two broad categories, namely classification and clustering. These are
discussed in the following sections below.
2.2.1
Data Classification & Regression
Data classification (sometimes referred to as supervised learning) is a data mining process of allocating data into one or more
categories. Traditional concepts of classification involve a process deriving a classification model from pre-labelled data instances and then applying this model to correctly predict the class label of un-labelled data instances in each dataset. Regres-sion on the other hand, is data classification that focuses on pre-dicting a quantity as opposed to a class label. A data instance can be classified into one of two or more classes. When two classes are involved it is often referred to as binary classification model, while when there are more than two classes it is referred to as
multi-class classification. We refer to a classification model which has several classes assigned to a data instance as multi labelled. Some traditional classification methods are not flexible & scalable enough to handle large datasets or changes for which they were not previously trained to handle. Also, data scientists and machine learning experts tend to spend a huge amount of time deciding on which machine learning scheme and algorithm to select for a given dataset. Which is due to an enormous amount of supervised classifi-cation algorithms and a lack of more generic and robust automated machine learning systems in place to help them achieve this goal.
Traditional data classification algorithms normally comprise of two phases:
2.2.1.1
Training phase:
This is where a model is constructed from the pre-labelled training instances. However, there are some classification methods where the
- 13 -
training phase may be replaced with a pre-processing phase instead. For example: nearest neighbour classifiers (Yunck, 1976), auto
classifiers (Cheeseman et al., 1996) etc. It has been observed from state of the art ML systems, that to obtain good classification results often requires a large labelled training dataset, which is not always available to the users.
2.2.1.2
Testing phase:
In this phase, the function derived from the Training Phase is applied to a new unlabelled data instance, and a label (in a classifier) or quantity (in a regressor) is generated for that instance. However, it is important to note that the classification process itself usually comprises of more phases. For example, the classification process may usually start with a data mining task such as feature/attribute selection (which may consist of a pre-processing or filtering phase to remove irrelevant features and ensure that the data is in the right format needed).
A classification algorithm outcome may be represented for a test instance in either two ways:
- A Discrete label.
- A Numerical score which can be changed to a discrete label.
2.2.2
Data Clustering
Clustering differs from classification in that it uses similarities
between feature variables to perform separation into groups without
prior understanding of the group structure (i.e. it uses unlabelled
data) (Aggarwal & Reddy, 2013; Jacques & Preda, 2014; A. Jain,
Murty, & Flynn, 1999). While for classification, the separation is
done based on a training data set that translates information about
the structure of the groups (i.e. it uses labelled data) (Charu C.
Aggarwal, 2014; Fabrico, 2014; Sokal, 1974). Clustering is referred
to as unsupervised Learning. In recent decades however, a hybrid
category emerged with the attention of the masses, which is referred
to as the semi-supervised learning (Sinha, 2014). It is a
combination of both the supervised and unsupervised methods thus allowing the use of both labelled and unlabelled data for learning the class label of a new data input. It is a very promising method to use when dealing with the classification of big data, because it can handle the classification process effectively with only a small number of labelled instances and a large set of unlabelled instances (which is usually the case with big data). Semi-supervised method helps bridge the cost overhead limitation (having to label a large set of data, can be very costly) of the pre-labelling process in supervised methods, and the limitation of the unknown (which increases the error rate) in the unsupervised methods.
- 14 -
The usefulness of class labels e.g. intrusion activity may be represented as a class label (supervised event detection),
multimedia data analysis, biological data analysis, medical disease diagnosis, etc. are numerous.
Broad categories of data classification include:
- Technique-centred e.g. probabilistic, decision trees,
rule-based method, neural networks, nearest neighbour, Support Vector Machine (SVM) methods, etc.
- Data-type centred e.g. text, multimedia, metadata, time series,
sensor data, discrete sequence, network data, big data etc.
Different data types may require the design of different methods, with each been quite different. This research thesis is based mainly on the classification of big data type but the classification model designed will be scalable enough to apply on other data-types.
Discussions on big data can be found in (Akerkar, 2013; Chen et al., 2014; Fan & Bifet, 2013; Suthaharan, 2014; Tankard, 2012).
- Classification Analysis Variations: e.g. semi-supervised
learning, transfer learning, active learning, etc. Semi-supervised analysis variation is considered in this research.
2.2.3
Classification Methods
Before most classification methods are applied to a dataset, a method known as feature selection is often used. Data classification methods often used include:
- Decision trees - Rule-based methods - Probabilistic methods - SVM methods - Instance-based methods - Neural networks
These methods along with the feature selection method will be discussed briefly below.
2.2.3.1
Feature Selection
Feature selection is a method which is usually the first phase of almost all classification tasks. It is critical to use the correct features during the training phase as this will help improve the classification results. However, the use of many features tends to decrease performance of the system. The two most general supervised
feature selection methods include: - Filter models (here the
technique is independent of the classification algorithm) and
Wrapper models (here the process of selecting features is inserted
into a classification algorithm and made profound to the
classification algorithm, this tactic distinguishes the fact that diverse algorithms may work well with diverse features). When using
- 15 -
Filter models, we must be able to measure the significance of a
feature to the classification method with some form of evaluation
measure. Other feature selection methods include the unsupervised
feature selection method (no class label involved), semi-supervised
method (which makes use of both labelled and unlabelled data to estimate feature relevance). Feature selection could be done from either flat features, streaming features or structured features. More details on feature selection methods, algorithms and
applications is found in (Charu C. Aggarwal, 2014; Alelyani, Tang, & Liu, 2013; Forman, 2003; Haralick et al., 1973; A. K. Jain & Waller, 1978; Kwak & Choi, 2002; T. Li et al., 2004; Huiqing Liu, Li, &
Wong, 2002; Huan Liu & Motoda, 1998; Huan Liu & Yu, 2005; Mladeni'c & Grobelnik, 1998; Pal & Foody, 2010; Peng, Long, & Ding, 2005; Punch III et al., 1993; Tang, Alelyani, & Liu, 2014; Zhao & Liu, 2007)
2.2.3.2
Decision Tree Method
It has a tree-like separation of the data and the various
separations at the leaf level are related to the different classes.
Separation at each level is done using a split criterion. Either
univariate split (when a condition is placed on a single attribute) or Multivariate split (when a condition is placed on multiple
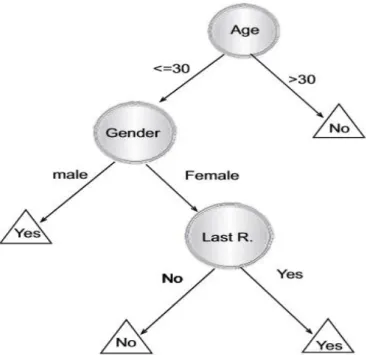
attributes) technique can be used. A basic decision tree example is seen in Figure 2.1 below. It shows a scenario which aims to
determine the response of prospective customers to direct mailing. The circles represent the internal/decision nodes (labelled with the test attribute) and the triangles represent the leaf node/class
label. Moving down the tree progressively from the root to a leaf allows instances to be classified accordingly and predictions made. The split criterion is usually applied on each internal node to determine what the output node is (which could be another internal node or a leaf node (which is usually a class)).
- 16 -
Figure 2.1: A simple decision tree that represents responses to direct mailing (Rokach & Maimon, 2010).
Decision tree methods are popular and provide human readable rules, but it is important to keep the tree and splits simple enough to ensure that both the understanding of and stability of the tree does not suffer. More details on the decision tree method and algorithms are discussed in (Charu C. Aggarwal, 2014; Esposito, Malerba,
Semeraro, & Kay, 1997; Lin, Yan, Yan, & Nan, 2008; Murthy, 1998; Nielsen, Rumí, & Salmerón, 2009; J. Ross Quinlan, 1986; Vens,
Struyf, Schietgat, Džeroski, & Blockeel, 2008). Two very popular decision tree algorithms are the classification and regression trees (CART) (Breiman, Friedman, Stone, & Olshen, 1984; Loh, 2011) & the C4.5 algorithm (J Ross Quinlan, 2014). A decision tree growth is exponential to the number of attributes and distinct values per attribute. Hence for large data sets, it has been a difficult problem finding a practical, globally optimal decision tree
solution. Some methods such as pruning of a decision tree to reduce
the complexity and attributes have been proposed in many literatures such as (Esposito et al., 1997). However, the pruning method limits the accuracy of the classifier at the expense of reducing
complexity. Also, the fact that a split criterion is required at each internal node of a decision tree (which has to match the
training set appropriately to ensure high accuracy) means that the practicability of applying a split criterion used for a particular data set on another would be a complex and costly task. This also implies therefore that one would require various split criterions or various tree classifiers incorporated together to achieve accurate classification of big data (which will increase the complexity of the model as well as increase the run time). Asides the limitation of having a split criterion at each internal node and the challenge
- 17 -
of growing a decision tree without making it too complex, another identified problem with decision trees is that in order to avoid inaccuracies it is hard predicting when to stop the tree growth. In cases where there is a tendency for many classes, unnecessarily large trees may result. Many standard decision tree algorithms such as the CART (Breiman et al., 1984) are deterministic in nature (i.e. if given the same input information, the same output information is produced with only one pre-determined outcome considered), as
opposed to the non-deterministic characteristic of the approach proposed in this thesis (i.e. where more than one possible outcome is considered even if give the same input information). Another limitation is that to decide the succeeding split, decision tree induction (i.e. building a decision tree automatically from a given data set) will need to compare all potential splits. Most standard decision tree algorithms are mainly supervised learning methods where it is compulsory to have a set of pre-labelled training data sets from which the tree can be built, and the accuracy is highly dependent on the amount of labelled test instances available. Having a large set of pre-labelled training instances is not the case in the real world, as the process is quite a costly one.
2.2.3.3
Rule-Based Method
Are methods like the decision tree method but differs in the sense that it allows overlaps (i.e. there is no strict hierarchical
separation) to create a very robust training model. Some path in a decision tree may be understood as a rule which allocates a test instance to a specific label. For example, from the decision tree in
Figure 2.1 above, the rule “if a customer’s age is greater than 30,
then the customer will not respond to the mail” can be deduced from
one of the paths. Rule-based methods have the advantage of being simple, easy to explain and understand, can be easily improved by
addition of more rules, etc. Logic forms (e.g. IF-THEN statements)
can be used to represent the rules which human beings can easily understand. They can be seen as more general models than decision tree models. For rule-based methods, a set of rules is extracted from the training data in the training phase. Then in the testing phase, the rules which are important to the test instance are
determined and the final output is based on a mixture of the class values anticipated by the various rules. Resolution methods should be designed as well, in order to resolve possible rule conflicts on a test instance. For example, a method of prioritizing the rules is a good resolution strategy to avoid conflicts. More in-depth
discussions on rule based methods are seen in (Charu C. Aggarwal, 2014; Angelov & Yager, 2012; M. Jain et al., 2013; X.-L. Li & Liu; Nosofsky & Little, 2010; Pratama et al., 2015; Tung, 2009). Two
well-known rule-based classification techniques is the rule
- 18 -
induction algorithms, a small set of rules is developed straight from the data. Two fundamental rule induction algorithms in the literature are the CN2 Induction Algorithm (Clark & Niblett, 1989) and RIPPER (Cohen, 1995). In the CN2 algorithm, each rule is learnt without assigning a class for each iteration. While in the RIPPER algorithm, all the rules pertaining to a class is learnt first before the all the rules of the following class is learnt. RIPPER has been employed mainly for classification of text. To achieve high accuracy, majority of the traditional rule induction algorithms e.g. CN2, RIPPER, etc. frequently contain a lot of conditions, thus
making the rules unnecessarily long and hard to work with.
Association rule classification proposed in (Ma, 1998) and in (Zhang & Zhang, 2002). It can help in detecting association rules from huge amount of data. Class association rules (CARs) as proposed in (Ma, 1998) is an example. It is required that the output of a CAR be a class label. Rule induction models identify only a subset of the rules needed for classification while classification based on
association rule mining detects all the rules in the data. The rule-based methods on their own are quite slow and the rules could be sometimes misleading if proper care is not taken. This is because often the rules in the rule list are dependent of each other. A limitation of using only rule-based method for big data
classification is that the quality of a rule may vary between data instances, therefore limiting the accuracy of the results. Also, we will be faced with the challenge of wasting meaningful time in
generating a long rule list (as generated from rule-based induction methods) instead of just having basic generalized rules that can be applied on all instances. Or we will be faced with the challenge of detecting all the rules present (as observed with CARs). Though detecting all the association rules of big data will help improve the classification of an input instance correctly, it may however involve a high run time.
2.2.3.4
Probabilistic Methods
These are very common and fundamental amongst data classification methods. They make use of statistical interpretation to find the best class for a given sample. Probabilistic classification
algorithms will often output an equivalent posterior probability
𝑝(C|𝑥) for each of the possible classes a test instance may belong to (Charu C. Aggarwal, 2014).
Posterior probability: conditional probability obtained after
considering precise features of the test case.
Prior probability: probability distribution of training records
that belongs to each specific class.
The two basic ways that the posterior class probability is estimated:
- 19 -
- Through defining the class conditional probabilities 𝑝(x|𝐶) for
each class (C), after which the prior class probability 𝑝(𝐶) is
then inferred and Bayes theorem used to determine 𝑝(C|𝑥).
- By modelling the joint distribution 𝑝(𝑥, 𝐶) directly and then
normalizing it to obtain the 𝑝(C|𝑥).
We have both generative probabilistic models (where the joint
distribution of inputs and outputs are modelled implicitly or
explicitly) and discriminative probabilistic models (where a
discriminative mapping function (equation (2.0)) is learnt and used to model the posterior probabilities directly). A comparison of both generative and discriminative models is discussed in (Jordan, 2002).
Examples of the probabilistic generative model for classification is
the ‘Naïve Bayes Classifier’ (Murphy, 2006) and the ‘Hidden Markov Model’(Blunsom, 2004; Rabiner, 1989).
𝑓(𝑥) = 𝑝(𝐶|𝑥) (2.0)
Simplification of the Bayes model is what leads to the Naive Bayes hypothesis (John & Langley, 1995). It is not only simple and fast but also commonly applicable. Its aim is to create a rule that will permit assigning imminent instances to a class with an assumption of attributes independence after establishing probabilities (Triguero, García, & Herrera, 2013). Examples of popular probabilistic
discriminative model is the ‘Logistic regression’ model and the
‘Conditional Random Fields’ model.
Logistic Regression model is formally defined as:
𝑃 (𝑌(𝑇) = 𝑖(𝑋) = 1
1 + 𝑒−𝜃𝑇𝑋) (2.1)
- (Charu C. Aggarwal, 2014; W. Liu, Liu, Tao, Wang, & Lu, 2015;
Tortajada et al., 2015),
- Where θ is the parameters vector to be measured.
A diversity of other probabilistic models are also known in
literature, e.g. probabilistic graphical models (Koller & Friedman, 2009), and conditional random fields (Lafferty, McCallum, & Pereira, 2001). More on probabilistic methods is discussed in (Bishop, 2006) and (Alsallakh, Hanbury, Hauser, Miksch, & Rauber, 2014; Azar & El-Said, 2013; Bankert, 1994; Iounousse et al., 2015; Lu et al., 2010; Lukasiewicz, 2008; Maravall, De Lope, & Fuentes, 2013; Murphy, 2012; Nielsen et al., 2009). Some common advantages of the probabilistic models observed in the literature include:
- 20 -
- The fact that each class’s associated probability can easily qualify as a value of confidence of the input instance belonging a class.
- They can be easily and successfully incorporated into larger
machine learning tasks while partially or totally avoiding the problem of error propagation.
Some limitations of traditional probabilistic model are:
- Majority of the models are deterministic in nature and do not
consider other choices such as being able to adjust to change in the middle of model build.
- They are mainly for supervised learning where there is a high
dependency on pre-labelled data instances at the
learning/training phase. Although, to be adaptable for unsupervised classification or semi-supervised classification, they need enhancement and optimization.
- On their own they cannot effectively handle at the same time all
three challenges (i.e. volume, variety and velocity) that big
data brings. However, combining them with other methods (e.g. decision trees, SVM, etc.) and techniques to achieve a relatively high classification performance of big data is useful.
These limitations and many more are part of the reasons that researchers are constantly studying and experimenting on ways to build or enhance these traditional classification methods to handle evolving real-world situations effectively.
2.2.3.5
SVM Method
This classification method may be well-thought-out as a single level decision tree with a very carefully selected multivariate
split condition (Charu C. Aggarwal, 2014). It uses linear conditions to separate the classes from one another as much as possible (Cortes & Vapnik, 1995; L. Li, 2015). Kernel methods (using similarity
measures between two objects) are used for general non-linear SVM learning methods (Schölkopf & Smola, 2002). One important criterion for SVM is to achieve maximum margin separation of the hyper planes. An advantage of the kernel methods is its ability to be extended to random data types and its quality of generalization (Leiva-Murillo et al., 2013). A downside to SVM method is that if the numbers of attributes are much more than the numbers of samples, SVM methods are likely to perform poorly. Also, they are slow and do not
directly make available probability estimations. The probability estimates are calculated using cross-validation techniques which in practice are quite expensive. A method to optimize the speed of SVM classifiers has been proposed in literatures such as (Fischetti, 2015). But the authors in a bid to optimize the SVM method with Gaussian Kernel, for it to run faster further created a NP hard complex problem. A method to map the SVM outputs into probabilities
- 21 -
is also discussed in (Platt, 1999). A survey on SVM methods and applications is observed in (Wang & Pardalos, 2015) while a comparison of SVM methods against other classification and
regression methods is seen in (Meyer, Leisch, & Hornik, 2003). SVM libraries (Chang & Lin, 2011) are also available for users to easily apply SVM method in their application. Another limitation of the SVM method is that it is designed mainly to be applied for a two-class situation, hence to use it for multi-class scenarios; one would have to apply reduction algorithms to reduce the multi-class model into numerous binary problems. This would likely increase the complexity of the model and the run time.
2.3
Testing the Performance of Classification Algorithms
The performance of most classification algorithms is usually
determined by a number of parameters or measures such as: accuracy
of the output, the integrity of the model, the run time of the
model, simplicity in terms of computational cost, etc. The most
fundamentally common one being accuracy of the results. There are
various methods that have being designed over the years for
evaluating the performance of classification systems. Validation methods are usually chosen, after which the classification model is built and then evaluation measures are used to describe how properly the classification performed with regards to other existing models.
Some methods for accuracy validation of a classification process include:
2.3.1
Hold-Out Method Validation method:
A statistical method that requires the data is split into two segments (one for training the classifier and one for testing the classifier). The training data set is usually larger than the test data set. A disadvantage of this method is that the test is
performed on a smaller portion of the data, thus increasing the
tendency for false accuracy measurements (Charu C. Aggarwal, 2014).
2.3.2
Cross Validation method:
To address the problems of the hold out method, a more logical approach to the hold out method eventually got developed. It is known as the cross validation method (Refaeilzadeh, Tang, & Liu, 2009), which involves the data being split equally and the hold-out evaluation method is performed two times by using the training data set from the first iteration as the test data set in the second
iteration and vice versa. The simple form of the cross validation is the k-fold cross validation.
2.3.3
Bootstrap method:
Creates bootstrap dataset by sampling with replacement the original dataset. This bootstrap data set is what is then used to build the