ISSN (print): 1978-1520, ISSN (online): 2460-7258
DOI: https://doi.org/10.22146/ijccs.46561 409
Outlier Detection Credit Card Transactions Using Local
Outlier Factor Algorithm (LOF)
Silvano Sugidamayatno*1, Danang Lelono2 1
Master Program of Computer Science, FMIPA UGM, Yogyakarta, Indonesia 2
Department of Computer Science and Electronics, FMIPA UGM, Yogyakarta, Indonesia e-mail: *1
[email protected],
[email protected]Abstrak
Ancaman atau fraud bagi pemilik kartu kredit dan pihak bank sebagai penyedia layanan banyak dirugikan oleh tindakan para pelaku pembobol kartu kredit. Semua data transaksi telah tersimpan dalam database bank, namun masih sebatas informasi dan belum dapat digunakan sebagai pengetahuan. Pengetahuan yang dibangun dengan data transaksi kartu kredit dapat dijadikan sebagai peringatan dini oleh pihak bank. Metode outlier analysis digunakan untuk membangun pengetahuan tersebut dengan algoritme local outlier factor yang memiliki hasil accuracy, recall, dan precision yang tinggi dan dapat digunakan pada data multivariate. Pengujian menggunakan metode sampel dan confusion matrix dengan atribut date, category, amount, dan state. Hasil pengujian menggunakan 1803 data transaksi dari lima nasabah, menunjukkan bahwa rata - rata nilai akurasi algoritme LOF (96%), lebih tinggi dibandingkan rata - rata nilai akurasi algoritme INFLO dan AVF (84% dan 77%).
Kata kunci—kartu kredit, outlier analysis, algoritme local outlier factor Abstract
Threats or fraud for credit card owners and banks as service providers have been harmed by the actions of perpetrators of credit card thieves. All transaction data are stored in the bank's database, but are limited in information and cannot be used as a knowledge. Knowledge built with credit card transaction data can be used as an early warning by the bank. The outlier analysis method is used to build the knowledge with a local outlier factor algorithm that has high accuracy, recall, and precision results and can be used in multivariate data. Testing uses a matrix sample and confusion method with attributes date, categories, numbers, and countries. The test results using 1803 transaction data from five customers, indicating that the average value accuracy of LOF algorithms (96%), higher than the average accuracy values of the INFLO and AFV algorithms (84% and 77%).
Keywords—credit card, outlier analysis, local outlier factor algorithm
1. INTRODUCTION
Credit card to perform various transactions easily, do not close the possibility of threats that can harm or fraud. Based on data from Identity Theft Resource Center (ITRC) and CyberScout, credit card identity theft in the United States at the end of June 2017 increased by 29%. The ITRC estimated the increase from 1091 cases in 2016 to 1500 cases in 2017, with total losses generated around $2530 to $3073. The law governing this criminal activity has been established, if the boycott made a loss of $500 then the amount of the penalty amounted to $1000 and if it exceeds $500 then a penalty charged at $25000 with a sentence period of 15
years imprisonment. The severity of the penalty for perpetrators did not make this criminal act dimmed, so the case raises the worries for the bank and the customer.
The bank as a credit card service provider has made every effort to handle the case, although the effort can still be preceded by the perpetrators. The delay in handling is the problem, the bank knows that the customer's credit card has been compromised after his client reported that the charge is not suitable for the use. All transactions that use credit cards to buy goods, pay installments, and other transactions, which are all stored in the database of a bank that will eventually become large data. The big data is used for a special purpose, then it takes one approach to dig knowledge with artificial intelligence, namely data mining.
Some experts state that data mining is a step analysis of the knowledge discovery process in the database or "knowledge discovery in Database " abbreviated to KDD. According to [1] data mining is a process that uses statistical techniques, mathematics, artificial intelligence, and machine learning to extract and identify useful information and knowledge related to a wide range of large databases.
Credit card breaches that occurred, having an average transaction pattern with the same resemblance, an anticipation case of credit card breach if possible, they will suppress the losses incurred. The lack of information technology involved in detecting the transactions made by the credit card boycott, all the data Transaski has been stored. The solution to the detection is not easy because special methods are needed. [2] use the K-Mean algorithm to group data into groups to detect outliers. [3] use a DB-SCAN algorithm with a density-based approach, to form data groups so as to find outliers.
During this time the outlier identification uses an algorithm used to retype data and is not specifically intended for detecting outliers. Based on the case encountered, algorithms are needed specifically to identify outliers, with high accuracy, recall and precision, and outlier detection of multivariate data. Local outlier factor (LOF) algorithms have been used by previous researchers to handle outliers detection on multivariate data and deliver high accuracy, recall, and precision. [4] in testing ten different datasets, which resulted in an average accuracy of 75.2%, with the highest accuracy of 98% and the LOF algorithm can be used to detect outliers in multivariate data.
[5] using the LOF algorithm to detect outliers in the computer network or computer network, generates an accuracy of about 84%. [6] in testing to detect outliers on Hongkong Street traffic datasets, the results of the accuracy test were generated around 96%. Based on the criteria set, the study used Algortime local outlier factor or LOF as an outlier detector. Focus from the research to identify transaction patterns by utilizing stored credit card transaction data. Identify the pattern using the outlier analysis method. Hope by using the LOF algorithm, it can identify outliers in credit card transaction data until it can be used as an early warning for the bank.
2. METHODS
2. 1 Data Collection/Retrieval
Collection or retrieval of data is done by visiting data. World website and doing a search from credit card transaction data, after finding the data searched then download the data. The document that is downloaded is an Excel document procurement-card-transactions-1q-2q-2017_1. The example dataset that is collected is shown in Table 1.
Table 1 Example dataset
2. 2 System Analysis
The built-in system can meet the requirements of a predefined system, as follows: 1. The system can display outlier data visualizations for each customer.
2. The system displays a set of transaction data from each client deemed to be an outlier by the system.
3. The user can change or add a minPts value to the LOF algorithm which is used as the parameter value.
4. User can do additions data or import transaction data with Excel format. 2. 3 Use Case Diagram
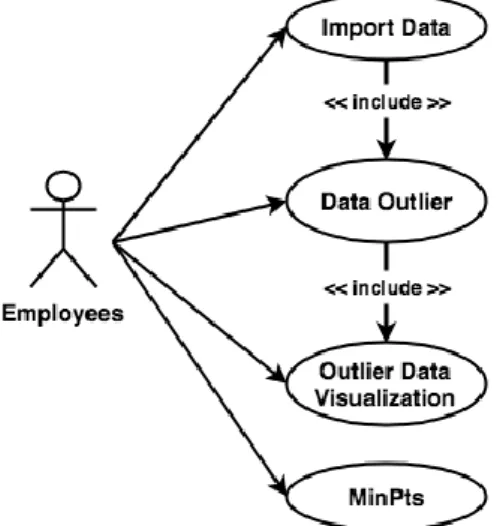
In the use case diagram shown in Figure 1, explaining That an employee can upload or import a collection of transaction data Done by some customers in Excel format. Data that has been in An upload will be inserted into the database, and then in the process Using the LOF algorithm. Outlier detection results in the form of data sets Outlier will be visualized. An employee can change and input Value of MinPts for the LOF algorithm aimed at limiting the range of Or the number of nearby neighbors used to define local The neighborhood of a data object.
Figure 1 Use case diagram 2. 4 System Outline
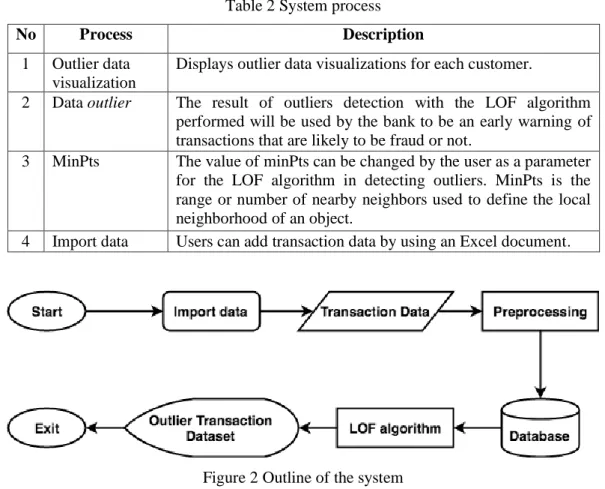
The built-in line of systems can display transactions that are considered outliers by the LOF algorithm, thus displaying them to the bank's employees. An explanation of the built system is shown in Table 2 and the flowchart of the system is shown in Figure 2 and Figure 3.
Table 2 System process
No Process Description
1 Outlier data visualization
Displays outlier data visualizations for each customer.
2 Data outlier The result of outliers detection with the LOF algorithm performed will be used by the bank to be an early warning of transactions that are likely to be fraud or not.
3 MinPts The value of minPts can be changed by the user as a parameter for the LOF algorithm in detecting outliers. MinPts is the range or number of nearby neighbors used to define the local neighborhood of an object.
4 Import data Users can add transaction data by using an Excel document.
Figure 2 Outline of the system
Figure 2 Explanation, displaying the transaction data set that is deemed outlier for each customer. The order of the process starts with importing data and then done preprocessing which includes data sanitization, data transformation, and data standardization. Preprocessing results are inserted into a database and subsequently in the process by the LOF algorithm. The result of the LOF algorithm process generates an outlier transaction data set and is display into a page that can be reviewed for each customer.
2. 5 Preprocessing
Preprocessing is a process of preparing data for the data mining process. The process of preprocessing is done, as follows:
2. 5. 1 Data Cleaning
Data cleaning is the process of eliminating or changing data that is worth null or missing value. The process of clearing the data on this research is done manually which fills in the empty value corresponding to the data attribute or directly deletes its data row. If the categorical attribute then that is taken is the most displayed value, while the numeric attribute will be assigned a value of one or a minimum value.
2. 5. 2 Data Transformation
Data transformation is a process to convert or merge data into the appropriate format, then processed in data mining. The data transformation process is done dynamically by the system at the time of outlier detection.
2. 5. 3 Data Standardization
Standardization or normalization of data is a process to normalize data when one of the attributes used has greater value or data than other attributes with the Z-score method. In this research, only the amount attribute in the standardization process, because the data amount has a value greater than the other attributes.
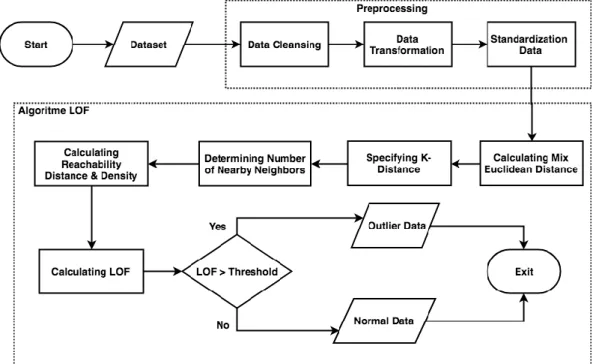
2. 6 Algoritme Local Outlier Factor
Based on [7] local outlier factor algorithm or LOF can used to detect outliers in a set of data and flowcharts of the LOF algorithm shown in Figure 3. The first phase of this algorithm requires input dataset, i.e. transaction data. Before the outlier detection process, first performed preprocessing that serves to ensure the data processed is good data so that the results of the outlier detection process result in high accuracy. The first stage preprocessing process is done cleaning data or data cleaning that serves to eliminate dirty data. The second stage in the preprocessing process is the transformation of data or transformation data that serves to change the data initially in the form of sentences or words into numerical form so that the data can be done calculation process.
Figure 3 Flowchart local outlier factor algorithm
The third stage in the preprocessing process is the standardization process or normalization of data that serves to normalize the data when one of the attributes used has greater value or data than the other attributes, with the method Score. The equation of the Z-score method is shown in Equation 1.
(1)
Equation description 1:xn : Row data to-n.
Aavg : Average rating from A record.
Next specify the K-distance value of each object, first calculating the spacing between objects with the mix Euclidean distance method. In this research, there are several rule or rule as distance calculation between data on date, category, and State attributes, as follows:
1. Date attribute
if (first row data date == second row data date & & data first row state! = second row data state) {value = 1} else {value = 0}
(2)
Equation description 2:
If the first row in the date attribute equals the second line data in the date attribute and the first row data in the state attribute is not the same as the second row data in the state attribute, then it is worth 1 (one) if not worth 0 (zero).
2. Category attribute
if (first row data category == second row data category) {value = 0} else {value = 1}
(3)
Equation description 3:
If the first row on the category attribute is equal to the second line of data in the category attribute, it is 0 (zero) if it is not 1 (one).
3. State attribute
if (first row data state == second row data state) {value = 0} else {value = 1}
(4)
Equation description 4:
If the first row in the State attribute is equal to the second row data in the state attribute, then it is worth 0 (zero) if it is not worth 1 (one).
In the amount attribute use the numeric spacing calculation using euclidean distance formula. The result of the mix Euclidean distance calculation is sorted ascending. Taking the below zero value is based on the value of minPts, then the value is looking for the greatest value and that's the value that is the K-distance value. Once the K-distance value of each object is determined, it determines the number of closest neighbors of the K-distance value.
After determining the closest neighbor of each object then calculate the reachability distance and reachability density. Before entering in the calculation of local reachability density, first, calculate the reachability distance from each object. The purpose of the reachability distance calculation is to ensure that all objects are in a homogenous environment and the LOF value will be more stable. When each object is in a uniform environment, even though the value of minPts changes. The equation of the reachability distance is shown in Equation 5.
reach-distk(p,o) = max(k-distance(o), distance(p,o)) (5)
Equation description 5 :
reach-distk(p,o) : Reachability distance from object p to o.
k-distance(o) : Value k-distance from object o. distance(p,o) : Distance from object p to o.
After the calculation of Reachability distance, then calculate the local reachability density of the p where reach-distk(p,o) is obtained from the previous calculation. The equation
of the Reachability density is shown in Equation 6. IrdMinPts(p)=1/( reachdistMinPts(p,o)/ NMinPts(p))
(6) Equation description 6 :
IrdMinPts(p) : Local density from each object p.
reachdistMinPts(p,o) : Reachability distance from object p to object o.
NMinPts(p) : Number of neighbors of object p or value of minPts.
Calculating the Reachability distance can be determined by retrieving the maximum value of the mix Euclidean distance result on the selected object and the K-distance value of the object. The determination of Reachability density values can be calculated from the first object by summing the specified Reachability distance value and divided by the value of minPts, and then divided by one. The final stage of the LOF algorithm process is calculating the LOF value of each object to determine the average density ratio of the Reachability local with its neighbor in one range shown in Equation 7.
LOFMinPts(p)=( IrdMinPts(o)/ IrdMinPts(p))/ NMinPts(p) (7)
Equation description 7 :
LOFMinPts(p) : Outlier degree of object p.
IrdMinPts(o) : The local density of objects o.
IrdMinPts(p) : Local density of object o.
NMinPts(p) : Number of neighbors of object p or value of minPts.
A LOF is a degree that determines whether an object is an outlier or not. The LOF is quoted into LOFMinPts(p) and is the average density ratio of the reachability of local p and
neighbor p in a single range. The count is done with the first object, and then summing the reachability density of each neighbor and divided by the first object's density Reachability value and further divided by minPts. The LOF value of each object, if more than the limit value, then the object is an outlier and if the LOF value is less than the boundary value then the object is not an outlier. The limit value is the average of the LOF values.
2. 7 References
Fraud pursuant to the Association of Certified Fraud Examiners or ACFE is defined as an act to enrich oneself through intentional abuse or use of organizational or asset resources. Another language of fraud is an act of illegal use of facilities that is deliberately done in various ways forms of cheating, fraud, or evasion by a particular person or organization. Losses caused by fraudulent action will make some Parties harmed. [2] using K-Mean algorithm to detect outlier on credit card transaction, the results of the research showed that the accuracy produced is relatively low. [3] using a density approach with DB-SCAN algorithm, the results of the research conducted are no different than previous researchers with other clustering approaches.
[8] detects fraud on credit card transactions with priority over time and number of transactions made by the customer of the credit card user. The results of the research, indicating the method used can well detect outlier on credit card transactions. [9] use the Manhattan Distance based algorithm to detect outliers in credit card transactions. The results of the research show that the Manhattan Distance-based algorithm approach can detect outliers well.
[10] use different methods of previous research with a clustering approach. In research conducted using classification approach with SVM algorithm as an outlier detector on credit card transaction. The results of the study showed that the SVM algorithm could classify the transaction data identified as outliers or not, but the built model is still weak because of the amount of data that only slightly use one hundred data.
3. RESULTS AND DISCUSSION 3. 1 Testing of LOF, INFLO, and AVF algorithms
Test result of LOF, INFLO, and AVF algorithmS using sample method and Confuision matrix in transaction data from five customers such as, Cassie Hunter with total data 721 transaction, Andrew Andrade with total data 351 transaction, Carina Orozco with Total 264 data transactions, Araceli Delgado Ortiz with a total of 245 transaction data, and Cindy Escobar with a total of 232 data transactions. The average test results of LOF, INFLO, and AVF algorithms with the transaction data of five customers, shown in Table 3.
Table 3 Average five customer test results
Test LOF INFLO AVF
Accuracy 0.96 0.84 0.77
Recall 0.98 0.9 0.79
Precision 0.93 0.69 0.62
Based on the test results in Table 3, explaining the average test results of five customers that have been done, the LOF algorithm is higher than other algorithms, which are 96% accuracy, 98% recall, and 93% precision. The lowest test results in the AVF algorithm are 77% accuracy, 79% recall, and 62% precision.
3. 2 Testing compute timing of LOF, INFLO, and AVF algorithms
The results of computational time testing of LOF, INFLO, and AVF algorithms using transaction data from five customers such as Cassie Hunter with total 721 data on transaction, Andrew Andrade with total data of 351 transactions, Carina Orozco with total data of 264 transaction, Araceli Delgado Ortiz with a total of 245 data on transactions, and Cindy Escobar with total data of 232 transactions. The average computational time test results from the LOF, INFLO, and AVF algorithms with transaction data from five customers, shown in Table 4.
Table 4 The average of five customer compute time testing results
Result LOF (Seconds) INFLO (Seconds) AVF (Seconds) Average 7.63 7.50 6.29
The conclusion of the computational time test results are shown in table 4, explaining the AVF algorithm faster than the other algorithm of 6,29 seconds. The results of the computational timing of the LOF algorithm are slower than the AVF algorithm of 7,63 seconds with a difference of 0,13 seconds with the INFLO algorithm. The addition of parameter values results in slowing compute time for all algorithms, although the degree of treatment for each algorithm is different when the parameters are added continuously.
3 .3 Testing attribute Combinations
In the test results by performing a combination of attributes on the credit card transaction data, aiming to get the best combination. Displays the highest accuracy, recall and precision results with a local outlier factor algorithm or LOF. Use of data for testing using transaction data from five customers such as Cassie Hunter with total 721 data transaction, Andrew Andrade with total data of 351 transactions, Carina Orozco with total data of 264 transactions, Araceli Delgado Ortiz with total 245 data transactions, and Cindy Escobar with total data of 232 transactions. The average result combination is the best attribute with the transaction data of five customers, shown in Table 5.
Table 5 Average test result combination of category, amount, and state attributes Testing Average
Accuracy 0.98
Recall 0.98
Precision 0.98
The conclusion of a combination of test attributes shown in Table 5, explains the average of the test results of category, amount, and state, which are 98% accuracy, 98% recall, and 98% precision.
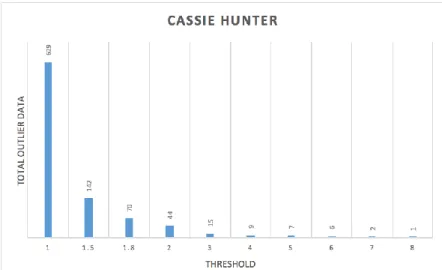
3. 4 Threshold Value
The threshold value on the LOF algorithm is a value that can declare a data outlier or not, if the value of the LOF is more than the limit value then the data is outlier and if less than the boundary or equal value, then the data is not outlier or data Normal. In the LOF algorithm, the increase in the continuous limit value will reduce the amount of outlier data in the outlier detection results. The following results:
Figure 4 Results of customer threshold value of Cassie Hunter
Based on the results of the experiment shown in Figure 4, Explain the increment of the limit value of Cassie Hunter transaction data from one To eight. At the limit value, one amount of data is outlier around 629 and at the time of the addition of the limit values continuously make the data detected only 1 data with a boundary value of eight. Experiments conducted by using 721 transaction data by input parameter minPts = 236.
Figure 5 Results of customer threshold value of Andrew Andrade
Based on the results of the experiments shown in Figure 5, explains the addition of the limit value of Andrew Andrade's transaction data from one to four. At the limit value, one amount of data is outlier around 183 and when the increment value of the limit continuously creates the data detected only 1 data with a limit value of four. The experiments were conducted using the 351 transaction data with the input parameter minPts = 340.
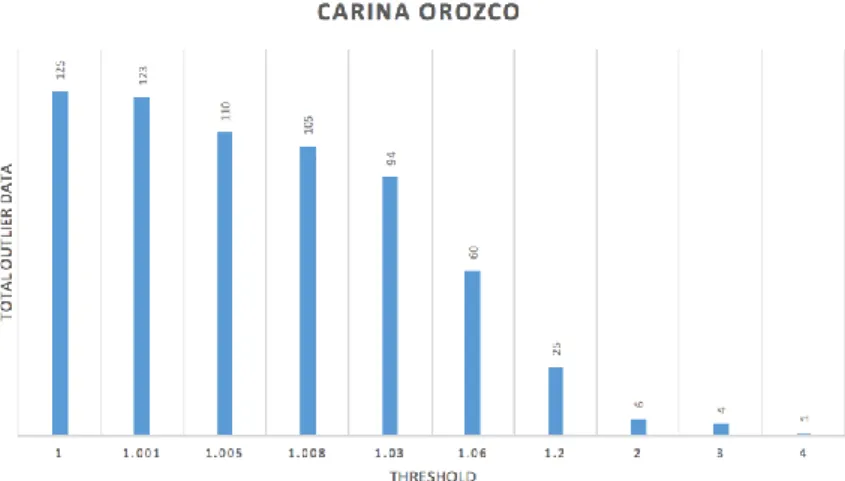
Based on the results of the experiment shown in Figure 6, explain the addition of the limit value of the transaction data Carina Orozco from one to four. At the limit value of one amount of data that is outlier around 125 and at the time of the increase of the limit rate continuously makes the data detected only 1 data with a limit value of four. Experiments conducted with using 264 transaction data by input parameter minPts = 180.
Figure 6 Results of customer threshold value of Carina Orozco
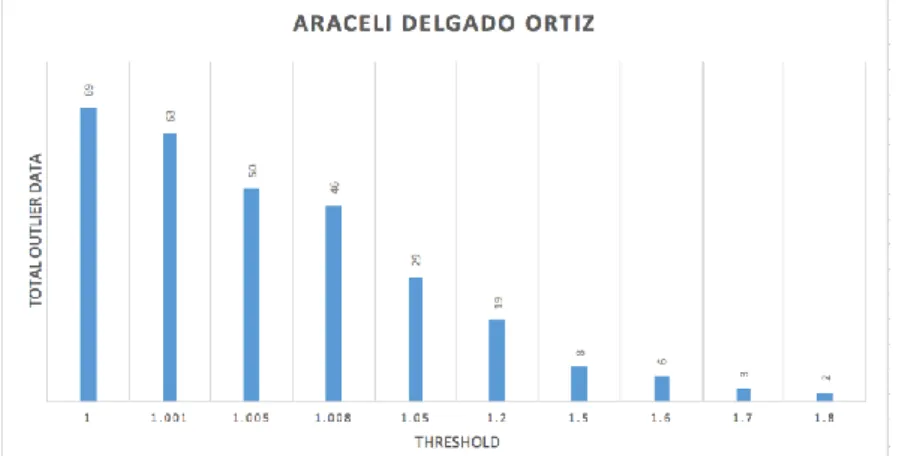
Based on the results of the experiment shown in Figure 7, the value of the transaction data Araceli Delgado Ortiz from the 1 to 1,8. At the limit value of one amount of data that is outlier around 69 And at the time of the increase of the limit rate continuously makes the data detected only 2 records with a limit value of 1.8. Experiments conducted with using 245 transaction data by input parameter minPts = 215.
Figure 7 Results of customer threshold value of Araceli Delgado Ortiz
Based on the results of the experiment shown in Figure 8, explained the addition of the limit value of Cindy Escobar transaction data from 1 up to 2. At the limit value one amount of data outlier about 110 and when adding limit values continuously makes the data detected only 5 data with 2 limit values. Experiments conducted using 232 transaction data by input parameter minPts = 160.
Figure 8 Results of customer threshold value of Cindy Escobar 4. CONCLUSIONS
Input the value of minPts or parameters affects the results of accuracy, recall, precision, and computational time for each algorithm. Based on the tests by comparing the LOF, INFLO, and AFV algorithms resulted in the highest level of LOF algorithms compared to other algorithms: 96% accuracy, 98% recall, and 93% precision. Testing to calculate compute time from each algorithm results in the most immediate AFV algorithm with an average time of 6,29 seconds. Second is the INFLO algorithm with an average time of 7,50 seconds that has a time difference of 0,13 seconds with a LOF algorithm of 7,63 seconds. Adding parameter values results in slowing down compute time for all algorithms.
The combination of category, amount, and state attributes is the best attribute combination compared to other attribute combinations. Generates an average test of five clients, which are 98% accuracy, 98% recall, and 98% precision.Attempts to add a boundary or threshold value continuously to a local outlier factor algorithm or LOF will reduce the amount of outlier data detected.
Subsequent research is recommended to try with other algorithms that have a different approach to the research that has been done and add the optimized algorithm. The optimized
algorithm serves to optimize the LOF algorithm parameters so that users no longer need to manually change or replace the parameters. In testing, algorithms are advised to use transaction data already labeled fraud or not and further research is expected to use the credit card transactions in Indonesia because it is likely to have a pattern of transactions that are Different from the credit card transaction data used.
REFERENCES
[1] E. Turban, J. E. Aronson, and Ting-Peng Liang, Decision Support Systems and Intelligent Systems, Upper Saddle River, NJ: Pearson Prentice Hall, 2007.
[2] V. Vaishali, "Fraud Detection in Credit Card by Clustering Approach", International Journal of Computer Applications, Vol. 98, no. 3, July 2014. Available:
https://research.ijcaonline.org/volume98/number3/pxc3897225.pdf. [Accessed:
October-10-2018].
[3] S. V. Bhosale, "A Survey: Outlier Detection in Streaming Data Using Clustering Approached", (IJCSIT) International Journal of Computer Science and Information Technologies, vol. 5, p. 6050 – 6053, 2014. Available:
http://ijcsit.com/docs/Volume%205/vol5issue05/ijcsit2014050510.pdf. [Accessed:
October-10-2018].
[4] M. Goldstein and S. Uchida, "A Comparative Evaluation of Unsupervised Anomaly Detection Algorithms for Multivariate Data", PloS one, p. 1-31, April 2016. Available:
https://journals.plos.org/plosone/article?id=10.1371/journal.pone.0152173. [Accessed:
October-10-2018].
[5] J. Auskalnis, N. Paulauskas, and A. Baskys, "Application of local outlier factor algorithm to detect anomalies in computer network", Elektronika ir Elektrotechnika, vol. 24, p. 96– 99, 2018. Available:
http://eejournal.ktu.lt/index.php/elt/article/view/20972. [Accessed:
October-20-2018].
[6] J. Tang, H. Y. T. Ngan, J. Tang, and H. Y. T. Ngan, "Traffic Outlier Detection by Density Based Bounded Local Outlier Factors", HKBU Institutional Repository, vol. 1,
p. 6 – 18, 2016. Available:
https://repository.hkbu.edu.hk/cgi/viewcontent.cgi?article=7235&context=hkbu_staff_p
ublication . [Accessed: October-10-2018].
[7] M. Breunig, Markus, Hans peter Kriegel, Raymond T Ng, and Jörg Sander, "LOF: Identifying Density-Based Local Outliers", Proceedings of the 2000 ACM SIGMOD International Conference on Management of Data, 2000, p. 1 - 2. Available:
http://www.dbs.ifi.lmu.de/Publikationen/Papers/LOF.pdf. [Accessed:
October-10-2018].
[8] R. Devaki, "Credit Card Fraud Detection Using Time Series Analysis", International Journal of Computer Applications, no. 3, p. 8 - 10, 2014. Available:
https://www.ijcaonline.org/proceedings/icscn/number3/16159-1031. [Accessed:
October-10-2018].
[9] V. Kathiresan, "Outlier Detection on Financial Card or Online Transaction Data Using Manhattan Distance Based Algorithm", International Journal of Computer Science & Technology in Contemporary Research, vol. 12, p. 1100 - 1103, 2016. Available:http://www.ijcrcst.com/papers/IJCRCST-DECEMBER16-01.pdf. [Accessed: October-10-2018].
[10] Y. Yazid, "Mendeteksi Kecurangan Pada Transaksi Kartu Kredit Untuk Verifikasi Transaksi Menggunakan Metode SVM", Indonesian Journal of Applied Informatics,
vol. 1, no. 2, p. 61-66, 2017. Available:
https://jurnal.uns.ac.id/ijai/article/view/14378. [Acces sed: October-10-2018].