OpenSIUC
Publications Educational Psychology and Special Education
7-2011
An Effective and Efficient Analytic Technique: A
Bootstrap Regression Procedure and Benford's Law
Ik Seon Suh
Marquette University, [email protected]
Todd C. Headrick
Southern Illinois University Carbondale
Follow this and additional works at:http://opensiuc.lib.siu.edu/epse_pubs
Published in the Journal of Forensic & Investigative Accounting, 2011, Vol. 3, No. 3, pp. 25-45
This Article is brought to you for free and open access by the Educational Psychology and Special Education at OpenSIUC. It has been accepted for inclusion in Publications by an authorized administrator of OpenSIUC. For more information, please [email protected].
Recommended Citation
Suh, Ik Seon and Headrick, Todd C. "An Effective and Efficient Analytic Technique: A Bootstrap Regression Procedure and Benford's Law." ( Jul 2011).
25
An Effective and Efficient Analytic Technique: A Bootstrap Regression
Procedure and Benford's Law
Ik Seon Suh Todd C. Headrick
Sandra Minaburo*
Analytic procedures allow auditors (or forensic accountants) to identify the presence of unexpected relationships among financial data, including unusual transactions or events, and to develop the scope of audit planning or investigation (Corbett and Clayton 2006, Bhattacharjee and Machuga 2004, Asare and Wright 2001).The effectiveness of analytic techniques e.g., trend analysis, ratio analysis, or a regression analysis depends on the precision of expectations developed (Kenyon and Tilton 2006).However, there is a caveat associated with these expectations. Specifically, Hitzig (2004) notes that “…because the expectation is specified by the auditor, and because the expectation’s parameters are estimated from data that may be misstated [or contain fraudulent transactions], there is a risk that reasonable expectations are incorrect…” (p. 34). As such, the risk of failing to detect the presence of suspicious trends, patterns, or anomalies within the financial data likely exists. This problem is referred to herein as the risk of Type II error.
On the other hand, analytic procedures infer propriety of individual transactions based on the reasonableness of aggregated account balances or classes of transactions (Stringer and Stewart 1986, p. 16). The percentage of misdiagnosis associated with these procedures ranges from 15% to 50% (Kogan et al. 2010) and research indicates that the use of daily or monthly disaggregated data improves the effectiveness of analytic techniques (Kogan et al. 2010, Hoitash et al. 2006, Leitch and Chen 2003, Chen and Leitch 1998, 1999, Dzeng 1994). Nonetheless, assessing for the presence of unusual transactions may be difficult or costly when the volume of disaggregated data becomes considerably large such as tens or hundreds of thousands (or even millions) of observations. In this case, analytic procedures may be used to focus the audit planning or investigation on certain areas of concern (Corbett and Clayton 2006). The effectiveness of this approach also depends on the precision of the initial suspicion. In addition, the results of traditional statistical analytic techniques such as a
* The authors are, respectively, at Marquette University, Southern Illinois University Carbondale, and Instituto Tecnológico
26
regression or time series analysis associated with disaggregated data may be problematic when the amount of data to examine increases or when several analytic procedures are used. These problems are referred to herein as excessive power (Nigrini 2000, p. 75) and the risk of Type I error, respectively.
To address the issues described above, this study introduces a new bootstrap regression (BREG) procedure in the context of Benford’s Law to identify unusual patterns of data using the first two digits of financial data. The BREG procedure is based on simple regression analysis, which is a commonly used technique by practitioners (Kogan et al. 2010, Corbett and Clayton 2006, Hoitash et al. 2006, Leitch and Chen 2003, Chen and Leitch 1998, 1999, Dzeng 1994, Stringer 1986, Kinney and Salamon 1982).Further, the BREG procedure is related to the technique introduced by Suh and Headrick (2010) insofar as it is an overall analysis (rather than a digit-by-digit analysis), which addresses the concern for Type I error (Cleary and Thibodeau 2005), and it is based on bootstrapping conventional statistics such as a mean or variance.
Furthermore, the Benford parameters associated with these statistics are independently derived of any implicit or explicit financial data subject to audit and the use of these parameters addresses the concern for Type II error. Moreover, the BREG procedure, unlike other conventional statistical procedures (e.g., chi-square goodness of fit test or the Nigrini distortion factor index 1996), can be inexpensively applied to large disaggregated financial data sets without requiring any initial suspicions about potential misstatements or fraud in specific account balances or classes of transactions. It also mitigates the excessive power problem by making use of exact (Benford) bootstrap confidence intervals that are based on the specific sample size of any given financial data set subject to audit.
To demonstrate the effectiveness and efficiency of the BREG procedure, we examined four different types of data sets: (a) customer purchasing and credit card debt transactions referred to as non-fraudulent data, (b) fabricated data referred to as non-Benford-like data, (c) Federal Election Commission (FEC) in-kind contributions referred to as allegedly fraudulent data, and (d) inventory/purchasing and revenue/cash receipt transactions from a Mexican retail company located in Mexico City. A priori, we were aware of the nature of each data set except for the Mexican retail company’s data. The results associated with the first three data sets were consistent with our prior knowledge and demonstrate that the proposed BREG procedure provides accurate diagnoses.
Applications of the BREG procedure to the Mexican retail company data revealed unusual transactions in specific accounts such as cash sales and inventory. Based on the diagnostic reports, the Mexican retail company initiated further investigations and confirmed the presence of unusual
27
activities across its divisions. For example, the retail company commented that “the results of the study [diagnostic reports from the BREG procedure] corresponding to Division 3 reflect the reality. That is, we were able to determine the existence of unusual transactions in inventory and cash sales. Additional investigations confirm that these transactions were fraudulent. Currently, we are acting on this critical situation.”
In the next section, the methodology for the proposed BREG procedure is developed and explained in terms of how bootstrapping techniques are used in conjunction with regression analysis to assess whether financial data likely contain unusual transactions or events. In the subsequent section we present applications of the BREG procedure to non-fraudulent, fabricated non-Benford-like, allegedly fraudulent, and the Mexican retail company data sets. In the last section, we discuss applications of the BREG procedure in the context of Benford’s Law and make suggestions for further research. We also discuss other statistical analytic techniques and the problems associated with these techniques in the context of the Mexican retail company data.
METHODOLOGY The Bootstrap and Regression (BREG)
The proposed bootstrap regression (BREG) procedure can be described by first generally expressing a linear population regression model in terms of its parameters as
0 1
i i i
Y X (1)
where Yi is the dependent variable, Xi is the independent variable, i is the error term, and where 1,..., .
i N The estimates (ˆ0 and ˆ1) associated with the parameters 0and 1 are obtained based on the method of ordinary least squares. In the context of hypothesis testing, one of the assumptions is that the error term in (1) is normally distributed. However, a common problem is that real-world data often fail to meet the normality assumption such as the case with discrete Benford-like data. In such situations, nonparametric tests have demonstrated to be appropriate in terms of controlling Type I error and power (e.g., Mooney and Duval 1993). For example, the bootstrap can be used to make appropriate inferences associated with the population parameters (0and 1) without having to make distributional assumptions regarding the error term i in (1) (Efron and Tibshirani, 1998).
A fundamental description of the bootstrap in the context of the regression model in (1) begins with randomly generating T bootstrap samples from the initial data set as
X Yi1, i1
,
Xi2,Yi2
,…,28
XiT,YiT
fori1,..., .N Each of the T samples contains the same number of N cases which are drawn with equal probability and with replacement from the initial data set. The estimates of ˆ0 and ˆ1 are computed for each of the T samples and subsequently ordered from minimum to maximum as
1
0 0 0 0
ˆ ˆ ˆ ˆ
min ,..., max T and min
ˆ1 ˆ1 1 ,..., max
ˆ1 ˆ1 T to construct the bootstrap confidence intervals (CIs). For example, if the specified Type I error rate was 0.05 and T 25, 000 then the 95% CIs would appear generally as
ˆ06250 ˆ024,375
and
ˆ16251ˆ124,375
. For further details on the theory and practice of the bootstrap in the context of regression analysis see Efron and Tibshirani (1998) and Mooney and Duval (1993).Benford’s Law and the BREG procedure
Benford (1938) proposed formulae to determine the exact probabilities for the first digits (d1) and the second digits (d2) for certain kinds of data. Using a variety of large data sets, Benford (1938) empirically demonstrated that the leading first digits closely follow their associated exact probabilities. See Appendix A and Appendix B for tabled values of Benford probabilities and for formulae to compute exact Benford probabilities, respectively.
The specific forms of the population regression models for the proposed BREG procedure based on (1) and Benford’s Law are expressed in terms of the first digits d1 and the second digits d2
as
1i 0 1 2i 1i
d d (2)
2i 0 1 1i 2i
d d . (3)
Using the regression models in (2) and (3), the following two sets of null hypotheses can be formulated to test whether financial data follow Benford’s Law as
1 0,d : 0 3.239170 H and 10.048018 (4) 2 0,d : 0 3.962264 H and1 0.065439. (5)
These two sets of parameters in (4) and (5) are referred to as “Benford parameters” because they were derived under the assumption that the probability distributions associated with the first digits and the second digits of a data set follow their exact Benford probabilities. See Appendix B for the derivations of the Benford parameters in (4) and (5). Failing to reject the null hypotheses in (4) and (5) suggests that financial data are unlikely to contain suspicious trends, patterns, or anomalies.
29
The hypotheses in (4) and (5) are stated for both regression models in (2) and (3) because both
1
d and d2 are considered to be random variables (Pedhazur, 1997; p. 38). Further, the bootstrapping sampling procedure considers the two sets of hypotheses in (4) and (5) as independent of each other.1 However, within each regression model, there is a strong negative correlation between the estimates of the intercept term and the slope coefficient i.e.,
0, 1 0, 1 0.82
. As a result, a Bonferroni adjustment to the conventional Type I error rate of 0.05(i.e., 0.05 20.025) is used with acorresponding 97.5% CIs for each parameter. This approach mitigates auditors from concluding evidence of unusual transactions when there is none.
Given the specified Benford parameters in (4) and (5), the steps taken to evaluate for potential variations in plausible relationships among financial data are: (a) obtain the leading first two digits from the actual data under investigation and the exact first and second digits associated with Benford-like (or fraud-free) data, (b) run the BREG procedure for the actual data digits and the exact (Benford-like) data digits and obtain the 97.5% bootstrap CIs for the parameters in (2) and (3), and (c) evaluate for the potential existence of unusual patterns of transactions by assessing financial data conformity to Benford’s Law.
The decision criteria for part (c) are as follows: If all four bootstrap CIs associated with (4) and (5) contain their respective Benford parameters or overlap with their corresponding exact (or Benford) CIs then conclude that the digit patterns of the actual financial data follow Benford’s Law and that the financial data unlikely contain unusual fluctuations that may signal potential misstatements or fraud. Otherwise, if any one (or more) of the four CIs does not contain their respective Benford parameters or does not overlap with their corresponding exact CIs, then infer that the financial data are suspicious enough to initiate further detailed test of transactions (or investigation).We note that the use of CIs as the decision criteria to infer the propriety of accounts balances or classes of transactions is consistent with prior analytic procedure studies (e.g., Kogan 2010, Kinney 1979). For example, the presence of potential anomalies is inferred if the predictive variable associated with the data exceeds either the upper or lower limits of the prediction interval (Kogan, 2010,p. 27).
We would also note that the bootstrap CIs for the Benford parameters in(4) and (5) can be obtained using TIBCO SpotfireS+ (Version 8.1, 2008). See Figure 1 for the S+ notations and an illustration of the BREG procedure and the decision criteria. Note also that the bootstrap CIs can be
1The independent relationship between the two sets of hypotheses in (4) and (5) is based on the fact that the initial random
30
obtained using SPSS (PASW) statistics (Version 18.0, 2009) with the bootstrap add-on package. In addition, the exact first and second digits are generated based on the specific N size of the actual data and the exact probabilities for the first two digits are given in Suh and Headrick (2010)Table A.3. The algorithms and instructions for generating exact digits are available at the following website:
http://www.siuc.edu/~epse1/headrick/Benford/ExactDigits.doc. The executable file to compute the first
two digits can be downloaded by using the following link:
http://www.siuc.edu/~epse1/headrick/Benford/D1D2.exe (Suh and Headrick 2010, p. 149).
To demonstrate the decision criteria in Figure 1, consider a hypothetical checking account with the 97.5% bootstrap CIs of
2.7780 3.519
**,
0.03410.0461
*,
2.9650 3.561
*, and
0.11010.057
*.One asterisk (*) indicates that the CI overlaps with the Benford CI but does not contain the parameter and two asterisks (**) denote that the CI contains the Benford parameter. Inspection of these CIs indicates that the checking account transactions unlikely contain suspicious patterns of data because one CI contains its respective Benford parameter and the remaining CIs overlap with the following exact (or Benford) CIs for each parameter:
2.57803.309
,
0.01710.061
,
3.1280 3.995
, and
0.02110.087
. Alternatively, given the sameexact CIs, if the 97.5% CIs associated with the checking account were (3.3640 3.586),
0.0641 0.035
*,
2.9650 3.561
*, and
0.11010.054
*, then these results suggestdata are suspicious because one CI neither contains its Benford parameter nor overlaps with exact CI. We would also note that bold numbers indicate that the CIs neither contain the Benford parameters nor overlap with Benford CIs.
APPLICATIONS Data
Four different kinds of data sets were used in this study. The first data set consisted of two samples of individuals’(non-fraudulent) purchasing transactions targeted by a marketing campaign and credit card debt transactions (SPSS, 2008). The second data set is fabricated non-Benford-like data (Hill, 1988). We replicated the first digits and the second digits of the non-Benford-like data based on the digit probabilities provided by Hill (1988, p. 969) who instructed his 742 undergraduate students to write a six-digit number “out of their heads” (See Tables A.1 and A.2 in Appendix A). The third data set consists of the 1994, 1996, and 2004 Federal Election Commission (FEC) committee-to-committee
31
in-kind contributions and allegedly contains fraudulent transactions (Cho and Gaines, 2007). The FEC in-kind contributions are cash, donated services, or bills paid by a third party on behalf of a campaign committee. These contributions are not subject to a maximum threshold of donations mandated by the government. The last data set includes inventory/purchasing and revenue/cash receipt transactions of a retail company located in Mexico City. The Mexican retail company’s records were examined on a daily basis and for each of three divisions during 2007-2009. The specific records are credit/cash sales, cash collection, check/cash deposits, inventory, purchases, and purchase returns. We would note that the exact (Benford) CIs associated with each of the four data sets are not tabulated in the following section, but are available from the first author.
Results
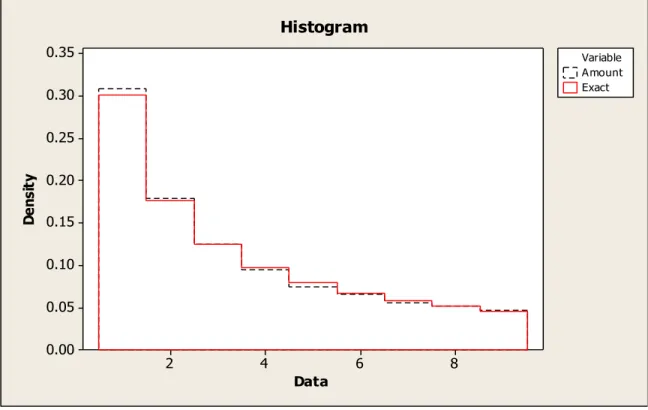
Table A.1 and Table A.2 in Appendix A give the empirical probabilities associated with the first digits and the second digits of the non-fraudulent Amount data (SPSS, 2008). These data represent purchasing transactions ofN24, 067 individuals targeted by a marketing campaign. The empirical probabilities of the Amount data are juxtaposed with the exact Benford probabilities in Figure 2 and Figure 3. Inspection of Tables A.1 and A.2 and Figures 2 and 3 suggests that the leading first digits and second digits for the purchasing transaction data closely approximate Benford’s Law.
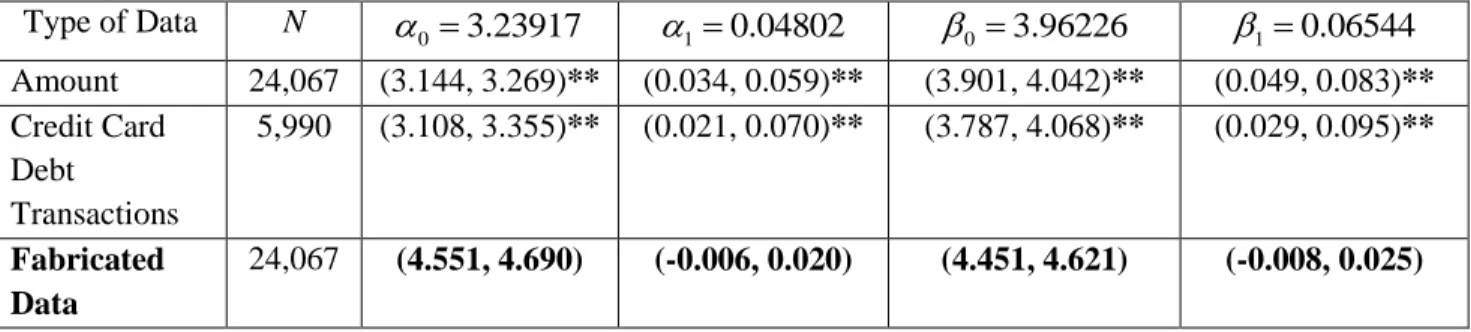
To validate our observations, the BREG procedure was conducted on the Amount data. The results in Table 1 indicate that the Amount data conform to Benford’s Law. That is, all four bootstrap CIs contain their respective Benford parameters in (3) and (4) or overlap with exact (or Benford) CIs. In contradistinction, the results of the traditional statistical procedures on the first digits suggest that the Amount data likely contain significant fluctuations that signal misstatements. Specifically, both the chi-square test (216.073,p0.041) and the Nigrini (1996) distortion factor index (
2.295, 0.022
Z p ) are statistically significant using a Type I error rate of 0.05. The primary reason for this discrepancy is the excessive power problem associated with these statistical tests as the number of purchasing transactions becomes large (N24, 067). This excessive power problem was confirmed by a Monte Carlo simulation where we used the probabilities associated with the Amount data in Table A.1 as a basis to generate observed frequencies and the exact Benford probabilities for the first digits as a basis to generate expected frequencies for the chi-square test statistic. The results of the simulation (not tabulated) showed that the rejection rate was intolerably high .830.This result was based on a Type I error rate of 0.05, N24, 067, and 25,000 independent chi-square sample statistics.
32
The empirical rate of .830 is the proportion of rejections (i.e. p0.05) associated with the 25,000 chi-square statistics. Thus, for large sample sizes, the chi-chi-square goodness-of-fit test is not recommended.
The BREG procedure was also applied to another non-fraudulent data set (SPSS 2009) consisting of N 5,990credit card debt transactions and the Hill (1988) fabricated non-Benford-like data with the same number of observations as the sample size of the Amount data (N24, 067). The results in Table 1 show that the leading first digit and second digit probabilities of the credit card debt transactions follow Benford-like distributions because all bootstrap CIs contain Benford parameters or overlap with exact CIs. In contrast, all bootstrap CIs associated with the fabricated non-Benford-like data do not contain the Benford parameters or do not overlap with exact (or Benford) CIs. Thus, these results are consistent with our prior knowledge on the nature of the data sets. In summary, the results in Table 1 demonstrate that the BREG procedure ameliorates the excessive power problem in the context of Benford’s Law.
In addition, the BREG procedure was applied to the Federal Election Commission (FEC) data for the years 1994, 1996, and 2004.Inspection of Table 2 indicate that all four bootstrap CIs do not contain Benford parameters or do not overlap with exact CIs for the 1994 and 2004 data. In terms of the 1996 data, one of the four CIs
0 neither contains nor overlaps with exact CIs. As such, these results provide evidence of addressing the Type II error problem because they corroborate with the findings of Cho and Gaines (2007) who suggest that potential irregularities with the “soft” money contributions exist in the 1994, 1996, and 2004 FEC data.Finally, we examined the Mexican retail company’s daily transactions for each one of the following accounts of Divisions 1, 2, and 3 from 2007 to 2009: (a) credit/cash sales, (b) cash collection, (c) check/cash deposits, (d) inventory, and (e) purchase/purchase returns. The results presented in Table 3 suggest that none of the accounts of Division 1 likely exhibits unusual patterns of transactions except for the inventory account. Other accounts such as adjustments to inventory, sales returns, and inventory write-offs were not examined due to an insufficient number of observations (e.g., N14).
Based on our findings, the retail company initiated further investigation and provided the following commenti:
[The results of the study—diagnostic reports from Bootstrap regression analyses—for Division 1 coincide with unusual movements of inventory that we were able to detect based on further audit testing. Currently, these transactions are under investigations].
33
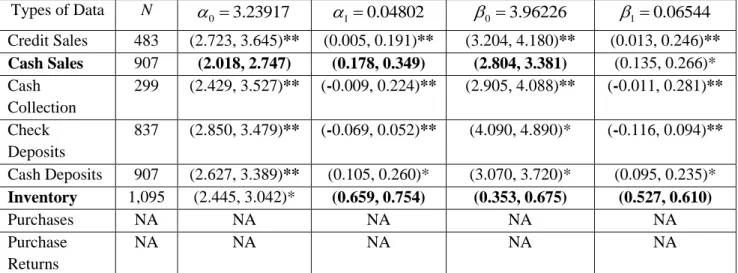
Table 4 and Table 5 present results associated with Division 2 and Division 3, respectively. These results suggest presence of unusual transactions in cash sales and inventory accounts as three out of the four bootstrap CIs associated with these accounts do not contain their respective Benford parameter or do not overlap with their corresponding exact CI. It is likely that these unusual patterns are connected to each other because the accounting information system of the Mexican retail company is designed in such a manner where inventory records are linked to both cash/credit sales and purchase/purchase return records. Another reason of our conjecture relates to a small number of observations in purchase/purchase return accounts (e.g.,N9) for Division 2 and the results in Table 3 indicate that data anomalies with purchase/purchase return accounts likely do not exist in Division 3.Given our diagnostic reports, the retail company initiated further investigations in Division 2 and Division 3 and provided us with the following feedbackii:
[The results of the study—diagnostic reports from Bootstrap regression analyses—related to Division 2 match with unusual movements of cash sales, and inventory. However, additional audit testing results indicate that unusual fluctuations in cash sales relate to promotion periods and that the unusual fluctuations in both accounts are immaterial].
[The results of the study—diagnostic reports from Bootstrap regression analyses—
corresponding to Division 3 coincide with the reality. That is, we were able to determine the existence of unusual transactions in inventory and cash sales. Additional investigations confirm that these transactions were fraudulent. Currently, we are acting on this critical situation].
DICUSSION AND CONCLUSION
The overall results associated with the non-fraudulent, fabricated non-Benford-like, allegedly fraudulent, and the Mexican retail company data sets demonstrate that the proposed BREG procedure accurately assess for the presence of unusual fluctuations in financial data (i.e., data anomaly).The BREG procedure, like other analytic techniques, does not identify the location of unusual patterns of transactions, but indicates the presence of these problems i.e., errors or fraud. Other analytic techniques such as ratio analyses compare the book value of a ratio in month t (Rt) to the expected
audited value of a ratio for month t ( ˆRt) to assess significant deviations from the critical value (Kinney
1987, p. 64). The problem with this approach is the precision level of ˆRtthat may be in error due to undetected misstatements or fraud in prior audits.
34
Similarly, trend analysis uses arbitrarily selected cut-off values (e.g., 5%, 10% or 15%) to balance between Type I and Type II errors. Loebbecke and Steinbart(1987) indicate that this “cut-off value” approach is “little better than biased coin flips” (p. 87).Alternative statistical analytic techniques (Dzeng 1994, Kinney and Salamon 1982, Kinney 1979) such as regression analysis and the vector autoregressive model(VAR) utilize past information of the account under audit and other explanatory variable(s) whereas the univariate autoregressive integrated moving average (ARIMA) and the random walk model use only past data of the account under audit. Each one of these techniques may be efficient and effective if past financial data are not contaminated with unusual fluctuations (Hitzig 2004).
In contrast, the effectiveness and efficiency of the BREG procedure is impervious to the quality of past financial data. Based on the BREG procedure, we were able to detect the presence of misstatements and/or fraud in inventory and cash sales accounts associated with the Mexican retail company’s data across three divisions over a time period of 2007-2009.As opposed to the BREG procedure, the results associated with a statistical analytic technique such as a standard regression analysis2were inconsistent. For example, when cash sales were regressed on cost of goods sold, we found no evidence of unusual fluctuations in Division 1, but confounding results in Division 2 and Division 3. Specifically, given a 95% confidence level, the cash sales overstatement errors were not material3 in year 2008, but material in year 2009 for Division 3 and vice versa for Division 2.These results suggest that the use of the intercepts and slope coefficients corresponding to 2007 or 2007-2008 financial data was not effective to infer a possible anomaly in cash sales and, thus, conclude a need for a further investigation (i.e., committed Type II errors). Furthermore, when inventory was regressed on net purchases, the results provide evidence of unusual fluctuations in Division 2 and Division 3, but inconsistent results for Division 1. That is, the inventory overstatement errors were not material in year 2008, but material in year 2009.
In addition to effectiveness, the BREG procedure efficiently examines, for example, daily or monthly disaggregated financial data across different accounts or classes of transactions while mitigating Type I error as the number of digits to examine increases or the excessive power problem as the volume of transactions becomes large. Unlike other statistical analytic techniques, the BREG
2We could not conduct a ratio analysis because the Mexican retail company is small and private and the industry benchmark
information available for the ratio analysis only pertains to big listed retail companies.
3The overstatement accounting errors is considered material if the 1-upper precision limit is less than a material amount.
35
procedure allows an auditor to minimize the Type I error problem because (a) digit patterns are examined on an overall basis rather than a digit-by-digit basis and (b) the diagnostics are insensitive to large volumes of transactions unlike other inferential procedures e.g., the chi-square goodness of fit test or the Nigrini (1996) Distortion Factor Index. This was demonstrated with the SPSS (2009) new customer purchasing transactions (N24, 067).
We believe that applications of the BREG procedure can be extended to a continuous auditing system which allows auditors to examine the entire population rather than to just mere samples of business transactions. Implementing the BREG procedure as part of continuous auditing system is feasible because most of financial data are recorded electronically and the majority of these records are not backed-up with paper documentation (Corbett et al. 2006) and because accessible statistical software (e.g., TIBCO SpotfireS+ or SPSS[PASW] statistics with the bootstrap add-on package) allows practitioners to conduct bootstrap regression analyses in a computationally efficient manner.
The advantage of applying the BREG procedure to the entire population data or part of a continuous auditing system on a daily, weekly, or monthly basis is an opportunity for auditors (or forensic accountants) to minimize the material cost of concluding absence of unusual fluctuations when in fact these fluctuations exist—i.e., Type II error. Timely assessments of financial data propriety per account or classes of transactions would indeed allow firms to make adequate corrections or take appropriate actions and improve the quality of financial reporting (Kogan et al. 2010). Nevertheless, we suggest that the BREG procedures be applied to different financial data sets and different companies to test the robustness of the proposed procedure and incorporate this procedure as part of the Computer Assisted Auditing Tools and Techniques (CAATTs) e.g., ACL (2006).
We would also note that certain conditions of financial data make applications of the BREG procedure not recommendable. Examples of these conditions relate to (1) non-randomly generated data (e.g., check numbers, zip codes or invoice numbers), (2) data with maximum or minimum thresholds, (3) data with specific assigned amounts, or (4) non-existing records. For more information see Durtschi et al. (2004, p. 24) and Rodriguez (2004). Thus, we recommend that readers of this study interpret our results with care and auditors or forensic accountants apply the BREG procedure given a preliminary understanding of the nature of financial data under audit or investigation.
36
REFERENCES
ACL for Windows. 2006. Version 9, Workbook, Vancouver: ACL: Services, Ltd.
Asare, S. K. and Wright, A. 2001. Design considerations for research on analytical procedures. International Journal of Auditing, 5: 205-214.
Bhattacharjee, S. and Machuga, S. 2004. The impact of generating initial hypothesis sets of different sizes on the quality of the initial set, and the resulting time efficiency and final judgment accuracy. International Journal of Auditing, 8: 49-65.
Benford, F. 1938. The law of anomalous numbers. Proceedings of the American Philosophical Society, 78(4): 551-572.
Chen Y. and Leitch R.A. 1998. The Error Detection of Structural Analytical Procedures: A Simulation Study. Auditing: A Journal of Practice and Theory, 17(Fall): 36-70.
Chen Y. and Leitch R.A. 1999. An Analysis of the Relative Power Characteristics of Analytical Procedures. Auditing: A Journal of Practice and Theory, 18(Fall): 35-69.
Cho, W. K. and Gaines, B. J.2007. Breaking the (Benford) law: Statistical fraud detection in campaign finance. The American Statistician, 61(3): 218-223.
Cleary, R. and Thibodeau, J. C. 2005. Applying digital analysis using Benford’s law to detect fraud: The dangers of type I error rate. Auditing: A Journal of Practice & Theory, 24(1): 77-81. Corbett, M. N. and Clayton, M. M. 2006. Analyzing Financial Statements. In: A Guide to Forensic
Accounting Investigation, edited by Golden, T. W., Skalak, S. L. and Clayton, M. M., 365-384. New Jersey: John Wiley & Sons, Inc.
Corbett, M. N. et al. 2006. Data Mining: Computer-Aided Forensic Accounting Investigation Techniques. In: A Guide to Forensic Accounting Investigation, edited by Golden, T. W., Skalak, S. L. and Clayton, M. M., 385-422. New Jersey: John Wiley & Sons, Inc.
Durtschi, C. et al. 2004. The effective use of Benford’s Law to assist in detecting fraud in accounting data. Journal of Forensic Accounting, 5(1): 17-34.
DzengS.C. 1994. A Comparison of Analytical Procedures Expectation Models Using Both Aggregate and Disaggregate Data. Auditing: A Journal of Practice and Theory, 13(Fall):1-24.
Efron, B. and Tibshirani, R. J. 1998. An Introduction to the Bootstrap. Chapman and Hall/CRC, Boca Raton, Florida.
37
Hill, T. 1988. Random-number guessing and the first digit phenomenon. Psychological Reports, 62: 967-971.
Hitzig, N. B. 2004. The hidden risk in analytical procedures: What WorldCom revealed. The CPA Journal, 74(2): 32-35.
Hoitash, R. A. Kogan, and M.A. Vasarhelyi. 2006. Peer-Based Approach for Analytical Procedures. Auditing: A Journal of Practice and Theory, 25(2): 53-84.
Kenyon, W. and Tilton, P. D. 2006. Potential Red Flags and Fraud Detection Techniques. In: A Guide to Forensic Accounting Investigation, edited by Golden, T. W., Skalak, S. L. and Clayton, M. M., 365-384. New Jersey: John Wiley & Sons, Inc.
Kinney, W. R. Jr. 1987. Attention-directing analytical review using accounting ratios: A case study. Auditing: A Journal of Practice and Theory, 6(2):59-73.
Kinney, W. R. Jr. 1979. Integrating Audit Tests: Regression Analysis and Partitioned Dollar-Unit Sampling. Journal of Accounting Research, 17(2):456-475.
Kinney, W. R. Jr. and Salamon, G. L. 1982. Regression analysis in auditing: A comparison of alternative investigation rules. Journal of Accounting Research, 20(2): 350-366.
Kogan, A., et al. 2010. Analytical procedures for continuous data level auditing: Continuity equations. Working paper at Rutgers University and University of Massachusetts-Dartmouth.
Leitch, R. A. and Y. Chen. 2003. The Effectiveness of Expectation Models. In: Recognizing Error Patterns and Eliminating Hypotheses While Conducting Analytical Procedures. Auditing: A Journal of Practice and Theory 22 (Fall): 147-206.
Loebbecke, J. K. and Steinbart, P. J. 1987. An investigation of the use of preliminary analytical review to provide substantive audit evidence. Auditing: A Journal of Practice and Theory, 6(2): 74-89. Mooney, C. Z. and Duval, R. 1993. Bootstrapping: A Nonparametric Approach to Statistical
Inference. Sage Publications, California.
Nigrini, M. J. 2000. Digital Analysis using Benford’s Law: Tests and Statistics for Auditors. Global Audit Publications, Canada.
Nigrini, M. J. 1996. A taxpayer compliance application of Benford’s law. The Journal of the American Taxation Association, 18(Spring): 72-91.
Pedhazur, E. 1997. Multiple Regression and Behavioral Research. 3rd Ed. Wadswoth, Victoria, Australia.
38
Rodriguez, R. J.2004. Reducing False Alarms in the Detection of Human Influence on Data. Journal of Accounting Auditing and Finance, 19(2): 141-158.
SPSS(PASW) Statistics 18.0. 2009. Chicago IL: IBMInc.
Stringer, K. W. and Stewart, T. R. 1986. Statistical techniques for analytical review. John Wiley and Sons: New York.
Suh, I. and Headrick, T. C. 2010. A comparative analysis of the bootstrap versus traditional statistical procedures applied to digital analysis based on Benford’s Law. Journal of Forensic and Investigative Accounting, 2(2): 144-175.
39
APPENDIX A
Table A.1. First digit probabilities.
First Digits
d1 1 2 3 4 5 6 7 8 9 Exact Benford 0.301 0.176 0.125 0.097 0.079 0.067 0.058 0.051 0.046 Empirical Benford 0.289 0.195 0.127 0.091 0.075 0.064 0.054 0.055 0.051 Amount 0.308 0.179 0.125 0.094 0.075 0.066 0.056 0.051 0.047 Fabricated Data 0.147 0.100 0.104 0.133 0.097 0.157 0.120 0.084 0.058Exact Benford = Theoretical probabilities and are computed using equation B.1 in Appendix B. Empirical Benford = Empirical first digit probabilities estimated by Benford (1938) who used a sample of
20,229 observations.
Amount = Empirical first digit probabilities associated with dollar amount of purchases for each individual targeted by a marketing campaign (SPSS 2009).Amount probabilities are based on N=24,067.
Fabricated Data = First digits generated by MINITAB based on the first digit probability distribution provided by Hill(1988).
Table A.2. Second digit probabilities.
Second Digits
d2 0 1 2 3 4 5 6 7 8 9 Exact Benford 0.120 0.114 0.109 0.104 0.100 0.097 0.093 0.090 0.088 0.085 Amount 0.118 0.116 0.109 0.102 0.100 0.094 0.095 0.092 0.087 0.085 Fabricated Data 0.058 0.106 0.117 0.109 0.105 0.100 0.112 0.128 0.073 0.092Exact Benford = Theoretical probabilities and are computed using equation B.1 in Appendix B. Amount = Empirical first digit probabilities associated with dollar amount of purchases for each
individual targeted by a marketing campaign (SPSS 2009).Amount probabilities are based on N=24,067.
Fabricated Data = First digits generated by MINITAB based on the first digit probability distribution provided by Hill(1988).
40
APPENDIX B
The exact Benford probabilities (P) for the first digits d1, second digits d2, and the first and second digits d d1 2 are, respectively
1 log10 1 1 1 d P d where d11,...,9 (B.1)
2 1 9 10 1 2 1log 1 1 d d P
d d where d2 0,...,9 (B.2)
1 2 log10 1 1 1 2 d d P d d where d d1 210,...,99 (B.3) The Benford parameters in (4) and (5) can be expressed as (e.g. Pedhazur, 1997; p. 102)1 1 2 2 1 0.048018 d d d d (B.4) 1 2 0 d 1 d 3.239170 (B.5) 2 1 2 1 1 0.065439 d d d d (B.6) 2 1 0 d 1 d 3.962264 (B.7) where 1 2 d d
is the Pearson correlation,
1
d and
2
d
are means, and
1
d and
2
d
are standard deviations associated with the first digits (d1) and second digits (d2).
The population means for the first digits and the second digits are
1 1 1 9 1 1 3.44024 d d d Pd
and 2 2 2 9 2 0 4.18739 d d d Pd
. The population standard deviation for the first digits is based on1 1
2 2 2
1
d E d d
where the expected value
1 1 9 2 2 1 d 1 1 d 17.89174 E d
d P and thus 1 2.46100 d .Analogously, the population standard deviation for the second digits is
2 2.87294 d where the expected value 2 2 9 2 2 2 d 0 2 d 25.78802
E d
d P . The population correlation is based on
1 2 1 2 1 2 1 2
d d E d d d d d d
. The expected value of the first two digits is
1 21 2
9 9
1 2 d 1 d 0 1 2 d d 14.80195
41
Figure 1. The bootstrap regression (BREG) procedure and the decision criteria.
1. Under the command resample using 25,000resamples, compute the estimates for the regression model and their bootstrap CIs using the following notations: Model → Expression [coef(lm(V1~V2))] based on the Bias-corrected (BCa) CI default option and 97.5% confidence level.
2. Under the command resample using 25,000resamples, compute the estimates for the regression model and their bootstrap CIs using the following
notations: Model → Expression [coef(lm(V2~V1))] based on the Bias-corrected (BCa) CI default option and 97.5% confidence level.
Decision Criteria:
Do all four bootstrap CIs contain Benford’s
parameters
or overlap with exact (or Benford) CIs?
Infer that the financial data are
suspicious and initiate further detailed test of transaction or
investigations.
No Yes
Start
Select the first digits and the second digits of the
Actual Data(e.g., cash sale transactions). Execute algorithms to generate Exact
Benford first digits and second digits given the sample size (N) of the actual
data.
Select and input the first digits ( V1) and the second digits ( V2)of the actual data (e.g., cash sale transactions) into
the TIBCO Spotfire S+ (Version 8.1, 2008)spreadsheet.
Stop and conclude that no
data anomalies exist.
42 Data D en si ty 8 6 4 2 0.35 0.30 0.25 0.20 0.15 0.10 0.05 0.00 Variable Amount Exact Histogram
Figure 2.First digits exact (Benford) probabilities versus first digits empirical probabilities associated with the Amount data (SPSS, 2008, File: customer_new.sav)
Data D en si ty 8 6 4 2 0 0.12 0.10 0.08 0.06 0.04 0.02 0.00 Variable Amount Exact Histogram
Figure 3.Second digits exact (Benford) probabilities versus second digits empirical probabilities associated with the Amount data (SPSS, 2008, File: customer_new.sav)
43
Table 1. The 97.5% Bootstrap Confidence Intervals (CIs) for the Benford parameters of Purchasing and Credit Debt Transactions (a) and Fabricated (Non-Benford) Financial Data. (b)Bold type indicates that all four null hypotheses are rejected for the Fabricated Data.
Type of Data N 0 3.23917 10.04802 0 3.96226 10.06544 Amount 24,067 (3.144, 3.269)** (0.034, 0.059)** (3.901, 4.042)** (0.049, 0.083)** Credit Card Debt Transactions 5,990 (3.108, 3.355)** (0.021, 0.070)** (3.787, 4.068)** (0.029, 0.095)** Fabricated Data 24,067 (4.551, 4.690) (-0.006, 0.020) (4.451, 4.621) (-0.008, 0.025)
** Indicates the CI contains the Benford parameter.
(a) Purchasing and credit debt transactions are obtained from SPSS(2008).
(b) First digits and second digits are generated in MINITAB based on the probability distribution provided by Hill (1988).
Table 2. The 97.5% Bootstrap Confidence Intervals (CIs) for the Benford parameters of the Federal Election Commission In-Kind Contributions.(c) Bold type indicates the null hypotheses are rejected for 1994, 1996, and 2004 data and that all three data sets would require further investigation.
Type of Data N 1994 9,290 (2.955, 3.107) (-0.021, 0.015) (3.402, 3.618) (-0.036, 0.023) 1996 11,513 (3.206, 3.336)** (0.003, 0.034)* (3.005, 3.240) (0.007, 0.067)** 2004 8,861 (3.364, 3.585) (0.081, 0.129) (3.432, 3.669) (0.099, 0.156)
* Indicates the CI overlaps with the Benford CI but does not contain the parameter.
** Indicates the CI contains the Benford parameter.
(c) Data are accessed at the Federal Election Commission (FEC) website http://www.fec.gov/finance/disclosure/ftpdet.shtml.
Table 3. The 97.5% Bootstrap Confidence Intervals (CIs) for the Benford parameters of Credit/Cash Sales, Cash Collection, Check/Cash Deposits, Inventory, Purchases and Purchase Returns associated with Division 1 (2007-2009).(d)Bold type indicates that all four null hypotheses are rejected for the Inventory account and this data set would require further investigation.
Type of Data N 10.04802 0 3.96226 10.06544 Credit Sales 538 (2.711, 3.555)** (-0.037, 0.136)** (3.225, 4.168)** (-0.047, 0.193)** Cash Sales 925 (3.393, 4.015)* (-0.004, 0.115)** (3.590, 4.440)** (-0.008, 0.182)** Cash Collection 455 (2.526, 3.418)** (-0.021, 0.165)** (3.047, 4.046)** (-0.021, 0.245)** Check Deposits NA NA NA NA NA Cash Deposits 925 (2.961, 3.650)** (0.031, 0.161)** (3.519, 4.290)** (0.046, 0.222)** Inventory 1,095 (4.444, 4.768) (-0.145, -0.086) (6.306, 7.519) (-0.739, -0.448) Purchases 107 (2.102, 3.951)** (-0.052, 0.333)** (2.304, 4.242)** (-0.064, 0.378)** Purchase Returns 109 (2.377, 4.111)** (-0.242, 0.068)** (3.180, 5.046)** (-0.329, 0.154)**
* Indicates the CI overlaps with the Benford CI but does not contain the parameter.
** Indicates the CI contains the Benford parameter.
(d) Data obtained from a retail Mexican company located in Mexico City.
NA Small sample size (i.e., N=14 or 59) or non-existent observations.
0 3.23917
1 0.04802 0 3.96226 10.06544
0 3.23917
44
Table 4. The 97.5% Bootstrap Confidence Intervals (CIs) for the Benford parameters of Credit/Cash Sales, Cash Collection, Check/Cash Deposits, Inventory, Purchases and Purchase Returns associated with Division 2 (2007-2009).(d) Bold type indicates that three of the four null hypotheses are rejected for both the Cash Sales and Inventory Accounts and that these two data sets would require further investigation.
Types of Data N Credit Sales 483 (2.723, 3.645)** (0.005, 0.191)** (3.204, 4.180)** (0.013, 0.246)** Cash Sales 907 (2.018, 2.747) (0.178, 0.349) (2.804, 3.381) (0.135, 0.266)* Cash Collection 299 (2.429, 3.527)** (-0.009, 0.224)** (2.905, 4.088)** (-0.011, 0.281)** Check Deposits 837 (2.850, 3.479)** (-0.069, 0.052)** (4.090, 4.890)* (-0.116, 0.094)** Cash Deposits 907 (2.627, 3.389)** (0.105, 0.260)* (3.070, 3.720)* (0.095, 0.235)* Inventory 1,095 (2.445, 3.042)* (0.659, 0.754) (0.353, 0.675) (0.527, 0.610) Purchases NA NA NA NA NA Purchase Returns NA NA NA NA NA
* Indicates the CI overlaps with the Benford CI but does not contain the parameter.
** Indicates the CI contains the Benford parameter.
(d) Data obtained from a retail Mexican company located in Mexico City.
NA Small sample size (i.e., N=14 or 59) or non-existent observations.
Table 5. The 97.5% Bootstrap Confidence Intervals (CIs) for the Benford parameters of Credit/Cash Sales, Cash Collection, Check/Cash Deposits, Inventory, Purchases and Purchase Returns associated with Division 3 (2007-2009).(d) Bold type indicates that one null hypothesis is rejected for both the Cash Sales and
Inventory Accounts and that these two data sets would require further investigation.
Types of Data N Credit Sales 184 (2.005, 3.802)** (-0.034, 0.248)** (2.887, 4.513)** (-0.033, 0.375)** Cash Sales 909 (3.236, 3.714)** (-0.092, 0.001)* (4.458, 5.429) (-0.272, -0.007)* Cash Collection 331 (2.547, 3.621)** (-0.116, 0.106)** (3.434, 4.572)** (-0.141, 0.148)** Check Deposits 361 (2.555, 3.629)** (-0.091, 0.116)** (3.547, 4.686)** (-0.118, 0.169)** Cash Deposits 909 (2.730, 3.202)* (-0.054, 0.040)* (4.055, 4.875)* (-0.129, 0.103)** Inventory 1,095 (5.642, 6.128) (-0.069, 0.015)* (4.137, 5.909)* (-0.254, 0.034)* Purchases 201 (2.734, 3.907)** (-0.081, 0.134)** (3.472, 4.880)** (-0.135, 0.209)** Purchase Returns 82 (1.791, 3.615)** (-0.037, 0.411)** (1.509, 3.534)* (-0.045, 0.505)**
* Indicates the CI overlaps with the Benford CI but does not contain the parameter.
** Indicates the CI contains the Benford parameter.
(d) Data obtained from a retail Mexican company located in Mexico City.
NA Small sample size (i.e., N=14 or 59) or non-existent observations.
0 3.23917
1 0.04802 0 3.96226 10.06544
0 3.23917
45
iWe translated the Mexican retail company’s comments from Spanish to English. The following statement is the original
comments in Spanish for Division 1: “Los resultados que arroja el estudio con relación a la División 1, si coinciden con los movimientos anormales detectados en los inventarios con base en nuestra auditoria. Actualmente, estos movimientos son investigados para descartar posibles fraudes en el inventario.”
iiWe translated the Mexican retail company’s comments from Spanish to English. The following statements are the original
comments in Spanish for Division 2 and Division 3: “Los resultados que arroja el estudio con relación a la División 2, también coinciden con los movimientos anormales en las ventas al contado y en el inventario. Sin embargo, nuestras investigaciones indican que las fluctuaciones en las ventas al contado tienen que ver con los periodos de promoción y que no existe alguna posibilidad de error material en ambas cuentas.”
“Los resultados que arroja el estudio con relación a la División 3 si coinciden con la realidad. Efectivamente, hemos detectado la existencia de transacciones anormales en las cuentas de inventario y ventas al contado. Nuestras
investigaciones confirman que estas transacciones son fraudulentas. Actualmente, estamos tomando medidas con respecto a esta situación crítica”