econ
stor
www.econstor.eu
Der Open-Access-Publikationsserver der ZBW – Leibniz-Informationszentrum Wirtschaft
The Open Access Publication Server of the ZBW – Leibniz Information Centre for Economics
Standard-Nutzungsbedingungen:
Die Dokumente auf EconStor dürfen zu eigenen wissenschaftlichen Zwecken und zum Privatgebrauch gespeichert und kopiert werden. Sie dürfen die Dokumente nicht für öffentliche oder kommerzielle Zwecke vervielfältigen, öffentlich ausstellen, öffentlich zugänglich machen, vertreiben oder anderweitig nutzen.
Sofern die Verfasser die Dokumente unter Open-Content-Lizenzen (insbesondere CC-Lizenzen) zur Verfügung gestellt haben sollten, gelten abweichend von diesen Nutzungsbedingungen die in der dort genannten Lizenz gewährten Nutzungsrechte.
Terms of use:
Documents in EconStor may be saved and copied for your personal and scholarly purposes.
You are not to copy documents for public or commercial purposes, to exhibit the documents publicly, to make them publicly available on the internet, or to distribute or otherwise use the documents in public.
If the documents have been made available under an Open Content Licence (especially Creative Commons Licences), you may exercise further usage rights as specified in the indicated licence.
Buettner, Thiess; Kauder, Björn
Working Paper
Revenue forecasting practices : differences across
countries and consequences for forecasting
performance
CESifo Working Paper, No. 2628 Provided in Cooperation with:
Ifo Institute – Leibniz Institute for Economic Research at the University of Munich
Suggested Citation: Buettner, Thiess; Kauder, Björn (2009) : Revenue forecasting practices : differences across countries and consequences for forecasting performance, CESifo Working Paper, No. 2628
This Version is available at: http://hdl.handle.net/10419/30459
Revenue Forecasting Practices: Differences
across Countries and Consequences for
Forecasting Performance
T
HIESS
B
UETTNER
B
JOERN
K
AUDER
CES
IFO
W
ORKING
P
APER
N
O
.
2628
C
ATEGORY1:
P
UBLICF
INANCEA
PRIL2009
An electronic version of the paper may be downloaded
• from the SSRN website: www.SSRN.com
• from the RePEc website: www.RePEc.org
CESifo
Working Paper No. 2628
Revenue Forecasting Practices: Differences
across Countries and Consequences for
Forecasting Performance
Abstract
This paper reviews the practice and performance of revenue forecasting in selected OECD
countries. While the mean forecast errors are small in most countries, the precision of the
forecasts measured by the standard deviation of the forecast error differs substantially across
countries. Based on a comparison of forecasting practices we show that these differences can
be attributed to a large part to differences in the timing of the forecasts and in the tax
structure. In addition, we find some evidence that differences in methods and institutions also
matter for the forecasting precision. In particular, we find that the use of macroeconomic
models as well as the independence of revenue forecasting are associated with a lower
standard deviation of the forecast error.
JEL Code: H68, H11.
Keywords: revenue forecasting, international comparison, OECD countries, forecast error.
Thiess Buettner
Ifo Institute for Economic Research at the
University of Munich
Poschingerstrasse 5
81679 Munich
Germany
[email protected]
Bjoern Kauder
Ifo Institute for Economic Research at the
University of Munich
Poschingerstrasse 5
81679 Munich
Germany
[email protected]
February 2009
The authors are grateful to many people that helped to collect information about revenue
forecasting in different countries, in particular to Sabatino Alimenti, Frits Bos, John Conlon,
Carl Emmerson, Martin Keene, Maria Rosaria Marino, Toru Oe, Tim Pike, Anton Rainer,
Mark Rider, Ken Shinohara, Christian Valenduc, and David Wildasin. However, the authors
are fully responsible for any remaining errors.
1
Introduction
Revenue forecasting is an essential part of budgeting in the public sector and, hence, all countries
make some efforts to obtain reliable figures for the expected revenues. Of course, preparing
rev-enue forecasts is associated with some uncertainties, such as macroeconomic risks or uncertainties
about the tax law and its enforcement. Furthermore, there are changes in tax laws and structural
changes in the economy that make forecasting even more difficult. Another possible uncertainty
lies in repercussions of the revenue developments on public spending and the associated
macro-economic consequences. Although these challenges are faced by forecasters in all countries, there
are significant differences in the practice of revenue forecasting. Not only are there differences in
methodologies used. The countries also show important differences in the institutional aspects of
revenue forecasting. In several countries the government is directly in charge, other countries assign
the forecasting task to research institutes, and emphasize the independence of forecasting. This
raises the question of whether the forecasting performance is affected by the different practices
and methodologies involved. Moreover, given the efforts that some countries devote to ensuring
independence from possible government manipulation, it would be interesting to know whether this
independence has a noticeable impact on the quality of the forecasts.
The performance of revenue forecasting and its possible determinants including institutional aspects
have been explored in the literature in different directions (for a recent survey see Leal, Perez,
Tujula, and Vidal, 2008). Revenue forecasting has received most attention in the context of US
states’ revenue forecasts. Feenberg, Gentry, Gilroy, and Rosen (1989), for instance, provide evidence
for biases associated with the electoral cycle. Bretschneider, Gorr, Grizzle, and Klay (1989) focus
on the accuracy of revenue forecasts and find that accuracy is higher in US states with competing
forecasts from executive and legislative branches. Moreover, Krause, Lewis, and Douglas (2006)
provide some evidence that the accuracy of states’ revenue fund estimates depend systematically
on the staffing of the revenue forecasting teams. As Bretschneider et al. note, however, the design
of US state governments has specific features such as balanced–budget rules and a rivalry between
executive and legislative branches of government which may explain some of these results.
International comparisons have mainly centered around the broader issue of budget and deficit
forecasting. Recently, the relative performance of deficit forecasts among the EU countries has
been examined in the context of the Stability and Growth Pact. Jonung and Larch (2006), for
instance, have discussed the political biases in the output forecasts used for deficit projections.
International comparisons concerned with the more narrow issue of revenue forecasting, however,
focus on developing countries (e.g., Kyobe and Danninger, 2005) where institutions relevant for
revenue forecasting are underdeveloped (Danninger, 2005).
Against this background this paper provides an analysis of the performance of revenue forecasting
and its determinants among twelve OECD countries. The selection of countries aims at
captur-ing the seven largest OECD economies (United States, Japan, Germany, Italy, UK, France, and
Canada). Some further countries were added where detailed information about revenue
forecast-ing was available. This includes selected countries in Western Europe (Austria, Belgium, Ireland,
Netherlands) and New Zealand.
to some extent driven by country characteristics such as the tax structure both in terms of the
sheer number of taxes as well as with regard to the importance of corporation and income taxes.
Also differences in the timing of the forecasts prove important. Controlling for these differences we
also find that the precision of revenue forecasting increases with the independence of forecasts from
possible government manipulation and if the revenue forecast is embedded in a macroeconomic
model.
The following section presents some descriptive statistics on the performance of revenue forecasting
in the sample of OECD countries. Section 3 provides a brief overview on the different conditions
that forecasters face in these countries. Section 4 gives a short account of the forecasting
method-ologies used in the various countries. Section 5 provides an overview of the institutional aspects
of the forecasting task among the selected OECD countries and sets up a simple indicator of the
independence of revenue forecasting. Section 6 presents empirical evidence on the determinants of
forecasting performance. Section 7 provides our conclusions.
2
Forecasting Performance
A common way to assess the quality of revenue forecasts is to consider the prediction error, that is
the difference between predicted and realized revenues. A smaller prediction error is then usually
regarded as a better forecast quality. However, it should be noted that revenue forecasts are
basi-cally used to indicate the revenue constraint that needs to be taken into account in the preparation
of the public budget. Often, the budget will include expenditures that have a direct or indirect
is not clear whether this constitutes an improvement of a forecast that basically aims at providing
the policy maker with information about the revenue constraint. In the discussion of the
revi-sions of US revenue forecasts, therefore, policy changes are distinguished from (macro-)economic
and so-called technical sources (Auerbach, 1999) of forecast errors, where the latter may refer to
tax administration or evasion, for instance. However, for most countries a decomposition is not
available. Therefore, the quantitative analysis presented below is based on the overall forecast
error.
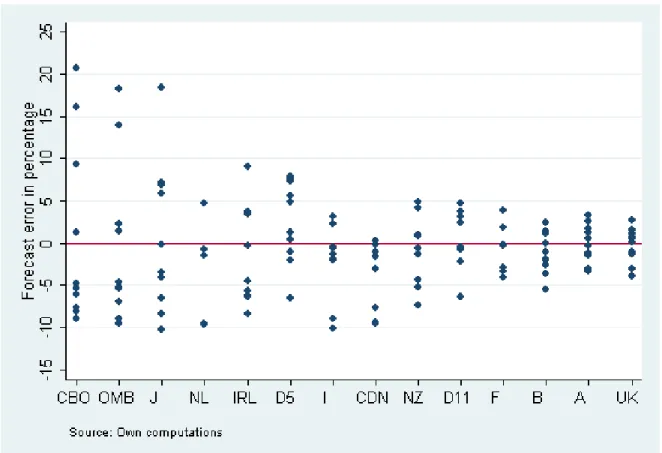
The one-year-ahead forecast errors for total revenues observed over the last ten years1 are
graph-ically depicted in Figure 1, where each point represents a single forecast error. Note that the
forecasts are arranged in this figure in descending order of the respective standard deviation of
the forecast error. At first sight the figure seems to suggest that in most cases there is some
underestimation going on. But there are also instances of large overestimations.
Table 1 provides the corresponding figures for the mean forecast error and its standard deviation.
A positive sign indicates an overestimation of revenues, a negative sign an underestimation. In all
cases, except for Germany, Japan, and the CBO forecast in the United States, there is a slight
underestimation of revenues. The largest mean is found for the Canadian forecast which shows an
underestimation of 4.4 % on average. However, given the large standard deviations this is the only
case where the mean shows a statistically significant difference from zero at reasonable levels of
significance.
As a measure of the precision of forecasts we rely on the standard deviation of the forecast error.
1 In the case of Italy there are just nine years, in the case of France eight years, and for the Netherlands due to
Figure 1: Forecast Errors
CBO: US Congressional Budet Office, OMB: US Office of Management and Budget, J: Japan, NL: Nether-lands, IRL: Ireland, D5: Germany May Forecast, I: Italy, CDN: Canada, NZ: New Zealand, D11: Germany November Forecast, F: France, B: Belgium, A: Austria, UK: United Kingdom.
Figure displays the one-year-ahead forecast errors for total tax revenues in percentage for up to ten years in each country, each point representing one forecast. A positive (negative) value denotes overestimation (un-derestimation). The forecasts are arranged in descending order of the standard deviation of the respective forecast errors. The two US forecasts only refer to federal taxes.
Table 1: Descriptive Statistics of Forecast Errors
Country Mean Std.dev. Obs. (1) (2) (3) Austria -0.037 2.279 10 Belgium -1.193 2.478 10 Canada -4.363 4.163 10 France -1.025 2.808 8 Germany: May 2.496 4.859 10 Germany: Nov 0.498 3.485 10 Ireland -2.133 5.759 10 Italy -2.249 4.538 9 Japan 0.516 8.911 10 Netherlands -3.403 6.203 5 New Zealand -1.291 4.063 10 United Kingdom -0.286 2.069 10 USA: CBO 0.609 10.879 10 USA: OMB -0.522 9.613 10 Average -0.777 5.812 132
The first column shows the mean of the one-year-ahead forecast error for total revenues in percentage. A positive (negative) value denotes overestimation (underestimation). The second column depicts the standard deviation of the forecast error in percentage. The last column reports the number of observations.
The most precise forecast would then show the smallest standard deviation of the forecast error.
Taking into account that in most cases no significant bias is found, this forecast would also be the
most efficient one. As can be seen in Column (2) of Table 1 the highest precision is achieved in the
United Kingdom and Austria, while we find the lowest precision in the United States and Japan.
3
Conditions Faced by Forecasters
An assessment of the considerable differences in the precision of forecasts needs to take account of
the different conditions faced by the forecaster. First of all this is an issue of the point of time when
the forecast is made. This can be illustrated by the two German forecasts that take place in May
and November while the budget period starts in January. The standard deviation decreases in the
latter by about a quarter presumably due to the decreasing degree of uncertainty, which is naturally
lower in November than in March. But also across countries there are important differences in the
time span between the forecast and the beginning of the forecasted period (see Column (1) of Table
2). Actually, this time span varies between less than one and 9.5 months.
A second important difference lies in the tax structure of the countries. In particular, the degree
of differentiation of the tax system might matter. Rather than relying on few large taxes a country
might employ a variety of smaller tax instruments and, thereby, reduce the revenue risks associated
with the tax system. Therefore, forecasting the revenues of a large variety of small taxes might be
easier than predicting the revenues in a system that relies on a small number of large taxes. To
capture the differentiation of the tax structure we use an indicator of the number of taxes. For
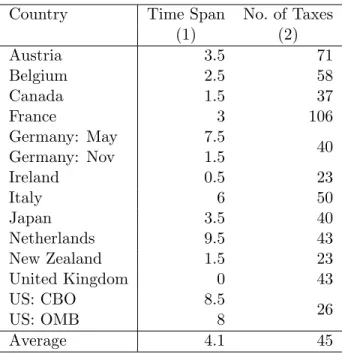
Table 2: Forecasting Conditions
Country Time Span No. of Taxes (1) (2) Austria 3.5 71 Belgium 2.5 58 Canada 1.5 37 France 3 106 Germany: May 7.5 40 Germany: Nov 1.5 Ireland 0.5 23 Italy 6 50 Japan 3.5 40 Netherlands 9.5 43 New Zealand 1.5 23 United Kingdom 0 43 US: CBO 8.5 26 US: OMB 8 Average 4.1 45
The time span in the first column measures the period between the forecast and the beginning of the forecasted period in months. In the second column the number of taxes existing in the respective country is shown based on the OECD Revenue Statistics.
detailed classification of taxes and count all items with positive revenues. This is, of course, just
an approximation, as the OECD classification meets the various tax systems to a different extent.
However, as documented in Column (2) there are large differences across countries/forecasts.
Some taxes might be more difficult to predict than others. For instance, we might expect that there
are significant differences in the precision when forecasting corporation or income taxes as compared
to sales and value added taxes. This calls for a separate analysis of forecast errors according to the
type of tax considered (see below).
4
Forecasting Methodology
The forecasting methodology used by the fourteen regular revenue forecasts that are surveyed in
this paper shows several similarities. In all countries, the forecasts are prepared in a disaggregated
fashion for a number of single taxes, whereby often individual taxes are aggregated into groups
especially if they share the same source or tax payer. This partly reflects the need to employ
up-to-date information on current revenues, which is available usually only on a cash basis.
A typical feature of revenue forecasting is that taxes which are strongly driven by macroeconomic
developments such as corporation taxes or wage and income taxes are forecasted with indirect
methods. In these cases revenue estimation relies on information about macroeconomic variables
such as GDP, or components of the national accounts, like income from entrepreneurial activity
and capital or the wage bill. Predominantly, the elasticity method is employed where some
the macroeconomic indicators. Some forecasts (United Kingdom, Netherlands, New Zealand, and
Japan) reportedly make use of econometric models where the relationship between revenues and
economic indicators is directly estimated using regression analysis.
In some cases the use of micro-simulation methods is reported which are focusing on individual
tax payers such as households or corporations and where the accrued taxes for each individual are
calculated and aggregated afterwards. This approach is used in the Netherlands and the United
States in forecasting income taxes, in the United Kingdom and the United States for predicting
corporation tax revenues.
While the macroeconomic forecasts are used as exogenous variables in countries such as Germany
and Belgium, repercussions of revenue forecasts on the macroeconomic forecast over the budget are
taken into account in some other countries. In particular, revenue forecasts that are embedded in
a macroeconomic model (United Kingdom and Netherlands) produce a consistent set of
macroe-conomic and revenue forecasts. Other countries such as Ireland, New Zealand, and the United
States (CBO) report the mutual verification and acknowledgement of macroeconomic and revenue
forecasts.
For less important taxes – in terms of revenues – like excise taxes, but also for taxes with just a
weak relation to macroeconomic variables usually direct methods are employed. These methods,
like trend-extrapolation or more formal time-series analysis, use revenue data of the respective tax
from previous years to predict the expected development. Also the usage of vector-autoregressive
methods for groups of taxes is reported.
if changes are planned but have not yet been enacted as a law. In some countries, it is common
practice to include changes that are agreed within the government (Austria, Netherlands) or noted
in the budget plan (Ireland). Even if tax law changes that are just planned are not directly taken
into account in the forecast, their expected macroeconomic impact sometimes leads to an indirect
influence on the forecast.
5
Institutions and Independence
A basic institutional aspect of revenue forecasting is the assignment of the forecasting task to specific
institutions. Interestingly, forecasting is not always assigned to a department of the government
or, more precisely, to the executive branch of the government. Only in about half of the fourteen
forecasts surveyed in this paper it is the Ministry of Finance (Belgium, France, Italy, Ireland, Japan)
or the Treasury (United Kingdom, New Zealand) that is responsible. In most other cases forecasting
is assigned to a group representing different institutions, not only from the government. Some
countries even assign the primary responsibility for revenue forecasting to independent research
institutes (Netherlands) and limit the influence of government to merely consult forecasters. In the
other countries, even if the Ministry of Finance or another part of the government is responsible,
often external experts from academia or forecasting agencies are included in the forecasting group.
The efforts to involve institutions that are not part of the government or other external experts
are usually justified as a means to raise the independence of the revenue forecasting from
possi-ble manipulation and strategic influences by the government. Several countries explicitly produce
Germany and Austria). However, the extent to which forecasting is independent from
govern-ment manipulation is not only depending on the assigngovern-ment of the forecasting responsibility but
also on whether revenue forecasting is based on some official predictions for the macroeconomic
development, as is the case with the German forecast.
Table 3 presents information about how revenue forecasting differs with respect to these issues.
The first column indicates whether the government (=0), research institutes (=1) or both jointly
(=0.5) are responsible for the forecast. In some cases there are no research institutes involved,
but in order to preserve a certain degree of independence there are external experts consulted (see
Column (2)). This is the case for the US forecasts of the Congressional Budget Office (CBO) and
the Office of Management and Budget (OMB). In the case of the United Kingdom a value of 0.5 is
entered, in order to take account of the reported partial consultation of experts. Also for Germany
a figure 0.5 is entered in order to account for the additional participation of the German central
bank. For the Netherlands a figure of -1 is entered to take account of the consulting participation
of the ministry of finance that may tend to reduce independence. Even if the revenue forecast is
done with collaboration of the government, in some countries an external, non-government
macroe-conomic forecast is used. Therefore, the third column provides information about the source of the
macroeconomic forecast. A value of one indicates that an external forecast is used.
By summing across the first three columns we obtain a simple indicator of the independence of
revenue forecasting. The first column is weighted with unity, the second and the third columns are
weighted with 0.25. The rational behind this weighting is the following: a revenue forecast that
is conducted by a research institute without any government experts involved would display the
employs an external macroeconomic forecast would obtain a medium level of independence (=0.5).
A government forecast without any external experts and without an external macroeconomic
fore-cast would be assigned the lowest level of independence (=0).
While the indicator varies from zero (=no independence) to unity (=full independence), in our
sample of countries the highest degree of independence is 0.75. As can be seen, the indicator
is highest for the Netherlands and Austria, followed by Germany. A small, but positive level of
independence can be found in Canada, New Zealand, Belgium and the United Kingdom. The United
States case is somewhat special since here two separate forecasts exist. One is conducted by the
Office of Management and Budget (OMB) that assists the executive branch, the other is conducted
by the Congressional Budget Office (CBO) that is assigned to the legislative branch. While their
incentives to strategically manipulate forecasts might differ, our indicator of independence, which is
simply assessing the institutional conditions, assigns a low value of independence to both of them.2
The general composition of the index with its emphasis on research institutes, external experts, and
the source of the macroeconomic forecast reflects the main institutional characteristics of revenue
forecasting. Yet the weights, used to aggregate the information about these institutional aspects,
are somewhat arbitrary. Therefore, we conducted some robustness checks where the weights for
external experts and external macroeconomic forecasts were increased or lowered. With regard to
the ranking, however, only minor changes were found. We will come back to this issue below, where
we explore whether the index of independence has sufficient informational content in order to help
explaining the observed performance.
2Bretschneideret al. (1989) argue that the existence of two separate forecasts by the legislative and the executive
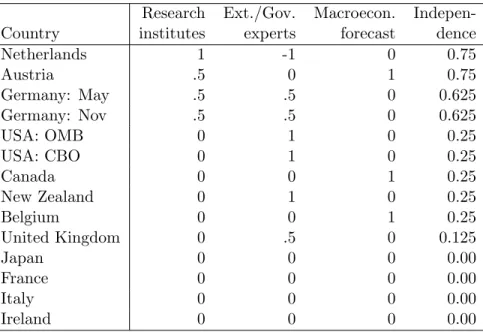
Table 3: Institutional Characteristics and Independence
Research Ext./Gov. Macroecon. Indepen-Country institutes experts forecast dence
Netherlands 1 -1 0 0.75 Austria .5 0 1 0.75 Germany: May .5 .5 0 0.625 Germany: Nov .5 .5 0 0.625 USA: OMB 0 1 0 0.25 USA: CBO 0 1 0 0.25 Canada 0 0 1 0.25 New Zealand 0 1 0 0.25 Belgium 0 0 1 0.25 United Kingdom 0 .5 0 0.125 Japan 0 0 0 0.00 France 0 0 0 0.00 Italy 0 0 0 0.00 Ireland 0 0 0 0.00
First column indicates whether the government (=0), research institutes (=1) or both jointly are responsible for the forecast (=0.5). Second column indicates whether external (=1) or government experts (=-1) are involved. For the United Kingdom a value of 0.5 is entered, in order to take account of the reported partial consultation of experts. In Germany a figure 0.5 is entered in order to account for the participation of the central bank. Third column provides information about whether an external, non-government macroeconomic forecast is used. The degree of independence in the last column is obtained as a weighted sum of the first three columns. The first column is weighted with unity, the second and the third columns are weighted with 0.25 (see text).
6
Determinants of Forecasting Performance
Having outlined differences in forecasting conditions and practices let us finally turn to the question
as to what extent they are associated with the large differences in forecasting performance noted
above. Since in most cases the mean forecast error does not point at significant biases, we focus
on the precision of forecasting as documented by the standard deviation of forecast errors. More
specifically, we analyze the precision of the forecasts for total revenues as well as for revenues
grouped using a broad classification of the sources of taxation.
The first two regressions in Table 4 explore whether differences in forecasting conditions show
some significant relation with the standard deviation of the forecast error for total tax revenues.
Column (1) just includes the time span between the forecast and forecasted period and indicates
that the uncertainty increases considerably with the time span: every additional month increases
the standard deviation by a half percentage point. In Column (2) we have included the number
of individual taxes as a measure of the differentiation of the tax system. Accordingly, forecasting
is more accurate in countries where the number of taxes is large. The coefficient of determination
indicates that about two thirds of the variation in the forecasting accuracy are associated with
differences in the time span and the number of taxes involved.
Columns (3) and (4) show the same specifications augmented with our indicator of independence
of revenue forecasting. While the results from Columns (1) and (2) are confirmed, we find that the
precision of the forecast is positively associated with independence. As the indicator of
indepen-dence rests on a weighted sum of three institutional characteristics we conducted some robustness
T able 4: Dete rm inan ts of F orecasting Precision (1) (2) (3) (4) (5) (6) (7) Constan t 5.25 ? 18.39 ? 6.58 ? 18.03 ? 5.44 ? 18.30 ? 17.98 ? (.624) (4.35) (.854) (3.77) (.676) (4.40) (3.86) Time span .573 ? .533 ? .694 ? .634 ? .570 ? .532 ? .628 ? (.205) (.159) (.191) (.145) (.208) (.161) (.149) log No. of taxes -3.57 ? -3.18 ? -3.50 ? -3.14 ? (1.17) (1.03) (1.19) (1.06) Indep endence -4.55 ? -3.65 ? -3.49 ? (2.21) (1.68) (1.74) Macro mo del -1.56 -1.27 -.951 (1.91) (1.47) (1.30) R 2 0.393 0.671 0.562 0.776 0.428 0.694 0.788 Observ ations 14 14 14 14 14 14 14 Dep enden t v ariable: Standard deviatio n of one-y ear-ahead forecast error for total tax rev en ues. W eigh ted least squares estima tes taking accoun t of the n um b er of forecasts considered in th e computation of the standard deviation. Standard errors in paren theses. A star denotes significance at the 10 % lev el.
external experts or external macroeconomic forecasts are increased or lowered by 0.1, for instance,
all effects are confirmed while the coefficient of determination is slightly lower with these
alterna-tive weights. The specification in Column (4) indicates that about three fourth of the variation in
the precision can be attributed to the time span, the number of taxes involved, and the degree of
independence.
The results presented in Columns (5) to (7) indicate that embedding revenue forecasts into a
macroeconomic model is associated with a higher precision. However, this effect is not significant.
In further experiments (not shown) we tested for an association with the country size but did not
find any significance.
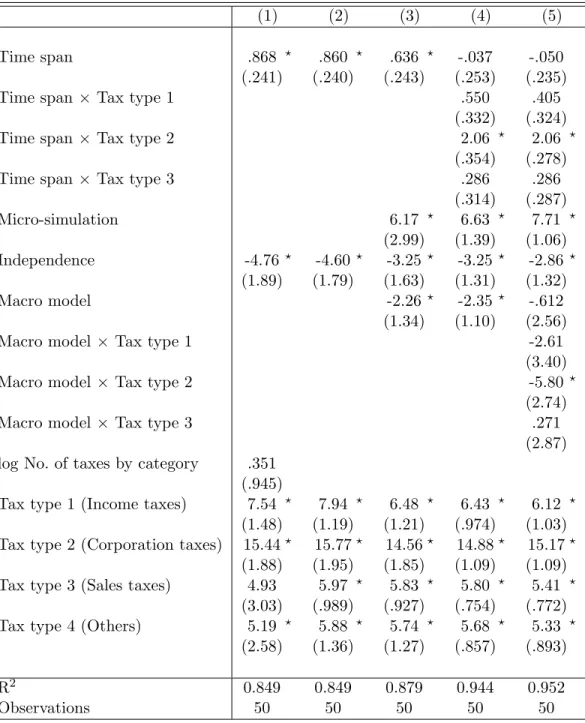
Table 5 provides results for the precision of forecasts decomposed into four different types of taxes:
(personal) income taxes, corporation taxes, sales taxes and other taxes. Thus, for each group of
taxes we compute a separate standard deviation of the forecast error.3 A first specification uses
a similar set of variables as Column (4) of Table 4. In addition, it includes dummy variables for
each group of taxes. The coefficients of these variables point at strong differences in forecasting
accuracy: income taxes and, in particular, corporation taxes show a much larger standard deviation
of the forecast error. While the dummy variables point at an important role of the tax structure,
the number of taxes in each group does not show a significant effect (see Column 1). However,
further inspection revealed that the number of taxes is particularly high among sales and other
taxes. Hence, the negative significant effect of the number of taxes obtained in the above analysis
of the total forecast error is now picked up by the dummy variables for the groups of taxes. We,
therefore, exclude the number of taxes in the subsequent analysis and focus on the dummy
Table 5: Determinants of Forecasting Precision by Type of Tax
(1) (2) (3) (4) (5)
Time span .868 ? .860 ? .636 ? -.037 -.050 (.241) (.240) (.243) (.253) (.235) Time span× Tax type 1 .550 .405
(.332) (.324) Time span× Tax type 2 2.06 ? 2.06 ?
(.354) (.278) Time span× Tax type 3 .286 .286
(.314) (.287) Micro-simulation 6.17 ? 6.63 ? 7.71 ? (2.99) (1.39) (1.06) Independence -4.76? -4.60? -3.25? -3.25? -2.86? (1.89) (1.79) (1.63) (1.31) (1.32) Macro model -2.26? -2.35? -.612 (1.34) (1.10) (2.56) Macro model ×Tax type 1 -2.61
(3.40) Macro model ×Tax type 2 -5.80?
(2.74)
Macro model ×Tax type 3 .271
(2.87) log No. of taxes by category .351
(.945)
Tax type 1 (Income taxes) 7.54 ? 7.94 ? 6.48 ? 6.43 ? 6.12 ?
(1.48) (1.19) (1.21) (.974) (1.03) Tax type 2 (Corporation taxes) 15.44? 15.77? 14.56? 14.88? 15.17?
(1.88) (1.95) (1.85) (1.09) (1.09) Tax type 3 (Sales taxes) 4.93 5.97 ? 5.83 ? 5.80 ? 5.41 ?
(3.03) (.989) (.927) (.754) (.772) Tax type 4 (Others) 5.19 ? 5.88 ? 5.74 ? 5.68 ? 5.33 ?
(2.58) (1.36) (1.27) (.857) (.893)
R2 0.849 0.849 0.879 0.944 0.952
Observations 50 50 50 50 50
Dependent variable: Standard deviation of forecast error for tax revenues grouped into four types of taxes. Weighted least squares estimates taking account of the number of forecasts considered in the computation of the standard deviation. Robust standard errors in parentheses. An asterisk indicates significance at the 10 % level.
ables for the types of taxes. As documented by the coefficient of determination in Column (2),
nevertheless, about 85% of the differences in the precision can be assigned to tax structure, timing,
and independence.
Column (3) includes controls for micro-simulation models used in the respective group and for
embedding the revenue forecast into a macroeconomic model. While the integration of revenue
forecasting into a macroeconomic model is found to improve the quality of the forecast,
micro-simulations seem to be associated with a reduced precision. However, the latter finding might well
reflect a selection effect, since micro-simulation methods might be implemented for those taxes
where the forecaster faces a substantial complexity.
In the fourth specification we control for possible differences in the effect of the timing among the
different groups of taxes. As can be seen, the time span is relevant, particularly for corporation
taxes, but also for income taxes. Probably, the precision of the GDP forecast is very important for
these taxes; and this precision is very likely to decrease with the time span. In Column (5) also
the effect of embedding the forecast into a macroeconomic model is allowed to differ between the
various groups of taxes. Since the standard deviation of the forecast error is significantly lower,
macroeconomic models are found to be particularly helpful in predicting corporation taxes. This
7
Conclusions
In this paper we have compared revenue forecasting practice and performance across selected OECD
countries. While the mean one-year-ahead forecast error is small in most countries, the precision of
the forecasts measured by the standard deviation of the forecast error differs substantially across
countries. This raises the question of whether differences in the performance are associated with
the practice of revenue forecasting in these countries.
A consideration of methodological aspects shows fairly similar approaches among all countries.
Taxes being sensitive to the business cycle (such as income and corporation taxes) are mainly
forecasted with indirect methods that are based on macroeconomic indicators. For other taxes,
direct methods are employed, where the forecast is a function of the revenues from previous years.
Methodological differences are found with regard to macroeconomic models and micro-simulation
models. In some countries revenue forecasts are directly embedded in a macroeconomic model,
where budgetary repercussions are directly taken into account. Micro-simulations are used in some
countries to predict revenues for specific taxes such as income taxes.
Institutional arrangements vary between countries. While in some countries the ministry of finance
or the treasury is responsible, other countries assign the forecasting task to research institutes.
Further differences arise with regard to the inclusion of external experts and with regard to the
source of macroeconomic forecasts. To summarize these differences we come up with an index of
the independence from possible government manipulation. According to this index the revenue
The quantitative analysis shows that the cross-country differences in the performance of revenue
forecasting are to some extent driven by country characteristics such as the tax structure with regard
to the number of taxes and the importance of income and corporation taxes. Also differences in
the timing of the forecasts prove important. Controlling for these differences we also find that the
precision of revenue forecasting increases with the independence of forecasts. About three quarters
of the differences in accuracy concerning the total revenues can be explained by differences in the
tax structure, the time span, and the degree of independence.
These results are confirmed when distinguishing between four groups of taxes, i.e. income taxes,
corporation taxes, sales taxes, and a residual category. This analysis further shows that the
fore-casting accuracy is particularly low for corporation taxes. For these taxes we find that the precision
depends strongly on the time-span between the forecast and the beginning of the forecasted period.
With regard to methods, we see that the precision turns out to be rather low where micro-simulation
methods are applied. Embedding the forecast in a macroeconomic model, however, is associated
with a lower standard deviation of the forecast error in particular for the corporation taxes.
Appendix: Sources of Information
A.1 Austria
The revenue forecast for Austria is documented/discussed in:
• Bundesministerium f¨ur Finanzen (2007): Budget 2007-2008, Zahlen – Hintergr¨unde – Zusam-menh¨ange. Online: www.bmf.gv.at
• Homepage of the Ministry of Finance: www.bmf.gv.at
• Leibrecht (2004)
A.2 Belgium
The revenue forecast of the federal government is documented/discussed in:
• Chambre des repr´esentants de Belgique: Budgets des Recettes et des D´epenses pour l’ann´ee budg´etaire 1996, ... pour l’ann´ee budg´etaire 2007, Brussels
• Hertveldt, Bart et al. (2003)
• Lenoir, Thierry und Valenduc, Christian (2006): R´evision de la m´ethode macro-´economique d’estimation des recettes fiscales. Service Public F´ed´eral Finances, Brussels
A.3 Canada
The spring revenue forecast of the Canadian Department of Finance is documented/discussed in:
• M¨uhleisen et al. (2005)
• O’Neill, Tim (2005): Review of Canadian Federal Fiscal Forecasting: Processes and Systems. O’Neill Strategic Economics. Online: www.fin.gc.ca/toce/2005/oneil e.html
• Homepage of the Department of Finance Canada: www.fin.gc.ca
A.4 France
The revenue forecast of the French government is documented/discussed in:
• Homepage of the Juridictions financi`eres: www.ccomptes.fr
• Homepage of the Minist`ere des Finances: www.minefi.gouv.fr
• Homepage of the Minist`ere du Budget, des Comptes Publics et de la fonction publique: www.budget.gouv.fr
A.5 Germany
The centralized forecast of the consensus forecasting group is documented/discussed in:
• Bundesministerium der Finanzen: Finanzbericht 1997-2008
• Bundesministerium der Finanzen (2005): 50 Jahre Arbeitskreis “ Steuersch¨atzung”
• Gebhardt (2001)
• Homepage of the Ministry of Finance: www.bundesfinanzministerium.de
A.6 Ireland
The revenue forecast of the Irish Government is documented/discussed in:
• Budgets of the Department of Finance: www.budget.gov.ie
• Homepage of the Ministry of Finance: www.finance.gov.ie
• Homepage of the Revenue Commissioners: www.revenue.ie
• Minutes of the “Committee of Public Accounts” of the Irish Parliament on 23. January 2003: www.irlgov.ie/committees-29/c-publicaccounts/20030123/Page1.htm
• Report of the Tax Forecasting Methodology Review Group, 2008: www.finance.gov.ie
• The Tax Forecasting Methodology Group, 1999: www.finance.gov.ie
A.7 Italy
The revenue forecast of the Italian government is documented/discussed in:
• Ministero dell’Economia e delle Finanze, Rome: Documento di Programmazione Economico e Finanziaria per gli anni 1998-2000, ... per gli anni 2006-2009
• Istituto Nazionale di Statistica (2007), Rome: Conti e aggregati economici delle Amminis-trazioni pubbliche. Statistiche in breve, anni 1980-2006
A.8 Japan
The revenue forecast of the Japanese government is documented/discussed in:
• Adachi (2006), (in Japanese), PRI Discussion Paper Series, No. 06A-07
• Homepage of the Cabinett Office: www.cao.go.jp
• Homepage of the Ministry of Finance: www.mof.go.jp
A.9 Netherlands
The revenue forecast of the CPB is documented/discussed in:
• Bos (2007).
• CPB Netherlands Bureau for Economic Policy Analysis (2005): Forecasting Tax Revenue. CPB Presentation
• European Commission (2006): European Economy No 3 / 2006, Public finances in EMU – 2006
• Homepage of the CPB Netherlands Bureau for Economic Policy Analysis: www.cpb.nl
• Ministry of Finance (2007): Stability Programme of the Netherlands, November 2007 Update: http://ec.europa.eu/economy finance/about/activities/sgp/
country/countryfiles/dec 2007/nl 2007 en.pdf
• Teulings, Coen (2006): Forecasting, Policy Evaluation and the Budgetary Process. Lessons from the Netherlands. CPB Presentation
A.10 New Zealand
The revenue forecast of the Treasury is documented/discussed in:
• Homepage of the Treasury: www.treasury.govt.nz
• Keene and Thomson (2007)
• New Zealand Treasury (2002): Treasury’s Forecasting Process. Presentation Online: www.treasury.govt.nz
A.11 United Kingdom
The revenue forecast of the Treasury is documented/discussed in:
• HM Treasury (2007a): Budget 2007,HM Treasury, London
• HM Treasury (2007b): Meeting the aspirations of the British people: 2007 Pre-Budget Report and Comprehensive Spending Review,HM Treasury, London
• Homepage of the Treasury: www.hm-treasury.gov.uk
• Pike, Tim und Savage, David (1998): Forecasting the Public Finances in the Treasury. Fiscal Studies 19(1), 49–62
A.12 USA
The forecasts for federal revenues by the Congressional Budget Office and the Office of Management and Budget are documented/discussed in:
• Auerbach (1999).
• Congressional Budget Office (1995): Budget Estimates: Current Practices and Alternative Approaches. CBO Papers Series, Washington D.C.
• Congressional Budget Office (1998): Projecting Federal Tax Revenues and the Effect of Changes in Tax Law Memorandum, Washington D.C.
• Congressional Budget Office (2006): CBO’s Policies for Preparing and Distributing Its Esti-mates and Analyses, Washington D.C.
• Congressional Budget Office (2007): The Uncertainty of Budget Projections: A Discussion of Data and Methods. Memorandum, Washington D.C.
• Homepage of the Congressional Budget Office (CBO): www.cbo.gov
• Homepage of the Office of Management and Budget (OMB): www.whitehouse.gov/omb
• Joint Committee on Taxation (JCT) (1992): Discussion of Revenue Estimation Methodology and Process. US Government Printing Office, Washington D.C.
References
Na-Bos, Frits (2007): The Dutch fiscal framework. History, current practice and the role of the CPB. Online: www.cpb.nl/nl/pub/cpbreeksen/document/150/doc150.pdf.
Bretschneider, S. I., Gorr, W. L., Grizzle, G. and Klay, E. (1989): Political and organizational influences on the accuracy of forecasting state government revenues,International Journal of Forecasting 5 (1989), 307–319.
Boylan, R. T., 2008, Political Distortions in State Forecasts, Public Choice 136, 411–427.
Danninger, S., 2005, Revenue Forecasts as Performance Targets, IMF Working Papers 05/14.
Feenberg, Daniel R., William Gentry, David Gilroy, Harvey S. Rosen (1989): Testing the Ratio-nality of State Revenue Forecasts, Review of Economics and Statistics 71 (2), 300–308.
Gebhardt, Heinz (2001): Methoden, Probleme und Ergebnisse der Steuersch¨atzung,RWI-Mitteilungen 2001, 127–147.
Hertveldt, Bart et al. (2003): Tout savoir sur la confection du budget ´economique. Federal Planning Bureau Working Paper,Brussels.
Keene, Martin und Peter Thomson (2007): An Analysis of Tax Revenue Forecast Errors,Working Paper 07/02, New Zealand Treasury, Wellington.
Krause, George A., David E. Lewis, James W. Douglas (2006): Political Appointments, Civil Service Systems, and Bureaucratic Competence: Organizational Balancing and Executive Branch Revenue Forecasts in the American States,American Journal of Political Science 50, 770–787.
Jonung, L. and Larch, M. (2006): Improving fiscal policy in the EU: the case for independent forecasts,Economic Policy 21, 491–534.
Kyobe, Annette, and Stephan Danninger, 2005. Revenue Forecasting–How is it done? Results from a Survey of Low-Income Countries. IMF Working Papers 05/24.
Leal, T., Perez, J.J., Tujula, M., and J. Vidal, 2008, Fiscal Forecasting: Lessons from the Litera-ture and ChallengesFiscal Studies 29 (3), 347–386.
Leibrecht, Markus (2004): Steuersch¨atzung in ¨Osterreich: Ablauf, Methoden und Pr¨azision der Prognose, Deutscher Universit¨atsverlag, Wiesbaden.
Lenoir, Thierry und Valenduc, Christian (2006): R´evision de la m´ethode macro-´economique d’estimation des recettes fiscales, Brussels.
M¨uhleisen, Martin, Stephan Danninger, David Hauner, Korn´elia Krajny´ak, Bennett Sutton (2005): How Do Canadian Budget Forecasts Compare with Those of Other Industrial Countries? IMF Working Paper, WP/05/66.
Pike, Tim und Savage, David (1998): Forecasting the Public Finances in the Treasury. Fiscal Studies 19(1), 49–62.