Procedia Technology 6 ( 2012 ) 469 – 474
2212-0173 © 2012 The Authors. Published by Elsevier Ltd. Selection and/or peer-review under responsibility of the Department of Computer Science & Engineering, National Institute of Technology Rourkela
doi: 10.1016/j.protcy.2012.10.056
INTERNATIONAL CONFERENCE ON COMMUNICATION COMPUTING AND SECURITY
Using the triangle inequality to accelerate Density based Outlier
Detection Method
Bidyut Kr. Patra
Department of Computer Science & Engineering
National Institute of Technology Rourkela, Rourkela, ORISSA-769 008
Abstract
Discovering outliers in a collection of patterns is a very well known problem that has been studied in various application domains. Density based technique is a popular one for finding outliers in a dataset. This technique calculates outlierness of each pattern using statistics of neighborhood of the pattern. However, density based approaches do not work well with large datasets as these approaches need to compute a large number of distance computations inorder to find neighborhood statistics. In this paper, we propose to utilize triangle inequality based indexing approach to speed up the classical density based outlier detection method LOF. Proposed approach computes less number of distance computations compared to the LOF method. Experimental results demonstrate that our proposed method reduces a significant number of distance computations compared to the LOF method.
c
2012 Published by Elsevier Ltd. Selection and/or peer-review under responsibility of Department of Computer Science and Engineering, National Institute of Technology Rourkela.
Keywords:Outlier detection, LOF, triangle inequality, large datasets.
1. Introduction
Finding outliers in a collection of patterns is a very well known problem in the data mining field. An outlier is a pattern which is dissimilar with respect to the rest of the patterns in the dataset. Depending upon the application domain, outliers are of particular interest. In some cases presence of outliers adversely affect the conclusions drawn out of the analysis and hence need to be eliminated beforehand. In other cases, outliers are the center of interest as in the case of intrusion detection system, credit card fraud detection. There are varied reasons for outlier generation in the first place. For example, outliers may be generated due to measurement impairments, rare normal events exhibiting entirely different characteristics, deliberate actions etc. Detecting outliers may lead to the discovery of truly unexpected behavior and help avoid wrong conclusions etc. Thus irrespective of the underlying causes for outlier generation and insight inferred, these points need to be identified from a collection of patterns. There are
∗Corresponding author. Bidyut Kr. Patra E-mail address:[email protected]
© 2012 The Authors. Published by Elsevier Ltd. Selection and/or peer-review under responsibility of the Department of Computer Science & Engineering, National Institute of Technology Rourkela Open access under CC BY-NC-ND license.
number of methods proposed in the literature for detecting outliers (Chandola, Banerjee & Kumar 2009) and are mainly of two types as distance based and density based.
Distance based:These techniques count the number of patterns falling within a selected threshold distanceRfrom a pointxin the dataset. If the count is more than a preset number of patterns thenxis considered as normal and otherwise outlier. DB-Outlier (Knorr & Ng 1998), DOLPHIN (Angiulli & Fassetti 2009) are of this type.
Density based:These techniques measure density of a pointxwithin a small region by counting number of points within a neighborhood region. Breunig et al. (Breunig, Kriegel, Ng & Sander 2000) introduced a concept of local outliers which are detected based on the local density of points. Local density of a pointxdepends on itsKnearest neighbor points. A score known as Local Outlier Factor is assigned to every point based on this local density. All data points are sorted in decreasing order of LOF value. Topmpoints are chosen as outliers from this sorted order. However, LOF does not work well with large datasets as it computes a large number of distance calculations in order to findKnearest neighbors of each pattern in the dataset.
In this paper, we propose an approach calledTI-LOF to accelerate the LOF outlier detection method for large datasets. ProposedTI-LOF uses an indexing method called TI-K-Neighborhood-Index (Kryszkiewicz & Lasek 2010a) to quickly find theKnearest neighbors of each pattern in the data. TI-K-Neighborhood-Index uses triangle inequality property of metric space to reduce the search space. Subsequently, this information is used to calculate LOF of each point in the dataset. TI-LOF performs less distance computations and takes less time compared to the classical LOF method. Experimental results validate our claim.
Rest of the paper is organized as follows. Section 2 discusses background of the proposed approach. Section 3 discusses the proposed speeding up approachTI-LOF. Experimental evaluations are reported in section 4. Finally, we conclude with section 5.
2. Background of Proposed Approach
Our proposed approach utilizes TI-K-Neighborhood-Index to speed up density based outlier detection method LOF. These two methods are discussed briefly in this section.
2.1. TI-K-Neighborhood-Index Approach
Our proposed speeding up approachTI-LOF exploits an indexing scheme TI-K-Neighborhood-Index (Kryszkiewicz & Lasek 2010a) which is based on triangle inequality property. In recent years, triangle inequality property of the metric space has been used to reduce the distance computations in the clustering methods (Elkan 2003, Nassar, Sander & Cheng 2004, Kryszkiewicz & Lasek 2010b). Elkan (Elkan 2003) used triangle inequality to reduce the distance computation ink-means clustering method. Nassar (Nassar, Sander & Cheng 2004) used for speeding up summariza-tion scheme (data bubble). Recently, Marzena et al. (Kryszkiewicz & Lasek 2010b) proposed to speed up DBSCAN method using triangle inequality. TI-K-Neighborhood-Index is also proposed by Marzena et al. in (Kryszkiewicz & Lasek 2010a). It works as follows.
Initially, data points are arranged in a sorted (ascending ) list with respect to the magnitudes (norm) of the points. For each pointx∈D, the approach collectsK succeeding and preceding points ofxfrom the sorted list. TheseK points (say,qs) are chosen in a way such that difference in normsbetweenx(||x||) and these points (||q|| ) are minimum compared to other points in the list. Theseq points determines a radiusEPSof a sphere centered at x, which covers allKnearest neighbors ofx. The radiusEPSis the maximum of distances betweenxandqs.Utilizing the Theorem 1, the TI-K-Neighborhood-Index approach discards many points, which cannot beKnearest neighbors ofxwithout computing distances betweenxand discarded points. Therefore, a large number of distance computations can be avoided in this process. Subsequently, it findsKnearest neighbors ofxcomputing distances betweenxand rest of the points in the list. It checks each pointp(starting from closest point ofx) preceding and followingxfor the potentialKneighbors. The whole approach is depicted in Algorithm 1.
their magnitudes (norm) of the points. Let x be any point in D,and EPS∈
R
+be a value such that|NEPS(x)1|>=K. Let qf and qbbe preceding and succeeding points of x in the ordered set D,respectively such that||qf|| − ||x||> EPS and||x|| − ||qb||>EPS.Then1. qf and all points following qf do not belong to K neighborhood of x.
2. qband all points preceding qbdo not belong to K neighborhood of x.
Algorithm 1T I-k-Neighborhood-Index(
D
,K)foreach patternx∈
D
doCalculate||x|| end for
Make a listT of all sorted patterns, which are ordered in ascending order with respect to| |.| |
foreach patternx∈T do
PickKpatterns(qs)preceding and succeedingxsuch that||x|| − ||q||is minimum. CalculateEPS=maxi..K||x−qi||
KNN Set(x) =/0
Letpibe the closest pattern precedingxin listT. while(||x|| − ||pi|| ≤EPS)do
if(||x−pi|| ≤EPS)then
KNN Set(x) =KNN Set(x)∪ {pi}and store distance betweenxandpi if(There exists an immediate preceding pointpi+1inT)then
pi=pi+1 end if
EPS=maximum of computed distance betweenxandp∈KNN Set(x).
end if end while
Letqibe the closest pattern succeedingxin listT. while(||x|| − ||qi|| ≤EPS)do
if(||x−qi|| ≤EPS)then
KNN Set(x) =KNN Set∪{qi}and store distance betweenxandqi if(There is an immediate succeeding pointqi+1inT)then
qi=qi+1 end if
EPS=maximum of computed distance betweenxandq∈KNN Set(x).
end if end while
Sort all points in KNN Set and output firstKpoints asKnearest neighbors ofx end for
2.2. LOF:Identifying Density-Based Local Outliers
M.M.Breunig (Breunig et al. 2000) proposed a density based outlier detection method called LOF. This method introduces a factor calledlocal outlier f actor(lo f)to measure the degree of outlierness of a pattern in the dataset. The method uses theKnearest neighbor statistics to calculatelofof data points. To make our article more convenient to reader, we recall definitions ofreachability-distance
(reach-dist),local reachability density(lrd)and finally,local outlier f actor(lo f). 1N
Definition 1 (Reachability distance (reach-dist) of a point) Let x,y be two arbitrary points in a dataset
D
and K-NN(y)be K nearest points of y.The reachability distance of x with respect to y is defined as follow.reach-dist(x,y) =
||x−y|| if x∈/K-NN(y)
max{||y−q|| |q∈K-NN(y)} if x∈K-NN(y),
Definition 2 (Local reachability density (lrd) of a point) Let K-NN(x)be the K- nearest neighbors of x∈
D
.Local reachability density (lrd) is defined as follow.lrd(x) =1/∑o∈K-NN(x)reach-dist(x,o) |KNN(x)|
Definition 3 (local outlier factor of a point) The local outlier factor of x∈
D
is defined aslo f(x) =
∑o∈K-NN(x)lrdlrd((ox))
|K−NN(x)|
The LOF start searchingKnearest neighbors of all points in the dataset and subsequently calculates local reachi-bility density of the points. This information is used to computelofof all points. Finally, all points are sorted with respect to theirlo f values and topNdata points are declared as outlier points. However, LOF is not computationally efficient method. It needs to compute a large number of distance calculation for findingK nearest neighbors of all data points. To overcome this shortcoming of the LOF, we propose a speeding up approach which is discussed below.
3. TI-LOF:Proposed Speeding up Approach
The proposedTI-LOFis a hybrid approach with a combination of TI-K-Neighborhood-Index and classical LOF methods. The method works as follow. At first TI-K-Neighborhood-Index is applied to the dataset
D
to collectK nearest neighbors of all data points quickly. From this statistics, TI-LOF calculates maximum of distances between a pointxand itsK neighbors. In the last step,lo f of all points are calculated and arranged them in decreasing order. The whole method is depicted in Algorithm 2.Algorithm 2T I−LOF(
D
,K,N)/*
D
is a dataset,Kis the value ofKnearest neighbor andNdesired number of outliers. */ ApplyTI-K-Neighborhood-Index(D
,K)as given in Algorithm 1foreach patternx∈
D
doCalculateMAXK(x)=max{||x−q|| |q∈K−NN(x)} end for
foreach patternx∈
D
doCalculate lrd(x) using Definition 1.
end for
foreach patternx∈
D
doComputelo f(x) end for
Sort all points in decreasing order in a LIST with respect tolo f values. Output topNpoints in the LIST.
4. Performance Evaluations
To evaluateTI-LOF, we implemented it using C language on Intel(R) Core 2 Duo CPU(2.90GHz) Desktop PC with 2 GB RAM. We tested our method with classical LOF method. Detailed results are reported in this section.
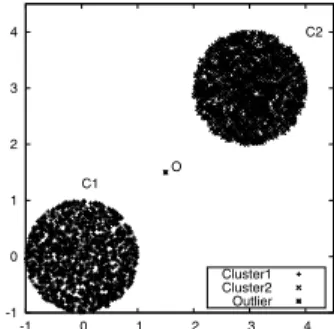
-1 0 1 2 3 4 -1 0 1 2 3 4 O C1 C2 Cluster1 Cluster2 Outlier
Fig. 1. Uniform Dataset.
4.1. Synthetic Dataset
One synthetic dataset calledUniform datasetis designed to evaluate theTI-LOFmethod. This is a two dimen-sional dataset having two circular shaped clusters filled with highly densed points. There is a single outlier (sayO) placed exactly in the middle of the two densed clusters as shown in the Figure 1. We ranTI-LOFmethod along with classical LOF method with Uniform dataset. Obtained results for different values ofKare reported in Table 1. From experimental results, it can be observed thatTI-LOFperforms 6 millions less distance computations compared to the classical LOF method. Our method takes less time (withK=30, 0.57 seconds) than classical LOF method (with K=30,1.45 seconds).
Table 1.Experimental Results with Uniform Dataset
Value of (K) Method Time Number of Distance ( in Sec.) Computation (in Millions)
15 LOF 0.98 9.85 TI-LOF 0.38 2.98 20 LOF 1.14 9.86 TI-LOF 0.43 3.10 25 LOF 1.29 9.86 TI-LOF 0.49 3.21 30 LOF 1.45 9.87 TI-LOF 0.57 3.30 4.2. Real Dataset
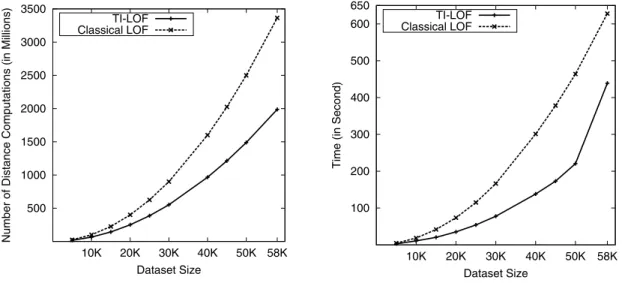
Shuttle Dataset: This dataset has 9 integer valued attributes of 58,000 patterns distributed over 7 classes (after merging training and test sets). Class labels are eliminated from the all patterns. WithK=30, TI-LOF computes more than 138 millions less distance calculations compared to the LOF method (Fig. 2).
Fig. 2 shows the number of distance computed byTI-LOF and LOF as data size varies from 5000 to 58000 for Shuttle dataset withK=30. It may be noted that with the increase of dataset size, number of distance computations are reduced compared to LOF method significantly.
Fig. 3 shows the execution time ofTI-LOFand LOF methods as data size varies from 5000 to 58000 for Shuttle dataset withK=30. It can be observed thatTI-LOFmethod takes less time compared to the LOF method.
5. Conclusion
TI-LOF is a speeding up approach for classical outlier detection method LOF. Metric space property is used to reduce the number of distance computations in LOF method. Experimental results demonstrate that our proposed
500 1000 1500 2000 2500 3000 3500 10K 20K 30K 40K 50K 58K
Number of Distance Computations (in Millions)
Dataset Size TI-LOF
Classical LOF
Fig. 2. Number of Distance Computation varies with size of the dataset for Shuttle Data
100 200 300 400 500 600 650 10K 20K 30K 40K 50K 58K
Time (in Second)
Dataset Size TI-LOF
Classical LOF
Fig. 3. Execution time of LOF andTI-LOFfor Shuttle Data
approach computes significantly less distance calculations compared to LOF method and the TI-LOF is faster than LOF method.
References
Angiulli, Fabrizio & Fabio Fassetti. 2009. “DOLPHIN: An efficient algorithm for mining distance-based outliers in very large datasets.”ACM Trans. Knowl. Discov. Data3:4:1–4:57.
Breunig, Markus M., Hans-Peter Kriegel, Raymond T. Ng & J¨org Sander. 2000. LOF: identifying density-based local outliers. InProceedings of the 2000 ACM SIGMOD international conference on Management of data. SIGMOD ’00 pp. 93–104.
Chandola, Varun, Arindam Banerjee & Vipin Kumar. 2009. “Anomaly detection: A survey.”ACM Comput. Surv.41(3).
Elkan, Charles. 2003. Using the Triangle Inequality to Accelerate k-Means. InProceedings of the Twentieth International Conference on Machine Learning, ICML’03). pp. 147–153.
Knorr, Edwin M. & Raymond T. Ng. 1998. Algorithms for Mining Distance-Based Outliers in Large Datasets. InProceedings of the 24rd Interna-tional Conference on Very Large Data Bases. VLDB ’98 pp. 392–403.
Kryszkiewicz, Marzena & Piotr Lasek. 2010a. A neighborhood-based clustering by means of the triangle inequality. InProceedings of the 11th international conference on Intelligent data engineering and automated learning (IDEAL 2010). pp. 284–291.
Kryszkiewicz, Marzena & Piotr Lasek. 2010b. TI-DBSCAN: Clustering with DBSCAN by Means of the Triangle Inequality. InProceedings of the 7th International Conference on Rough Sets and Current Trends in Computing RSCTC, 2010. pp. 60–69.
Nassar, Samer, J¨org Sander & Corrine Cheng. 2004. Incremental and Effective Data Summarization for Dynamic Hierarchical Clustering. In Proceedings of SIGMOD Conference, SIGMOD’04. pp. 467–478.