Adeline Pelletier
Performance of foreign banks in developing
countries: evidence from sub-Saharan African
banking markets
Article (Accepted version)
(Refereed)
Original citation:
Pelletier, Adeline (2017) Performance of foreign banks in developing countries: evidence from sub-Saharan African banking markets. Journal of Banking and Finance. ISSN 0378-4266 DOI: 10.1016/j.jbankfin.2017.11.014
Reuse of this item is permitted through licensing under the Creative Commons:
© 2017 Elsevier B.V.
CC BY-NC-ND 4.0
This version available at: http://eprints.lse.ac.uk/86368/
Available in LSE Research Online: January 2018
LSE has developed LSE Research Online so that users may access research output of the School. Copyright © and Moral Rights for the papers on this site are retained by the individual authors and/or other copyright owners. You may freely distribute the URL
Accepted Manuscript
Performance of foreign banks in developing countries Evidence from sub-Saharan African banking markets
Adeline Pelletier
PII: S0378-4266(17)30284-4
DOI: 10.1016/j.jbankfin.2017.11.014
Reference: JBF 5259
To appear in: Journal of Banking and Finance Received date: 9 June 2016
Revised date: 4 October 2017 Accepted date: 22 November 2017
Please cite this article as: Adeline Pelletier, Performance of foreign banks in developing countries Evidence from sub-Saharan African banking markets, Journal of Banking and Finance (2017), doi:
10.1016/j.jbankfin.2017.11.014
This is a PDF file of an unedited manuscript that has been accepted for publication. As a service to our customers we are providing this early version of the manuscript. The manuscript will undergo copyediting, typesetting, and review of the resulting proof before it is published in its final form. Please note that during the production process errors may be discovered which could affect the content, and all legal disclaimers that apply to the journal pertain.
ACCEPTED MANUSCRIPT
Performance of foreign banks in developing countries
Evidence from sub-Saharan African banking markets
Adeline Pelletiera,b,∗
aUniversity of London, Goldsmiths College, Institute of Management Studies, 8 Lewisham
Way, London SE14 6NW
bLondon School of Economics and Political Science, Centre for Economic Performance,
Houghton St, London WC2A 2AE, UK.
Abstract
Do foreign banks perform better than domestic banks in host developing economies? Relying on financial statements and survey data I compare the performance of three different categories of foreign banks to the group of domestic banks in sub-Saharan Africa: global banks from developed countries, regional African banks and banks from non-African emerging economies. While emerging-market banks and global banks consistently outperform domestic banks, the difference is not significant for regional African banks. The higher performance of global banks and emerging-market banks is related to higher operational efficiency and lower cost of funding, while there is no strong evidence of segmentation by business segment in the loans market. Regional African banks, which started their foreign expansion more recently, are less able to generate interest income compared to domestic banks. These findings highlight the importance of taking into account foreign banks’ heterogeneity when assessing the impact of financial FDI on the host economy.
JEL classification: F21; F23; G21
Keywords: Foreign direct investment; International banking; Performance
∗Email address: [email protected]. Phone: +442078962802
ACCEPTED MANUSCRIPT
Acknowledgements
I thank Ralph de Haas, Saul Estrin, Daniel Ferreira, Catherine Thomas, Lourdes Sosa, Luis Rayo, Enrico Rossi, seminar participants at the LSE, at the IFABS annual conference in Nottingham (2013) and the EIBA annual conference in Brighton (2012), as well as anonymous reviewers for helpful comments and discussions. Research support was provided by the department of management of the London School of Economics. All errors are my own.
ACCEPTED MANUSCRIPT
1. Introduction
As foreign banks’ presence has increased sharply over the last two decades the question of the performance and financial strength of these banks, as well as the allocation of their loan portfolios, has become particularly relevant, especially in developing countries where capital markets are under-developed and SMEs face high financing constraints. While there is ample literature on the performance of foreign banks the results have been ambiguous, partly due to limited data coverage and the treatment of these banks as a homogeneous group. A recent stream of research (Van Horen, 2007; Claessens and Van Horen, 2012, 2013, 2014; Claessens, 2017) has started to examine the issue of foreign banks’ entry with a more fine-grained approach by looking at the origins of foreign banks operating in developing countries. It has found that the impact of foreign banks on the host economy depends in part on these banks’ home countries and business models, and on the specific characteristics of their host countries. Factors such as geographic and cultural distance, as well as the host country’s level of financial development and strength of regulation, have been shown to be of particular importance for explaining foreign banks’ performance and their impact on the local supply of credit. While these first empirical studies are important, in that they offer glimpses into the locational determinants and performance of foreign banks in developing countries, they do not adequately address the question of the cause of the performance differences observed between foreign banks from developing countries and those from developed countries. Neither do they examine the related questions of the business strategies, in terms of lending and funding, of these banks when they enter foreign markets. This present research aims to do so by adopting a regional lens.
More specifically, this paper aims to determine the factors that drive the differences in performance between different groups of foreign banks and domestic banks, focusing on sub-Saharan Africa, the developing region with the largest proportion of foreign-owned banks in terms of numbers1.
Little is known about banking in sub-Saharan Africa despite the fact that the fi-nancial sector is an important recipient of FDI in the region, representing 22% of total cross-border M&A purchases in the region in 2013 (UNCTAD, 2015:33) and 7% of total greenfield FDI projects in 2011 (UNCTAD, 2012:40). This has been in part driven by intra-Africa FDI, with financial services accounting for about 50% of intra-Africa green-field investment projects between 2003 and the start of 2014, 38% of these projects being in retail banking and 5% in insurance (UNCTAD, 2015:38). While global banks are still
1In 2009 52% of banks in sub-Saharan Africa were foreign banks (from 31% in 1995), while this percentage was only 24% in East Asia and the Pacific (from 18% in 1995), 13% in South Asia (from 7% in 1995), and 42% in Latin America and the Caribbean (from 28% in 1995). The proportion of foreign-owned banks was also high in Eastern Europe and Central Asia, at 47% in 2009, against 15% in 1995 (Claessens and Van Horen, 2013, 2014).
ACCEPTED MANUSCRIPT
very important players in the region the emergence of regional African banks, with a clear pan-African ambition, has modified the banking landscape. Some regional African banks enjoy a significant presence in a large number of countries, such as Ecobank Transnational (from Togo), which has operations in thirty countries in West Africa, Central Africa and East Africa. The larger banking groups in South Africa, such as Standard Bank, have also started to invest outside the region, setting up branches or subsidiaries in developed countries and in other emerging countries. As a result, several types of foreign banks now co-exist with domestic banks in sub-Saharan African markets: foreign affiliates of global multinational banks from developed countries (France and the U.K. in particular), foreign affiliates of emerging-market banks from Asia or the Middle East, and foreign affiliates of regional African banks. To compare the financial performance of these different cate-gories of banks I use panel data from the Bureau van Dijk’s BankScope database to obtain financial information on banks located in sub-Saharan Africa over the 2003-2012 period. I then exploit data from a novel bank survey of 77 banks in 14 sub-Saharan African countries conducted in 2013-2014 to triangulate information and further explain some of the findings obtained from the financial statements. I find that the foreign affiliates of global banks and emerging-market banks perform significantly better than domestic banks in sub-Saharan Africa, with a return on equity (using profit before tax) on average 7 basis-points higher over the study period for global banks and 28 basis-points higher for emerging-market banks, while the difference in performance is not significant for regional African banks.
Overall, this research suggests that the higher performance of foreign global banks and emerging-market banks relative to domestic banks is more driven by different access to funding (liability side of the balance sheet) and operating efficiencies than by different abilities to generate interest income (asset side). However, with regard to the more recently expanding regional African banks, the results suggest that they have a lower ability than domestic banks to generate interest income. This may be related to the fact that they still need to establish themselves and gain new customers. In contrast, the two other groups of foreign banks can benefit from better known brands (global banks such as Barclays or Standard Chartered) or an older presence on the continent with significant experience in financing specific population groups (Indian banks for instance).
In addition, the findings from the survey suggest that global banks receive more operational support from their headquarters in the domains of IT, risk management techniques and lending technology compared to the two other groups of foreign banks, as their operations tend to be more centralised at the global or regional headquarters’ level. This higher level of operational support may partly explain the lower cost-to-income ratios observed when compared to regional African banks. To the extent that the heterogeneity among foreign banks with regard to business models, organizational structure and lending techniques translates into differences in performance and asset-liability management, this
ACCEPTED MANUSCRIPT
needs to be taken into account by policymakers when formulating banking regulations and FDI policies.
This paper offers three contributions to the international banking literature.
First, it offers a comparison of the performance and loan allocations of different cate-gories of foreign banks. Empirical research on the banking sector in developing countries has mainly focused on the impact of foreign banks from developed countries on SME financing in host developing countries (Clarke, Cull, Martinez Peria and Sanchez, 2005; Detragiache, Tressel and Gupta, 2008; Giannetti and Ongena, 2009). Very few studies have compared the performance of different types of foreign banks as these have tradition-ally been examined as a homogeneous group without distinguishing between developing and developed MNEs. However, this comparison matters as the strategies and perfor-mance of foreign banks have implications for the development of host banking markets, and both elements may differ between developing and developed foreign banks. Recently, economists such as Van Horen (2007) and Claessens and Van Horen (2012, 2014) have used a new, comprehensive database on bank ownership across the world to examine the issue of foreign banks’ entry in a more refined manner by looking at the origins of foreign banks operating in developing countries. For instance, Van Horen (2007) has found that banks from developing countries are more likely to invest in other developing countries with weak institutions, and that developing countries’ foreign banks are less profitable than foreign banks from high-income countries in host developing countries, based on measures of profit before tax divided by total assets over the 2000-2004 period. The findings of this present work are also similar to those of Claessens and van Horen (2012), who use data from a large number of developing countries over the 1999-2006 period and find that foreign banks tend to perform better when they are from a high-income country, when they are larger and when they have a bigger market share. This work complements the research of Claessens and van Horen (2012) by focusing on a specific developing re-gion, sub-Saharan Africa, and providing a detailed examination of the drivers of bank performance, including detailed loan portfolio data and information on organizational structure and headquarters-subsidiaries relationships. In addition, by separating foreign banks from developing countries into two categories, those that are regional and those that come from developing or emerging countries outside the host region, this research uncovers a high heterogeneity, in terms of both performance and business model, between these two groups.
Second, this research presents new survey data on banks’ practices and organization, which is commonly very scarce, in particular in Africa. For instance, Beck, Demirg¨ u¸c-Kunt and Mart´ınez Per´ıa (2011) conducted a World Bank survey on banks’ SME lending practices in 2007 which covered 91 banks from 45 countries around the world but included only 15 sub-Saharan African banks from 7 countries. Focusing on bank lending to SMEs they find that foreign banks rely more on hard verifiable information for lending decisions,
ACCEPTED MANUSCRIPT
and that they are more likely to use real estate as collateral. At the same time, the authors do not find that foreign banks lend less to SMEs than private domestic banks. Another survey of SME financing in four East African countries (Kenya, Tanzania, Uganda and Zambia), conducted by the African Development Bank in 2012 (see Calice, Chando and Sekioua, 2012), is based on interviews at 16 different banks. The authors find that in East Africa banks consider the SME segment to be profitable but they also highlight a number of obstacles to SME lending, including business regulations and the difficulty of standardizing risk models, products and procedures in this segment.
The BEPS banking survey2, jointly undertaken by the EBRD and Tilburg
Univer-sity, resulted in a sample of 611 banks in 32 transition countries (including three North African countries) at two points in time: 2007 and 2010. Several papers have relied on the BEPS survey to examine various aspects of lending. For instance, Haselmann and Wachtel (2007), in the context of transition countries, find that although banks differ in their levels of risk exposure, with foreign, EU and large banks showing a lower probability of default compared to their competitors, overall, no group of banks is subject to excessive risk taking. In a following work Haselmann and Wachtel (2010) find that in transition economies the banks’ loan portfolio composition depends on the legal environment. Banks lend relatively more to SMEs and lend more mortgages in a well-functioning environment, while in a bad legal environment the proportion of lending to large enterprises, govern-ment and other household lending is higher. Finally, De Haas, Ferreira and Taci (2010) also find that the regulatory environment, in particular legal creditor protection, is an important determinant of the composition of banks’ loan portfolios. They also find that bank factors such as ownership and size matter. Foreign banks are strongly involved in mortgage lending, demonstrating their willingness and ability to lend to local customers. On the corporate side size matters, with small banks lending relatively more to SMEs than large banks, which focus more on large firms. Overall, these different surveys, con-ducted in very different environments, seem to suggest that foreign banks are willing and able to lend to the local SME segment but that the strength of the legal environment matters. This new dataset provides richer information on banks in Africa, not only on lending techniques but also on the interaction between headquarters and their African subsidiaries, shedding light on the mechanisms behind the observed performance of banks. Third, this research provides a first analysis of the performance of foreign multinational banks in sub-Saharan Africa. So far the literature on banking in sub-Saharan Africa has been very limited, despite the rapid evolution and recent dynamism of the banking sector in the region. Studies have often focused on a specific country, such as Uganda (Beck and Hesse, 2009), Kenya (Beck and Fuchs, 2004) or Nigeria (Beck, Cull and Jerome,
2http://www.ebrd.com/what-we-do/economics/data/banking-environment-and-performance-survey.
ACCEPTED MANUSCRIPT
2005), or on the demand side of the banking market in sub-Saharan Africa, especially through the World Bank’s Enterprise Surveys. This research offers a regional perspec-tive on the performance of banks which have a presence across the continent. Finally, given the potential impact of foreign banks on host countries’ stability via the internal capital markets that these multinational banks operate (see the literature on internal bank funding, for instance, Cetorelli and Goldberg (2012), De Haas and Van Lelyveld (2010), Popov and Udell (2012)), understanding how the funding model (liabilities) and the lending portfolio (assets) differ across different groups of banks is key to enhancing policy recommendations related to foreign bank entry.
The rest of the paper proceeds as follows. Section 2 presents the related literature and theoretical predictions. Section 3 describes the data. Section 4 compares the prof-itability and cost-efficiency of the different categories of banks. In Section 5 I further examine the channels of bank performance by decomposing the profit measure into its accounting components. Section 6 investigates an alternative explanation for performance difference, namely whether banks’ performance is driven by composition effects related to segmentation in the loan market. Finally, Section 7 discusses the results and concludes.
2. Related literature and theoretical predictions
In this section the literature is briefly reviewed to examine the relative advantages of being a foreign bank. Four different types of factors that can affect foreign banks’ perfor-mance are traditionally highlighted in the literature: host country characteristics, home country characteristics, distance and bank characteristics (see, for instance, Claessens and van Horen, 2012). I derive hypotheses below regarding how each factor affects the differ-ent categories of banks (domestic banks and foreign affiliates of global banks, emerging-market banks and African banks).
2.1. Host country factors
Starting with host country characteristics, foreign banks are found to be especially profitable in developing countries (Claessens and van Horen, 2012), and more generally in countries where credit information is limited and contract enforcement is low. In those countries where regulation is weak and the banking sector is inefficient foreign banks might be better able to gain market share and be profitable. However, research has shown that it is foreign banks from high-income countries that tend to perform better, suggesting that access to capital and technological and lending know-how matters (Claessens, 2017).
Hypothesis 1 The foreign affiliates of global banks from developed countries perform better than domestic banks in sub-Saharan Africa.
ACCEPTED MANUSCRIPT
2.2. Home country factors
The overall development of the home market matters for bank performance. Indeed, in developed countries with well-developed regulatory systems and an educated labour force, banks will be better able to develop their risk management techniques, and adopt new financial instruments and technologies (see Berger et al., 2000). This will lead them to undertake high-return projects. The degree of competition also matters. Banks from countries where banking markets are competitive are more likely to be more efficient and more innovative (Aghion and Howitt, 1998). As such they might be better able to be competitive abroad. Given that the banking markets in the home countries of global banks tend to be competitive and sophisticated, we can expect them to be more operationally efficient than foreign banks from African countries.
Hypothesis 2 The foreign affiliates of global banks exhibit higher operational efficiency than the foreign affiliates of African banks in sub-Saharan Africa.
2.3. Distance factor
Distance between home and host country also matters. In a relationship-based ac-tivity such as banking knowledge of the local environment is crucial in order to screen and effectively monitor borrowers (Freixas and Rochet, 1997; Berger, Klapper and Udell, 2001), especially, as is the case for Africa, in low-transparency economies with a large informal sector and limited or non-existent formal documentation (Beck, Maimbo, Faye and Triki, 2011). As a consequence, in this sector the advantages conferred by local ex-perience may be particularly salient. Indeed, both theoretical (Hauswald and Marquez, 2006) and empirical (Berger and DeYoung, 2001, 2006; Mian, 2006; Claessens and Van Horen, 2014) studies have suggested that foreign banks that are closer to the host coun-try are better able to process soft information and therefore to provide loans to local firms. For instance, Stein (2002) theoretically shows that greater distance decreases bank managers’ incentives to acquire “soft” information on projects as it cannot be credibly transmitted. Closeness eases the collection of soft information and its internal transmis-sion. This would suggest that domestic banks would be better able to work with soft information, and would be expected to perform better than foreign banks in segments where soft information and local knowledge are key, such as SME lending.
In addition, this would suggest that the foreign affiliates of regional African banks may also have an important information advantage when operating in their home region compared to global banks from developed countries which may struggle to assess and monitor relatively opaque businesses. This is reflected in the “institutional voids’ ad-vantage” hypothesis (Khanna and Palepu, 2006, 2010), according to which MNEs from developing countries undertaking South-South FDI3 have an adaptation advantage over
ACCEPTED MANUSCRIPT
MNEs from developed countries undertaking North-South FDI4. This advantage comes from their ability to deal with difficult institutional environments, characterized by “in-stitutional voids”. These voids are defined by Khanna and Palepu (2006) as the absence of specialized intermediaries, regulatory systems and contract-enforcing mechanisms, and the ability to deal with them is developed in their home (emerging or developing) coun-try. In addition to an institutional voids advantage related to specific managerial abilities MNEs from developing countries operating in other developing countries could also ben-efit from an advantage related to the similarity of the demand (determined by per capita income levels) between their home and host countries5. This should make them better
able to offer products that are well-adapted to the characteristics of the demand in their host countries.6 Due to their closeness to their host markets the sectoral allocation of
loans and the lending technology used by the foreign affiliates of African banks should be similar to those of domestic banks in host sub-Saharan African countries. This means that they should operate in ways similar to local banks, which leads to the following hypothesis:
Hypothesis 3 The foreign affiliates of African banks exhibit levels of oper-ational efficiency similar to those of domestic banks in sub-Saharan Africa.
In addition, banks from emerging markets should occupy an intermediary position, closer to their host markets (culturally and institutionally) than global banks but coming from a more developed and competitive banking environment than regional African banks, which should have a positive impact on their operational efficiency. This leads to the following hypothesis:
Hypothesis 4 The foreign affiliates of emerging-market banks exhibit higher levels of operational efficiency than domestic banks in sub-Saharan Africa.
2.4. Bank factors
Size is an important factor in explaining bank performance, with large banks benefit-ing from economies of scale and operatbenefit-ing in different market segments from small banks,
4FDI from a developed country to an emerging or developing country.
5This is similar to the Linder hypothesis (Linder, 1961) in international trade according to which countries will trade intensively with others that share similar demand or consumption patterns. Recently, Fajgelbaum, Grossman and Helpman (2015) have shown both empirically and theoretically that FDI is more likely to occur between countries with similar per capita income levels.
6Conversely, global banks may have to “adapt down” their lending technology, which can result in a cost (“cost of adapting the technology to the local condition”, Dixit, 2011). In addition, their managers have to adapt to the host country’s institutional environment, and incur the costs of “coping with the bad governance” (Dixit, 2011). However, through experience in the host country, captured by the number of years since incorporation, affiliates of global banks can progressively overcome these disadvantages as the bank management learns from the local context and adapts its strategy.
ACCEPTED MANUSCRIPT
which can lead to differences in performance (Berger and Humphrey, 1997). The foreign affiliates of global banks may benefit from scale economies in operating costs through affiliation to a large group, in particular via the sharing of IT systems for lending and risk management. In addition, they can benefit from financial support from their group via internal capital markets (Stein, 1997; De Haas and Van Lelyveld, 2010; Cetorelli and Goldberg, 2012). This might give them a funding advantage over domestic banks and other foreign banks belonging to smaller groups, in particular the recently expanding African regional banks. This funding advantage should result in lower interest expenses. Furthermore, their brand name might help them attract customers’ deposits, especially from large corporates operating in sub-Saharan Africa, which could also have a positive impact on their cost of funding.
Hypothesis 5a The foreign affiliates of global banks exhibit lower interest ex-penses than domestic banks in sub-Saharan Africa, due to their affiliation to a large group.
In addition, emerging-markets banks also belong to large banking groups operating across the world. As such, they may also benefit from group financial support and positive brand image leading to a lower cost of funding. This leads to the following hypothesis:
Hypothesis 5b The foreign affiliates of emerging-market banks exhibit lower in-terest expenses than domestic banks in sub-Saharan Africa, due to their affiliation to a large group.
The different factors likely to affect the performance of foreign banks are summarized in Table A.1, Appendix A. The hypotheses are empirically tested in the following sections.
3. Data
3.1. Data
I use two different sources of data. First I use panel data from the BankScope database to obtain financial and ownership information on foreign and domestic banks operating in sub-Saharan Africa. Second, I use novel data from a bank survey to get insights into the financial management and organization of banks in order to triangulate information and explain some of the results obtained from the banks’ financial statements.
3.1.1. BankScope data
The sample consists of annual financial data for the 10-year period 2003-2012 for all the banks active at some point during this period, included in BankScope, in 47 sub-Saharan countries (all African countries excluding Morocco, Algeria, Tunisia, Libya, Egypt and Sudan). The sample contains 657 banks in total, and includes banks that became inactive during the period. In 2012 76% of the banks in the sample were active, 16% were dissolved
ACCEPTED MANUSCRIPT
(of which 10% were due to mergers or takeovers), 0.15% were bankrupt, 3% were in liquidation and, for 5% of them, the situation was unknown. The banks included in the sample are commercial banks (97%), cooperative banks (1%) and savings banks (2%). To reduce the heterogeneity of the sample, all investment banks, Islamic banks, micro-finance institutions, private banks, real estate and mortgage banks, and development banks were excluded, given that they operate in different market segments from those of traditional commercial banks. In addition to the BankScope data I hand collected data on the sectoral allocation of banks’ loan portfolios directly from the annual reports of a subsample of 106 banks which publish this data.
3.1.2. Survey data, sample size and scope
I conducted a bank survey using a questionnaire combining both closed-ended and open-ended questions. The questionnaire is presented in Appendix B.
In total, I obtained a sample of 77 banks from 14 sub-Saharan African countries. The questionnaire was completed through both interviews and self-administration by respon-dents. I conducted fieldwork in Kenya (October-November 2013), Tanzania (November-December 2013) and Ghana (March-April 2014) to collect data through interviews with bank managers of domestic and foreign commercial banks. I gathered data on 62 dif-ferent banks in total during these three pieces of fieldwork, out of a population of 97 banks in total in the three countries, thus obtaining an average response rate of 64%. 27 banks were located in Kenya, 19 in Tanzania and 16 in Ghana. In addition, I collected data from Uganda (4 banks) and Zambia (2 banks) by emailing the questionnaire to the banks’ heads of credit. I also contacted the global headquarters of foreign banks with affiliates in Africa to ask for their help with distributing the questionnaire to their African subsidiaries. Through this channel I obtained 9 additional questionnaires from foreign affiliates of global banks in Mali, Ivory Coast, Congo, Burkina Faso, Cameroon, Senegal, Equatorial Guinea, Madagascar and Chad.
The size of the sample is admittedly small. However, this sample size needs to be put into perspective. First, banking markets in developing countries, and especially in Africa, tend to be relatively small in terms of number of banks operating in a given market7
compared to more developed countries. As such, the target population itself is relatively limited. Second, survey data on banking focusing on banks’ practices and organization is commonly very scarce, with limited sample sizes. For instance, Beck, Demirg¨u¸c-Kunt and Mart´ınez Per´ıa (2008) conducted a World Bank survey on banks’ SME lending practices in 2008 which covered 91 banks from 45 countries around the world but included only
7It is rare for more than 30 banks to operate in a given sub-Saharan country; in addition, according to Bureau Van Dijk’s BankScope database, in 2012 the average number of foreign banks in sub-Saharan African countries was 7, ranging from 21 (Tanzania) to 1 (Comoros).
ACCEPTED MANUSCRIPT
15 sub-Saharan African banks from 7 countries8. Another more recent survey of SME financing in four East African countries9, conducted by the African Development Bank
in 2012 (see Calice, Chando and Sekioua, 2012), was based on interviews at 16 different banks. Apart from the small target population the small size of these samples is also related to sectoral factors, in particular concerns about confidentiality in the banking industry. The respondents were mainly heads of credit (retail, SMEs or corporates) (35%), followed by heads of credit risk or credit administration (26%) and CEOs (14%). On average the respondents had been in the bank for 7.5 years at the time of the survey, with a minimum of 6 months and a maximum of 42 years.
Non-response bias analysis. I conduct an analysis of the non-response rate to examine the possibility of sampling bias. To do so I compare the means of several key financial indicators of participant and non-participant banks (both domestic and foreign) surveyed in Kenya, Ghana and Tanzania. I focus on banks located in these three countries, which constitutes 81% of the sample given that the number of participant banks in the 11 other countries is very small (between one and four respondent banks) and therefore not representative, while the survey covers 66% of the commercial banks in Kenya, 59% in Tanzania and 67% in Ghana. The results are reported in Table 1. They indicate that although participant banks are on average larger by asset, with a higher net income and higher total capital ratio, the differences are not significant at the 10% level. These results give confidence that the data does not suffer from major sampling biases due to banks’ self-selection, at least concerning the bank population in the countries in which fieldwork has been conducted. Of course, other biases related to the selection of countries for fieldwork cannot be excluded; however, efforts have been made to obtain data on different regions of Africa, and the sample includes all the largest banking groups present in Africa, originating from France, the U.K., the U.S.and India, as well as from North Africa and sub-Saharan Africa.
— Table 1 insert here —
3.2. Variables of interest: bank ownership dummies
I define three different categories of foreign banks operating in sub-Saharan Africa based on the home country’s level of development and geographical distance to the host region. Global banks (“Global MNB”) are banks founded in a developed country. The “Emerging MNB” category includes banks originating from an emerging or developing country10outside the region. Regional African banks (“African MNB”) are banks founded
8Kenya, Malawi, Sierra Leone, South Africa, Swaziland, Zambia and Zimbabwe. 9Kenya, Tanzania, Uganda and Zambia.
10In the category “developed countries” I include countries that are classified by the IMF as “high income”, defined as countries with a GNI/capita at or above $12,615 (2014). For emerging countries I include both upper middle and lower middle income countries, with a GNI/capita between $1,036 and $12,615.
ACCEPTED MANUSCRIPT
in Africa (including North Africa and South Africa).
Banks’ ownership is determined as follows: I use the Global Ultimate Owner indicator from the BankScope database. A company is a Global Ultimate Owner (GUO) if it con-trols at least 50.01% of the entity and has no identified shareholders or if its shareholder’s percentages are not known. When ownership information was missing in BankScope I updated it by looking at banks’ websites, using the same definition. For banks which have a dispersed ownership and for which there is no ultimate owner controlling at least 50.01% of the company I determine the country of origin of the bank by aggregating the shares of the owners by country of origin, and I attribute bank ownership based on the nationality of the owners with the highest total percentage of shares11. I also take into
account mergers and acquisitions which have taken place during the sample period by tracking each bank’s Bureau van Dijk ID number (BVD ID) in the Zephyr database of Bureau van Dijk, which records M&As. In addition, I checked all mergers and acquisi-tions that occurred during the sample period to ensure that only the merged entity or the acquiring bank remained in the sample after the take-over. The ownership indica-tor changes over the sample period for 8% of the banks in the sample. However, the composition of the sample varies over time due to the entry and exit of banks from the four different groups. While in 2003 51% of the banks were domestic banks, 21% were affiliates of Global MNB, 5% were affiliates of Emerging MNB and 23% were affiliates of African MNB, in 2012 these percentages were, respectively, 40%, 19%, 6% and 35%. As such, in the sample the percentage of foreign banks (in terms of numbers) increase from 49% to 59% over the 2003-12 period (see Table A.2 in the Appendix).
3.2.1. Characteristics of banks in the BankScope sample
In 2012, 50% of the banks fell into the categoryDomestic banks. Among foreign banks 16% were in the categoryGlobal MNB, 29% in the categoryAfrican MNB and 5% in the category Emerging MNB. Among global multinational banks 34% were from the U.K., 25% from France and 16% from Portugal. Concerning emerging multinational banks, 36% were from India and 27% were from Malaysia, while the rest are from the Gulf Countries,
11Note that I differ slightly from Claessens and Van Horen (2013, 2014), who first attributed foreign ownership to banks for which at least 50% of the shares were held by foreigners, and then summed the percentages of shares held by foreigners by country of residence, with the country with the highest percentage of shares considered the source country. For instance, if a bank is held at 60% by 3 foreigners and the highest percentage of shares owned by one of the 3 foreigners is 39%, and the remaining shares are domestically-owned, then Claessens and Van Horen’s (2013, 2014) attribute the ownership of the bank to this foreigner, while I would consider that the bank is a domestic bank. This methodology was chosen because for many banks with dispersed ownership in sub-Saharan Africa it was much more difficult to accurately identify all the minority owners, even for large ones, especially when they were individuals, than to identify the nationality of the largest owner through cross-checking online sources. However, this difference in methodology only affects 5 banks in the sample, which were classified as domestic whereas they would have been classified as foreign following Claessens and Van Horen (2013, 2014) methodology. Given that this study focuses on foreign banks this classification difference is unlikely to affect results.
ACCEPTED MANUSCRIPT
Russia, Pakistan and Taiwan. Most of the foreign affiliates of regional African banks belong to Nigerian banking groups (21%), followed by Togolese banks (17%) (essentially subsidiaries of the large pan-African group Ecobank), Moroccan banks (16%) and South African banks (15%).
3.2.2. Characteristics of banks in the survey sample
Out of the 77 banks surveyed, 36 are domestic banks, 17 are affiliates of African MNB, 19 are affiliates of Global MNB and 5 are affiliates of emerging-market MNB. Concerning the foreign affiliates, 38 were organized as subsidiaries and only 3 as branches. In terms of entry mode, foreign banks tend to favour greenfield entry: 64% of African MNB, 63% of Global MNB and 75% of Emerging MNB entered these markets through a greenfield operation. The banks were 27 years old on average at the time of the survey in 2014, the average incorporation date being 1987, but important variations exist between banks depending on the country of origin of the parent bank. The oldest group is constituted by the foreign affiliates of the Global MNB (39 years old on average), followed by Emerging MNB (37 years old) and domestic banks (24 years old). The foreign affiliates of regional African MNB are the last entrants (8 years old), which is consistent with the fact that the expansion of regional African MNB is a relatively recent phenomenon. In terms of size as measured by the number of employees domestic banks are the largest (1022 employees on average), followed by Global MNB (650 employees), Emerging MNB (243 employees) and African MNB (233 employees).
The following section empirically examines the relationship between banks’ ownership and their financial performance in sub-Saharan Africa.
4. Banks’ ownership and financial performance
4.1. Econometric specification
I use an OLS regression model to examine the relation between banks’ country of origin and several indicators of financial performance. The baseline equation is the following:
yitc =β1Global MNBit+β2African MNBit+β3Emerging MNBit
+ρXit+δZtc+αt+γc+cit (1)
yc
itis the dependent variable, an indicator of financial performance. Xitrepresents a vector
of time-varying bank-level controls andZc
t a vector of time-varying host country controls.
c
it is an error term. I relax the assumption of identical and independent distribution
of the errors and I cluster the standard errors at the bank (affiliate) level to allow for possible correlations between residuals of a bank across time (Petersen, 2009). Year fixed effects αt are introduced to take into account aggregate (regional) macroeconomic
ACCEPTED MANUSCRIPT
omitted variables that are time invariant. In alternative specifications I also control for heterogeneity in the cross-section with year-host country fixed effects in order to compare banks’ performance within year-host countries. I do not include banks’ fixed effects given that for 92% of the banks in this sample the ownership dummy variables do not change over the period studied, leaving too little variation in the data12. I control for many firm,
time and host country factors but the possibility of omitted variable bias, related to the omission of variables affecting both performance and ownership, remains. The objective of this research is thus to find out whether there are significant and robust correlations between the bank ownership dummies and the indicator of financial performance but it does not attempt to prove causality. The possibility of reverse causality (performance affecting ownership) is not excluded, although it is relatively low, as this would primarily be driven by acquisitions of a lower-performing group of banks by another group of banks but, as mentioned above, changes in ownership only concern less than 10% of the banks in the sample. In addition, while it may be that performance at timet affects ownership at time t+ 1, it is less likely that it affects ownership at time t, as specified in equation (1).
Dependent variables (yc
it): Measures of financial performance
I use two performance measures. First I employ the return on equity using income before tax (ROE). I do not use the traditional return on equity based on net income to avoid accounting differences being driven by different tax regulations. In addition, I do not use market to book value as a measure of financial performance, despite a long tradition in the literature on bank performance of using this measure, given that only 57 banks in the sample are listed. Second I use the cost-to-income ratio, calculated as Overheads / (net Interest Revenue + Other Operating Income), which is traditionally used in banking to measure operational efficiency. To mitigate the problem of outliers the dependent variables are Winsorized at 1%. This data comes from the BankScope database.
Bank ownership dummies
I include the dummies African MNB, Emerging MNB and Global MNB and exclude the dummydomestic banks; hence the interpretation of the results for the three ownership categories is relative to domestic banks, the benchmark.
Control variables
Bank controls (Xit). I control for the relevant country experience of the bank using the
number of foreign subsidiaries of the parent company (the “General Ultimate Owner”) in sub-Saharan Africa in the year of entry. I also include the year of entry and two dummies
12While the ownership variable changes for only 8% of the banks over the period the composition of the sample varies over time due to the entry and exit of banks from the four different groups. See Table A.1 in Appendix A.
ACCEPTED MANUSCRIPT
indicating the listed status and government ownership status of the bank, which have been found to be related to performance (La Porta, Lopez-de-Silanes and Shleifer, 2001; Micco, Panizza and Yanez, 2007). The nature of the ownership variables is restrictive concerning the inclusion of other firm controls. Indeed, the ownership indicator does not only represent banks’ category of ownership but is also a broader proxy for banks’ capabilities, and operational and management practices, which are likely to be outcomes of banks’ ownership13. However, for robustness I add a series of balance sheet variables
(lagged) to ensure that the results are not driven by omitted bank balance sheet data. I add the total assets of the bank (in log, lagged) as a proxy for bank size, the market share (lagged), the solvency ratio (lagged), measured as the ratio of equity to assets to capture financial risk, and the loan to deposit ratio (lagged), to control for the bank’s liquidity position. This data is provided by BankScope.
Host country controls (Zc
t). I add a number of host country variables known to
influence banks’ performance (Van Horen, 2007; Claessens and Van Horen, 2014). I include GDP per capita in U.S. dollars obtained from the IMF World Economic Outlook, which proxies the level (and sophistication) of the demand in the host market. I also control for banking regulations, which have been shown to influence bank performance and affect financial stability (Barth, Caprio and Levine, 2004; Laeven and Levine, 2009). More specifically, I include indicators of entry barriers in the banking sector for foreign banks (prohibition of entry via joint venture and via branch), which are obtained from the World Bank’s Bank Regulation and Supervision database (2012). Regulation indicators, the minimum capital adequacy ratio and the minimum capital requirement, are obtained directly from central banks’ websites. In addition, I introduce an indicator of market concentration, the Herfindahl-Hirschman Index, or HHI14, which I lag by one year to
address the potential reverse causality between concentration and profits15. Finally, I
introduce three regional dummies: East Africa, West Africa and Central Africa (the omitted dummy being Southern Africa), which capture regional differences in terms of culture, institutions and level of development.
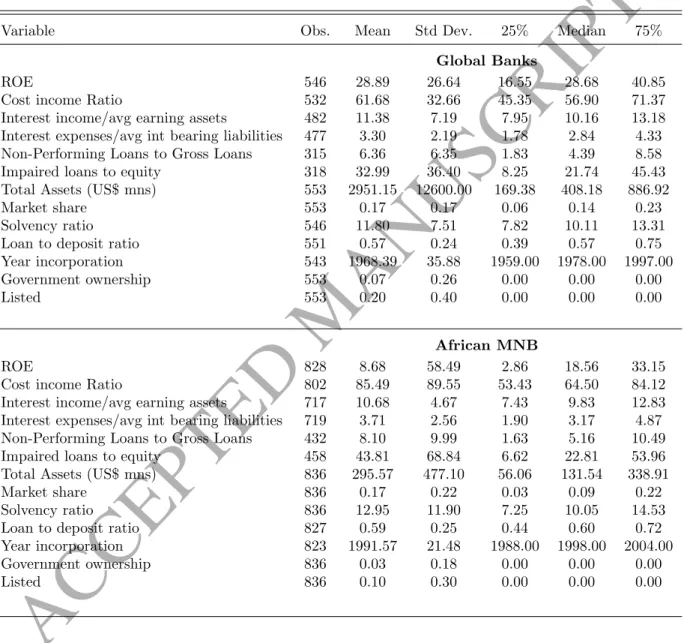
Summary statistics for banks’ financial variables are presented in Table A.3 in Ap-pendix A. Global banks are the largest in terms of assets (average assets of US$2.95 billion over 2003-2012), followed by domestic banks (US$983 million excluding South African domestic banks, US$2.32 billion including them) and African MNB (US$296 million),
13The category of ownership might influence bank practices such as asset-liability management, risk management, and bank variables such as bank size.
14According to the Structure Conduct Paradigm (Bain, 1956), banks operating in more concentrated markets are able to set higher loan rates as a result of non-competitive behaviour or collusion: higher market concentration thus generates more market power and higher bank profits.
15The idea is the following: high profit margins at timet = 0 allow banks to build barriers to entry, which determines concentration at t = 1. However, profits att = 0 do not influence concentration at t=−1.
ACCEPTED MANUSCRIPT
while Emerging MNB record the lowest amount of total assets (US$267 million). Most of the foreign banks have expanded throughout Saharan Africa in the form of sub-sidiaries. Only 7 banks in the sample are operating under a branch form. As Beck et al. (2011) point out, setting up a subsidiary implies higher cost than a branch but it is also easier for the supervisor to oversee as a subsidiary is organized and regulated according to the laws of the host country (see also Casu, Girardone and Molyneux, 2006). As such, according to the World Bank’s Bank Regulation and Supervision 2012 database, a third of the host African countries in the sample prohibited entry via branches in 2008. While this might explain the prevalence of subsidiaries as an organizational form it is also im-portant to note that branches are largely under-reported in BankScope as they do not publish separate annual reports.
4.2. Empirical results on banks’ performance
Given that the panel is largely unbalanced I look at three different samples. The first one includes all active banks and banks which became inactive at some point during the study period, as reported in BankScope. The second one only includes active banks, thus excluding banks that have exited the market. The third one is a balanced panel of banks that are active and have no missing data for book assets for the five-year period 2007-2011.
4.2.1. Banks’ Profitability
I use the Return on Equity as the dependent variable using income before tax (ROE). Table 2 reports the results on the determinants of banks’ performance in sub-Saharan Africa for the three different samples.
— Table 2 insert here —
I examine first the sample containing both currently active and inactive banks. In model 1 the coefficient on the Global MNB dummy is positive and significant at the 1 percent level, indicating that Global MNB have significantly higher ROE than domestic banks. While in model 1 I use several host country controls capturing the level of de-velopment of the country (GDP per capita), the degree of market competition (lagged HHI index), indicators of banking regulation and African geographic area dummies, in model 2 I apply host country fixed effects. I add further bank controls reflecting the financial strength of the banks as well as their experience in the region. The signifi-cant increase in the R-squared between the two models suggests that there are indeed significant country effects and bank effects affecting the performance of banks that are not totally captured by the control variables in model 1. In model 3 I include year-host country fixed effects instead of separate year and host country fixed effects, which would capture any cross-section heterogeneity at the year-host country level. As such, instead of controlling for regional, sub-Saharan, macro-economic shocks, as in model 2, model 3
ACCEPTED MANUSCRIPT
controls for temporal variations in macro-economic conditions at the country level. The R-squared of model 3 compared to model 2 increases slightly; the parameter estimates of the ownership dummies also change but marginally. Overall, being a Global MNB is associated with an ROE between 7 percentage points to 9 percentage points higher on average than that of a domestic bank, depending on whether bank controls, host country dummies or year#host country dummies are included.
Concerning the other groups of banks, we note that the coefficient on African MNB is either negative or positive but never significant in the three models considered. Finally, the difference between Emerging MNB and domestic banks in terms of ROE is positive and significant once further controls are included (models (2) and (3)), with a ROE being on average 10 percentage points higher. Turning to the second panel consisting exclusively of active banks (“survivor banks”), the results are qualitatively similar, with a ROE for Global MNB being on average 7 percentage points higher and the ROE for Emerging MNB being on average 10 percentage points higher than that of domestic banks. However, the difference between African MNB and domestic banks is not significant and the size of the coefficient is close to 0.
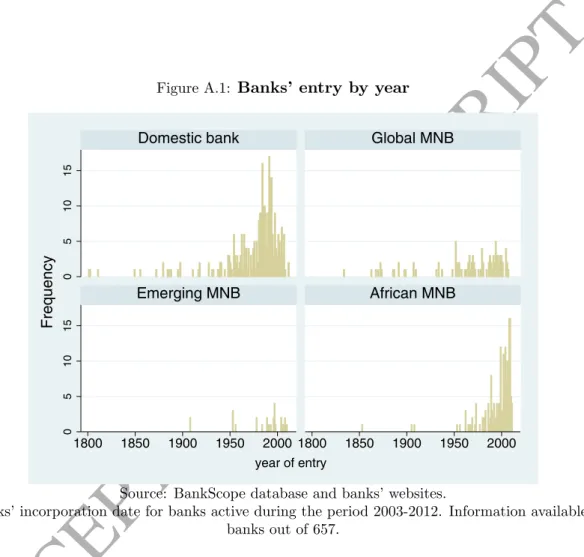
In the 5-year balanced panel (2007-2011), which controls for time of both entry and exit of banks, the coefficients remain similar in magnitude to those in the previous speci-fications but the coefficients on the Global MNB dummy lose significance. This might be related to the higher exit rate of domestic banks and their later entry (1982 on average as year of incorporation for domestic banks against 1972 for Global MNB, see Figure A.1 in Appendix A). Once this is controlled for the difference in performance between both groups of banks disappear. In terms of controls we note that both total assets and market share are positively related to performance with a significant coefficient, which is in line with expectations. The coefficient on the solvency ratio has a negative sign and is significant at the 5% level when host country and year fixed effects are included but the significance drops to only 10% when year#host country fixed effects are included. This negative relationship between solvency ratio and performance might be related to the fact that African banking systems, although lacking in depth compared to other regions in the world, tend to be excessively liquid because African banks lend little (Honohan and Beck 2007; Andrianova et al., 2015). The other bank controls, in particular the year of entry, number of foreign subsidiaries and the loan to deposit ratio are not significant. Comparing the coefficients for the different dummies the results suggest that Global MNB tend to outperform domestic banks and African MNB but not Emerging MNB. The performance of African MNB is consistently and significantly lower than that of both domestic banks and the other two categories of foreign banks. These two results (the out-performance of Global MNB and the under-performance of African MNB) highlights the significant disparity among foreign banks. Finally, while I control for a large number of firm and host country observable variables, there may be remaining unobservables that
ACCEPTED MANUSCRIPT
may generate a direct effect of ownership on firms’ ROE (omitted variable bias). I use the methodology developed by Altonji, Elder and Taber (2005) and applied by Beck, Degryse, De Haas and Van Horen (2017) in the banking literature to gauge the relative importance of omitted variable bias. I examine how the coefficient for the ownership dummies changes when I include a larger set of covariates. If this change is substantial then it is more likely that adding more (currently unobservable) covariates would further reduce the estimated impact. In contrast, if the coefficient turns out to be stable when adding controls, then we can be more confident when interpreting the results in a causal sense. Coefficient stability is measured by the ratio between the value of the coefficient in the regression including controls (numerator) and the difference between this coefficient and one derived from a regression without covariates (denominator). The ratio in column 1 is based on a comparison of the baseline (reported) specification with an unreported specification excluding all controls (only keeping the ownership dummies and the year fixed effects). The ratios in columns (2)-(7) are based on a comparison of the reported specification with an unreported specification excluding the following firm controls: assets, market share, solvency ratio, loan to deposit ratio, foreign subsidiaries and year of entry. Regarding Global MNB, the absolute value of this ratio is between 1.8 (column (2)) and 66 (column (1)). This suggests that, to explain the full effect of the Global MNB dummy, the covariance between unobserved factors and the Global MNB dummy needs to be at least two times as high as the covariance of the included controls. We can conclude that unobservables are unlikely to explain the entire effect of Global MNB on ROE. Concerning Emerging MNB coefficients, the Altonji ratios are much lower, around -1. The negative sign reflects the fact that the coefficient for Emerging MNB actually slightly increases when the set of covariates is included, suggesting that the estimates somewhat underestimate the true causal effect. In the case of the Emerging MNB dummy selection on unobservables would have to be as strong as the selection on observables to explain the effect. Since the ratio of selection on unobservables relative to selection on observables is likely to be less than 1 (Altonji et al., 2005), part of the Emerging MNB effect on ROE is probably real.
As a further robustness test I re-estimate the specifications on the smaller sample of surveyed banks in Table 3. I obtain qualitatively similar results on the three panels, although the magnitude of the coefficients is relatively larger than those in Table 216.
This provides reassurance that the pattern observed among the surveyed banks is similar to that in the larger population of banks in sub-Saharan Africa.
Overall, these results suggest that there are stable performance differences between
16This might be because the African countries where the fieldwork was conducted (Kenya, Tanzania, Ghana) are amongst the most developed banking markets in sub-Saharan Africa. It is possible that Global MNB and Emerging MNB invest relatively more in these markets, which translates into higher financial performance.
ACCEPTED MANUSCRIPT
the foreign affiliates of Global MNB and Emerging MNB and the domestic banks in sub-Saharan Africa, with foreign banks recording higher ROEs, except for the foreign affiliates of African MNB, for which the difference from domestic banks is not significant. This supports the first hypothesis, according to which Global MNB perform better than domestic banks.
The next section aims to identify the drivers of performance by first examining the operational efficiency of banks and then decomposing their profit into its revenues and expenses components.
— Table 3 insert here —
4.2.2. Banks’ operational efficiency
Cost-to-income ratio as the dependent variable. The dependent variable is the cost-to-income ratio and the estimations are done on the three panels. The results are reported in Table 4. The coefficient on the dummy Global MNB is always negative but it is only significant in the first panel. This might be because these banks derive their operational efficiency from their larger size as measured by total assets (scale effects). The coefficient on total assets is significantly negative, which may suggest a potential multicollinearity effect. In further (non-reported) estimations I excluded the total assets variable and the coefficient on Global MNB was significantly negative in the survivor and balanced panels. Concerning African MNB, the coefficient is alternatively positive and negative, depending on the specifications, but it is never significant.
The difference in operational efficiency, as measured by the cost-to-income ratio, be-tween the African MNB and the Global MNB dummies is positive, meaning that African MNB are less efficient than Global MNB, but it is only significant in Model 1. This only partially supports the second hypothesis, which states that Global MNB are more efficient than African MNB. However, the third hypothesis, according to which African MNB exhibit levels of operational efficiency similar to those of domestic banks in sub-Saharan Africa, is supported by the results, as no significant difference is observed in the cost-to-income ratio between these two groups of banks.
Finally, the coefficient on Emerging MNB is always negative, when bank’s size (to-tal assets) is controlled for, and it becomes significant and large (between 27 and 29) when further controls are included. In addition, the difference in coefficients between the Emerging MNB and African MNB dummies, and between the Global MNB and Emerg-ing MNB dummies, is significant. This higher operational efficiency for EmergEmerg-ing MNB might be related to the types of customers that they serve, often adopting a niche strategy by lending predominantly to a specific population group (for instance, the Bank of India or Bank of Baroda financing the business of the Indian diaspora). Overall, the results suggest that Emerging MNB exhibit higher operational efficiency than domestic banks. This conforms to the fourth hypothesis.
ACCEPTED MANUSCRIPT
— Table 4 insert here —
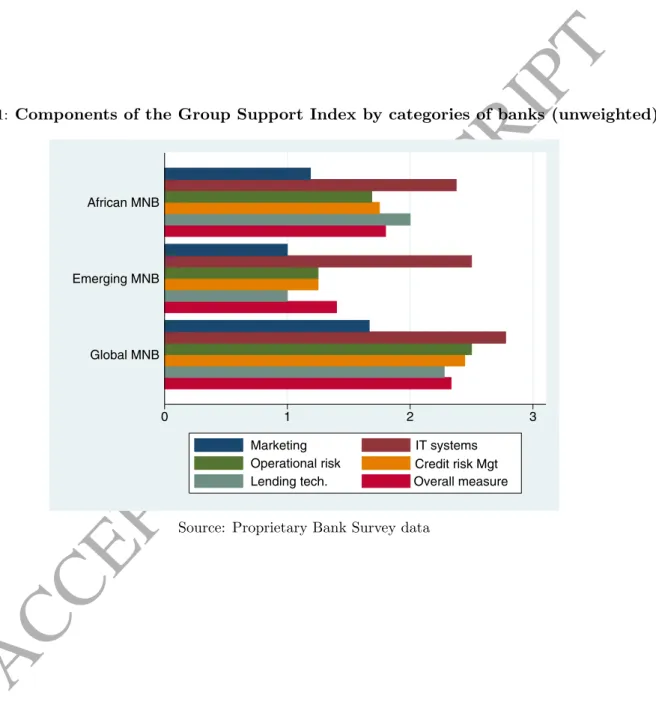
Operational efficiency: technological transfer from the parent bank. Cost-to-income ratios are driven by operating costs in the numerator such as spending on IT infrastructure. When banks are part of a larger group they can achieve economies of scale in operating systems, which should drive down their operating costs. A foreign affiliate of a large banking group may receive its IT and operating systems directly from the headquarters, which should reduce its operating expenses. Using survey data I examine the extent to which different categories of foreign banks receive support from their group in key areas of banking operations. In the survey respondents were asked to rate on a scale of 0 “none” to 3 “a lot” the extent to which they received information and technical support from their group in 5 areas of business operations: marketing know-how, IT and technological know-how, operational risk management techniques (fraud and corruption and process management), credit risk management techniques, and lending technology. I then take the unweighted average across all 5 items as the primary measure of support from headquarters (henceforth, “Group Support index”). The Group Support Index ranges from 0 to 3, a higher score indicating a higher level of support. Foreign affiliates depend more heavily on their headquarters for their IT systems (68% responded “a lot”) and for their lending technology (34% responded “a lot”), while around a third mentioned that they depended a lot on their headquarters for their operational risk and credit risk management, with only 8% depending on them for their marketing (see Figure 1).
— Figure 1 insert here —
The results reported in Table 5 indicate that the foreign affiliates of Global MNB receive more information and technical support from their group than foreign affiliates of African MNB or of Emerging MNB, especially in the domain of operational risk manage-ment techniques (fraud and corruption, process managemanage-ment) and credit risk managemanage-ment techniques. T-tests to compare means of the Group Support Index between these banks indicate that the differences are significant at the 5% level.
In addition, and consistently with the finding that foreign affiliates of Global MNB receive more technical support from their headquarters, the survey data collected also reveals that foreign affiliates of Global MNB receive more training from their group. 80% of bank managers of foreign affiliates of Global MNB indicated that they received training from their global headquarters on at least a bi-annual basis, while only 45% of managers of foreign affiliates of African MNB and 50% of managers of foreign affiliates of Emerging MNB declared that this was the case.
— Table 5 insert here —
Overall the survey data provides some evidence that foreign affiliates of Global MNB receive more information and technical support from their headquarters, consistent with them belonging to large groups with high operational capacity. This could also explain their slightly lower cost-to-income ratio through group-level scale economies in operating
ACCEPTED MANUSCRIPT
platforms.
Having established that Global MNB and Emerging MNB are consistently more prof-itable than domestic banks the next section examines the drivers of these performance differences in more depth.
5. Channels at work: investigating the drivers of performance differences
5.1. Interest income vs. interest expenses
To further investigate the drivers of financial performance I decompose the profit measure into its accounting components. Banks’ profits are driven by net interest margins and non interest expenditures. Indeed, banks’ profit before tax satisfies the following accounting identity:
Profit before tax = Net interest margin + (noninterest income−overheads
−other noninterest expenditures−loan loss provisioning) (2) As such, I re-estimate equation (1) with, alternatively, interest income and interest ex-penses (the difference between these two elements constituting the net interest margin) and bad loans (which impacts profit through lower interest income and higher loan loss provisioning) as dependent variables. The results for the three different samples of banks are presented in Table 6.
— Table 6 insert here —
The first column reports the ratio of interest income to average earning assets. In the first panel both African MNB and Emerging MNB report lower levels of interest income than domestic banks. However, the coefficient on the Emerging MNB dummy loses significance in the survivor sample and it is not significant in the balanced panel. For African MNB it remains significant at the 1% level in the survivor panel but it is weakly significant (at the 10% level) in the balanced panel.
The coefficient for Global MNB is always negative but never significant. The results in column 2, which reports the ratio of interest expenses to interest bearing liabilities, suggest that, while there are no significant differences between Global MNB and domestic banks in terms of interest income, there is however a significant difference between these two groups of banks concerning interest expenses generated by average interest-bearing liabilities. Indeed, Global MNB, as well as Emerging MNB and, to a lesser extent, African MNB, have a ratio of interest expenses to average liabilities that is on average one percent-age point lower than that of domestic banks. However, while the difference is significant at the 5% level for Global MNB and Emerging MNB, it is only weakly significant (or non significant, depending on the specification) for African MNB. This indicates that the foreign affiliates of both Global MNB and Emerging MNB have lower funding costs than
ACCEPTED MANUSCRIPT
domestic banks, as interest expenses comprise interests paid on deposits and borrowings to fund the loan portfolio. This supports hypotheses 5a and 5b.
In columns (3) and (4) I further investigate whether the difference in performance between foreign banks and domestic banks is related to the quality of their loan portfolio as identified by their level of bad loans. I use two different measures of bad loans, the ratio of non-performing loans to gross loans and the ratio of impaired loans to equity. I find that Global MNB have significantly lower levels of NPL/gross loans (but not when estimated on the balanced panel), while the difference is not significant for Emerging MNB and African MNB. Concerning impaired loans to equity, I find that only Emerging MNB record significantly lower impaired loans to equity than domestic banks. Impaired loans have a negative impact on the income statement: they reduce banks’ profit as they generate an increase in the provision for loan losses.
Overall these results indicate that lower interest expenses explain the differences in ROE between Global MNB and domestic banks, and between Emerging MNB and do-mestic banks. There may be two (non-exclusive) reasons why dodo-mestic banks face higher interest expenses than foreign banks. It might be because foreign banks pay lower in-terest for a given category of funding - this would be the case, for instance, if they paid higher interest on deposits than the foreign affiliates of Global MNB. It could also be that the foreign bank affiliates have a different liability mix. It would have an impact on their interest expenses if, for instance, foreign affiliates of Global MNB had a higher percentage of their funding composed of customer deposits, which pay low or zero interest to customers, while domestic banks were more exposed to longer-term financing bearing a higher interest cost. I do not have detailed information on the interest paid by banks for specific funds but I am able to examine whether the liability profiles of the groups of banks differ. The results are presented in the next sub-section.
5.2. Explaining differences in interest expenses: the liability mix
I examine whether the lower cost of funding of global banks is due to differences in the liability mix.
5.2.1. BankScope data
I use data from BankScope to investigate this issue further. Given the smaller number of banks reporting a detailed liability break-down, the sample size is reduced to 287 banks in total. The data in Table 7 suggests that a composition effect related to the liability mix may be driving the performance results: the foreign affiliates of Global MNB and Emerging MNB have a significantly lower share of their total funding composed of short-term capital compared to domestic banks. Foreign banks (in particular Global MNB and Emerging MNB) have a significantly higher share of their funding composed of current deposits (which may bear low or zero interest) than domestic banks, while
ACCEPTED MANUSCRIPT
they have a significantly lower share of their funding composed of saving deposits, which generally pay higher interest than current accounts. Overall this suggests that the foreign banks’ affiliates have a significantly different liability mix compared to domestic banks. In particular, they are less exposed to funding sources that bear higher interests, which translates into lower interest expenses and higher ROE. This further supports hypotheses 5a and 5b.
— Table 7 insert here —
5.2.2. Survey findings
Evidence from the bank survey corroborates this finding: foreign affiliates of Global MNB tend to benefit from a large deposit base through financing large corporates and institutional clients. In addition, large global banks tend to be very well established in the retail market and therefore have easy access to current customer deposits. Access to current customer deposits was a concern for a significant number of the small domestic banks surveyed. Indeed, while a large majority of the bank respondents across all bank categories considered that access to the interbank market was easy (83% of the banks considered that access to the interbank market was easy, somewhat easy or very easy), only 60% of the respondents considered that it was easy to gather customer deposits, with significant differences between banks. Respondents from foreign affiliates of global banks perceived access to deposits as easier than respondents from domestic banks and foreign affiliates of African MNB and Emerging MNB. Indeed, 45% of the domestic banks, 59% of the African MNB and 60% of the Emerging MNB surveyed considered that it was easy17 to access deposits, whereas this number was close to 90% for Global MNB. The
difference in the perception of access to deposits is significant between Global MNB and domestic banks (see Table 8).
It is worth noting that while global banks,in the context of Africa, benefit from access to cheaper sources of funding through their ability to attract deposits locally, in Central and Eastern Europe foreign banks also have a competitive advantage in accessing cheap funding but this is gained through their ability to tap into the internal capital market of their multinational group (De Haas and van Lelyveld, 2010).
In Africa the global brand of global banks helps them garner customers’ trust and attract customer deposits in a context of weaker local competition and less credible deposit insurance mechanisms as compared with Eastern Europe. Most of the survey respondents who perceived access to customer deposit to be difficult cited competition issues, followed by high interest rates to pay on deposits. These results further support hypothesis 5a, according to which the foreign affiliates of global banks exhibit lower interest expenses than the other groups of banks due to their affiliation to a large group.