Part of GE Healthcare
Data File 28-4015-41 AA DeCyder EDA
DeCyder Extended Data Analysis (EDA) Software
DeCyder™ Extended Data Analysis Software (DeCyder EDA)is high-performance informatics software for the analysis of large and combined proteomics data sets. DeCyder EDA was developed specifically for 2-D DIGE methodology and extends the statistical options offered in DeCyder 2-D Differential Analysis Software (DeCyder 2-D). This software enables the seamless integration of DeCyder EDA statistical results with DeCyder 2-D visualization data (Fig 1), thereby placing the results into biological context by linking to internal and external databases.
DeCyder EDA offers advanced statistical analysis in a simple-to-use format, uncovering patterns in expression data and relationships using multivariate analysis and sophisticated clustering methods. DeCyder EDA can be used to answer questions remaining from DeCyder 2-D Biological Variation Analysis (BVA), such as:
•
How many groups or classes exist in a given data set?•
Are there proteins or spots that behave similarly to agiven protein or spot (i.e. co-regulation)?
•
Are there proteins that might be used for the develop-ment of noninvasive tests (i.e. diagnostic markers)?•
Are there proteins or protein patterns that might becharacteristic of a biological state (e.g. tumor versus normal tissue)?
The software helps you understand regulatory pathways, find proteins with similar expression profiles, and group your samples according to common expression patterns. It identifies proteins that discriminate between disease stages, tumor types, or other sample subtypes—giving your Ettan™ DIGE results clarity and biological relevance.
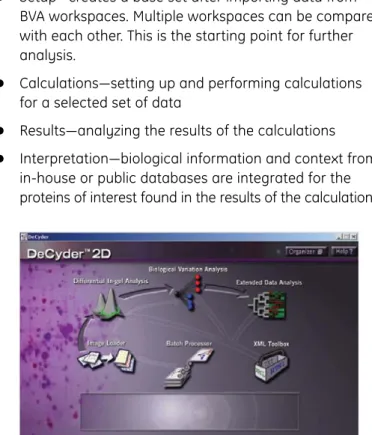
The DeCyder EDA analysis workflow consists of the following steps (Fig 2):
•
Setup—creates a base set after importing data from BVA workspaces. Multiple workspaces can be compared with each other. This is the starting point for further analysis.•
Calculations—setting up and performing calculations for a selected set of data•
Results—analyzing the results of the calculations•
Interpretation—biological information and context fromin-house or public databases are integrated for the proteins of interest found in the results of the calculations.
Setup Calculations Results or Interpretation Calculations or Interpretation Calculations or Interpretation Importing
and linking BVA workspaces Creating new sets and combining sets (optional) Filtering and possibly normalization Importing MS data Pick list BVA WS from the DeCyder database .xml .xml .txt EDA workspace End result Set Results of Calculations or Interpretation Calculations Base set
Setup
DeCyder EDA uses a set of data for analysis. A set is a group of spot maps with matched spots, that is a group of spot maps and proteins. A set of data can be displayed in several ways depending on the context, for example as a heat map where each row represents a protein and each column represents a spot map.
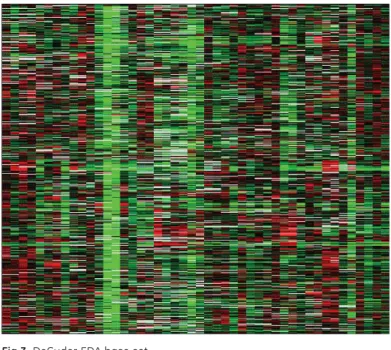
The original data set consists of the data imported from the Biological Variance Analysis (BVA) workspaces and linked in the DeCyder EDA workspace. Before any analyses can be performed, an EDA workspace and a base set (Fig 3) must be created from the BVA workspaces. Setup consists of three main steps:
1. Workspace: creating an EDA workspace by importing and linking BVA workspaces.
2. Experimental design: assigning experimental groups and conditions for the different samples included in the EDA workspace. The existing experimental design in BVA is preserved.
3. Base set creation: creating the base set automatically or manually by filtering and normalization of the data.
Calculations and Results
After setup is finished and a base set is created, calcula-tions are enabled. The different calculation methods are divided into four main groups:
•
Differential Expression Analysis—finds differences in expression between two or more groups•
Principal Components Analysis (PCA)—identifies outliers and initial groupings of the data•
Pattern Analysis—identifies similarities in protein expression•
Discriminant Analysis—identifies diagnostic or prognostic markers, creates classifiers, and classifies unknown samplesThere are a number of subanalyses within each of the calculation groups. The different calculations that might be selected can be performed in any order.
The Calculations steps are then reviewed in the Results step. Usually, one or more calculations on the base set are performed in the Calculations step. The results of the calcu-lations are then analyzed in the Results step. New sets of data can be extracted from the analyses.
It is then possible to:
•
Return to the Calculations step and perform calculations on new or old sets with other settings or to perform new calculations.•
Interpret the results.Differential Expression Analysis
Differential expression analysis, such as Student’s t-test and Analysis Of Variance (ANOVA), can be used to find significantly expressed proteins and to reduce the data set, for example limiting it to proteins that show changes in expression level (Fig 4).
Fig 4.Results from Differential Expression Analysis calculations. Fig 3.DeCyder EDA base set.
Principal Components Analysis
PCA reduces the dimensionality of a data set by defining principal components that describes a percentage of the total variance of the data. The first principal component will describe the greatest amount of variance of the data, the second principal component the second greatest, and so on. This feature helps to identify some underlying sources of variation, and will give a first impression if, and how well groups and classes might be separated (Fig 5). This type of analysis is extremely sensitive to outliers and can help to identify possible mismatches. If a mismatch is suspected, you can easily open the BVA workspace to inspect the original data for that spot and make any necessary corrections.
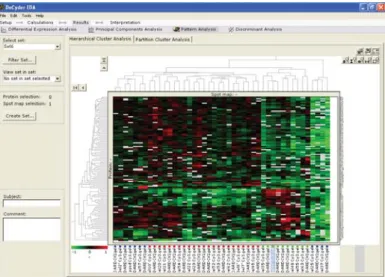
Pattern Analysis
This process finds patterns in the expression profiles in the DeCyder EDA data without any prior information about the variables (Fig 6). The algorithms in DeCyder EDA can help in finding patterns in proteins, spot maps, and expression groups. In pattern analysis, four types of unsupervised clustering can be applied:
•
Hierarchical clustering, which is displayed as a heat map with dendrogram, showing if and how many different classes exist in the data set•
K-means clustering, which shows clusters of proteins with similar expression patterns•
Self-organizing maps, which finds proteins that vary in similar ways and places them into a defined number of clusters but keeps the topology of the data. Clusters that show similar profiles are shown next to each other.•
Gene shaving, which is used to identify groups ofobjects that have similar expression profiles and optimal variation properties, meaning high variance between clusters but high coherence within each cluster. Gene shaving is not like other unsupervised algorithms because objects can be assigned to several clusters.
Discriminant Analysis
Discriminant analysis identifies markers and creates classifiers for unknowns. This analysis also helps find proteins that might be useful for the development of noninvasive diagnostic tests (Fig 7).
Fig 7.Results from Discriminant Analysis calculations, with Classifier Creation tab shown.
Fig 6.Results from Pattern Analysis calculations, with Hierarchical Cluster Analysis tab shown.
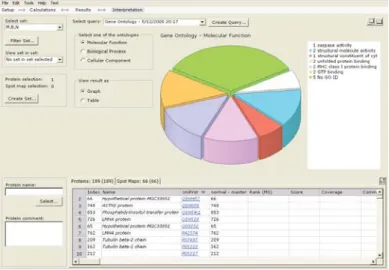
Interpretation
Interpretation is a very powerful tool used to get biological information from different public or local databases regard-ing the proteins of interest. The results from the queries are displayed in a user-friendly way. Four different queries exist in DeCyder EDA:
•
Gene Ontology (Fig 8)—to get information from the database (provided by the Gene Ontology Consortium) on each protein’s molecular functions, whether the protein is involved in any biological process, and whether the protein is part of any cellular component•
UniProt Features—to get information on the proteinsfrom the UniProt Features database
•
Pathways—to get information from the KEGG database on the pathways to which the proteins belong•
PubMed—to get articles from PubMed on the different proteinsNote: To be able to use the PubMed query, a license for discoveryHub software must be purchased from GE Healthcare. Installation information is provided with the discoveryHub software. Settings for discoveryHub software must be made in the Database Administration Tool in DeCyder 2-D software. For more information on these set-tings, please see the user manual DeCyder Extended Data Analysis module Version 1.0,code number 28-4010-07.
Specifications
PC requirements
Operating system Windows™ XP Professional with SP1 or SP2 Processor Pentium™ 4 processor, 1.5 GHz minimum
RAM Minimum 1 GB
Video card Capable of 32-bit color
Video card driver needs to support OpenGL (v1.2 or later) and have a 24-bit Z-buffer. Ensure that the latest compatible driver is installed.
64 MB DRAM or more Color resolution Set to 32-bit color
Screen resolution Min 1024 x768 pixels, landscape Hard drive Client installation: 20 GB free space
Server or standalone: 120 GB recommended, three partitions mounted DVD-ROM drive Required
LAN 100 Mbits LAN card for client/server
Virtual memory Set so that the total amount of available memory, including physical RAM, is greater than 2.5 GB
Web browser Internet Explorer™ v5.5 or higher
E-licenses An e-license is required for access to DeCyder EDA. An additional e-license is required for access to DeCyder 2-D software.
File specifications
Ordering information
DeCyder Extended Data Analysis Software, one network user license 28-4012-03
DeCyder Extended Data Analysis Software, four additional network user licenses 28-4012-05
Related products
DeCyder 2-D Differential Analysis Software v6.5, preinstalled network 28-4012-01
(including PC and single concurrent network user license)
DeCyder 2-D Differential Analysis Software v6.5, one network user license 11-0035-82
Asia Pacific Tel: +852 2811 8693 Fax: +852 2811 5251
Australasia Tel: + 61 2 9899 0999 Fax: +61 2 9899 7511
Austria Tel: 01/57606-1619 Fax: 01/57606-1627
Belgium Tel: 0800 73 888 Fax: 03 272 1637
Canada Tel: 1 800 463 5800 Fax: 1 800 567 1008
Central, East, & Tel: +43 1 982 3826 Fax: +43 1 985 8327
South East Europe
Denmark Tel: 45 16 2400 Fax: 45 16 2424
Finland & Baltics Tel: +358-(0)9-512 39 40 Fax: +358 (0)9 512 39 439
France Tel: 01 69 35 67 00 Fax: 01 69 41 96 77
Germany Tel: 0761/4903-490 Fax: 0761/4903-405
Italy Tel: 02 27322 1 Fax: 02 27302 212
Japan Tel: +81 3 5331 9336 Fax: +81 3 5331 9370
Latin America Tel: +55 11 3933 7300 Fax: +55 11 3933 7304
Middle East & Africa Tel: +30 210 9600 687 Fax: +30 210 9600 693
Netherlands Tel: 0165 580 410 Fax: 0165 580 401
Norway Tel: 815 65 555 Fax: 815 65 666
Portugal Tel: 21 417 7035 Fax: 21 417 3184
Russia & other Tel: +7 (095) 232 0250, 956 1137 Fax: +7 (095) 230 6377
C.I.S. & N.I.S
South East Asia Tel: 60 3 8024 2080 Fax: 60 3 8024 2090
Spain Tel: 93 594 49 50 Fax: 93 594 49 55
Sweden Tel: 018 612 1900 Fax: 018 612 1910
Switzerland Tel: 0848 8028 12 Fax: 0848 8028 13
UK Tel: 0800 616928 Fax: 0800 616927
USA Tel: +1 800 526 3593 Fax: +1 877 295 8102
www.amershambiosciences.com/dige
GE Healthcare
Amersham Place
Little Chalfont
Buckinghamshire
HP7 9NA
UK
General Electric Company reserves the right , subject to any regulatory approval if required, to make changes in specifica-tions and features shown herein, or discontinue the product described at any time without notice or obligation. Contact your GE Representative for the most current information. © 2005 General Electric Company—All rights reserved. GE and GE Monogram are trademarks of General Electric Company. DeCyder and Ettan are trademarks of Amersham Biosciences Limited. Windows and Explorer are trademarks of Microsoft Corporation. Pentium is a trademark of Intel Corporation. Amersham Biosciences, a General Electric company, going to market as GE Healthcare.
2- D Fluorescence Difference Gel Electrophoresis (2-D DIGE) technology is covered by US patent numbers US6,043,025 and US6,127,134 and foreign equivalents and exclusively licensed to Amersham Biosciences.